. 2024 Dec 4;19(1):101.
doi: 10.1186/s40793-024-00642-w.

Unveiling the bacterial diversity and potential of the Avicennia marina ecosystem for enhancing plant resilience to saline conditions

Affiliations

Unveiling the bacterial diversity and potential of the Avicennia marina ecosystem for enhancing plant resilience to saline conditions

Amal Khalaf Alghamdi et al. Environ Microbiome. .

Abstract

Background: Avicennia marina ecosystems are critical for coastal protection, water quality enhancement, and biodiversity support. These unique ecosystems thrive in extreme saline conditions and host a diverse microbiome that significantly contributes to plant resilience and growth. Global food security is increasingly threatened by crop yield losses due to abiotic stresses, including saline soils. Traditional plant breeding for salt tolerance is both costly and time-consuming. This study explores the potential of bacteria from A. marina to enhance plant growth under saline conditions, emphasizing their ecological significance.

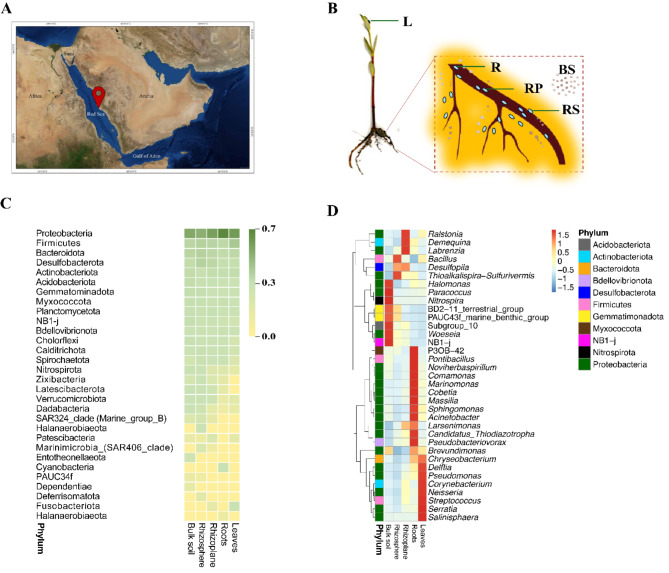
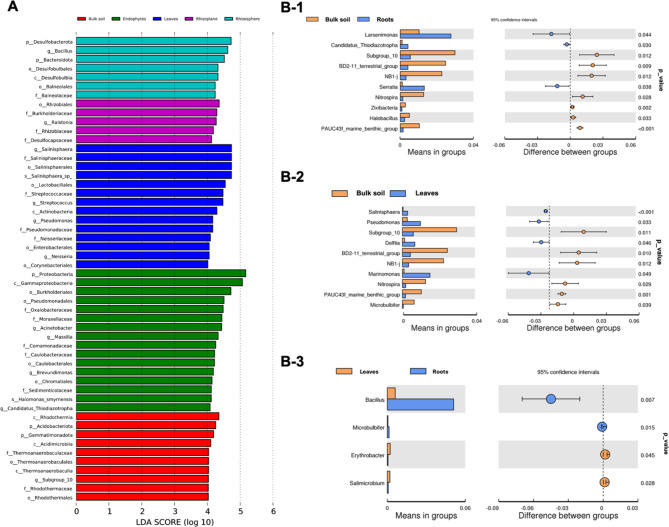
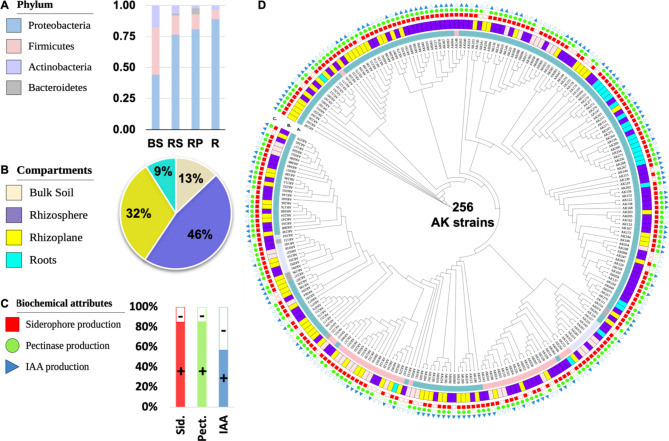
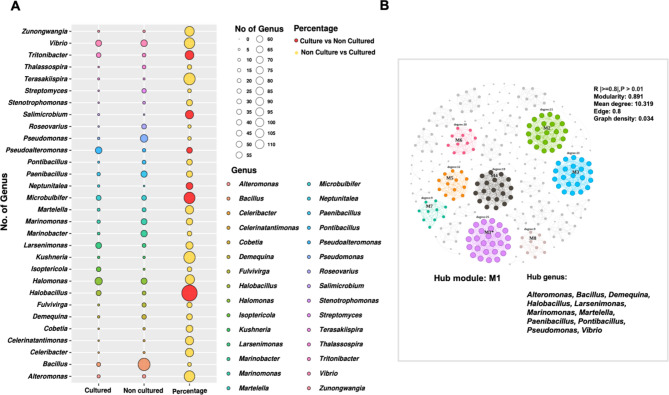
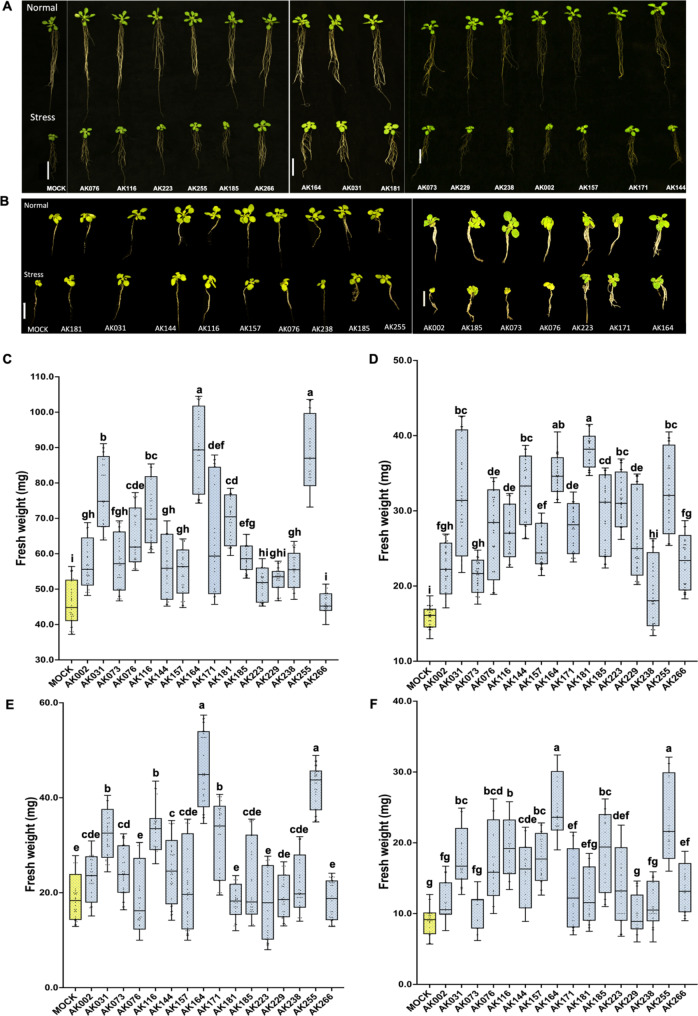
Results: We analyzed the microbiome of A. marina from the Red Sea coast using high-throughput Illumina sequencing and culture-dependent methods across various compartments (bulk soil, rhizosphere, rhizoplane, roots, and leaves). Our findings revealed distinct compartment-specific microbial communities, with Proteobacteria being the dominant phylum. Functional predictions indicated diverse microbial roles in metal uptake and plant growth promotion (PGP). Remarkably, our culture-dependent methods allowed us to recover 56% of the bacterial diversity present in the microbiome, resulting in the isolation and characterization of 256 bacterial strains. These isolates were screened for PGP traits, including salt and heat tolerance, siderophore production, and pectinase activity. Out of the 77 bacterial isolates tested, 11 demonstrated a significant ability to enhance Arabidopsis growth under salt stress.

Conclusions: Our study highlights the ecological significance of mangrove microbiomes and the potential of culture collections in offering innovative solutions for ecological restoration and crop production in saline conditions. The unique collection of mangrove bacteria, particularly from the rhizosphere and endophytes, showcases significant PGP traits and stress tolerance capabilities. These findings emphasize the importance of functional traits, such as salt tolerance, in the recruitment of endophytic bacteria by plants over taxonomic affiliation. The identified bacterial strains hold potential not only for developing biofertilizers to improve crop productivity but also for ecological restoration projects aimed at rehabilitating saline-degraded lands, thereby contributing to overall ecosystem health and sustainability.

Keywords: Avicennia marina; And Plant-microbial interaction; Biostimulants; Global food security; Halophilic bacteria; Salt stress tolerance.


Conflict of interest statement

Declarations. Consent for publication: There is no conflict to consent for publication. Competing interests: The authors declare no competing interests. Conflict of interest: The authors declare that the research was conducted in the absence of any commercial or financial relationships that could be construed as a potential conflict of interest.

Figures

Fig. 1
Fig. 1
Microbial diversity and spatial distribution in Avicennia marina ecosystem along the red sea coast. (A) Geographical location of the Avicennia marina study site along the Red Sea coast, at KAUST, Thuwal, Saudi Arabia indicated by the red pin. (B) Schematic representation of the mangrove root system, illustrating key compartments: root (R), rhizoplane (RP), and rhizosphere (RS). (C) Heatmap depicting the relative abundance of bacterial phyla > 0.01%across different root compartments. The colour gradient indicates abundance levels, from low (light green) to high (dark green) (D) Functional diversity analysis of bacterial communities across compartments, shown in a color-coded grid. (E) Legend illustrating colour gradients used for abundance and diversity metrics
Fig. 2
Fig. 2
Microbial diversity and community structure across different Avicennia marina compartments. (A) Alpha diversity comparison using the Chao1 index, indicating species richness across bulk soil (BS), rhizosphere (RS), rhizoplane (RP), root endosphere (RE), and leaf endosphere (LE) compartments. Letters above boxplots denote statistically significant differences (p < 0.05). (B) Alpha diversity comparison using the Observed Species metric, highlighting variations in species richness among compartments, with significant differences denoted by letters. (C) UpSet plot illustrating the unique and shared amplicon sequence variants (ASVs) among different compartments, emphasizing compartment-specific microbial communities. (D) Principal Coordinate Analysis (PCoA) plot showing the clustering of microbial communities based on Bray-Curtis dissimilarity, with ellipses representing 95% confidence intervals. (E) Non-metric Multi-Dimensional Scaling (NMDS) analysis depicting the distribution of microbial communities, with an Adonis test result (p < 0.001, r² = 0.4) confirming significant differences among compartments
Fig. 3
Fig. 3
A) Histogram of linear discriminant analysis (LDA) score of LEfSe analysis higher than 4 of the bacterial communities between Roots (green), Leaves (blue), Rhizoplane (magenta), and Rhizosphere (cyan), and Bulk soil (red). The bar graph shows LDA scores for phytoplankton taxa. Only taxa meeting an LDA significant threshold > 2.0 are shown. The LDA score on the log10 scale is indicated at the bottom. The greater the LDA score is, the more significant the phylotype biomarker is in the comparison. B- Comparative taxonomic profiles at the genus level. (B-1) Bulk soil-roots, (B- 2) Bulk soil-leaves, and (B- 3) Roots-Leaves. The left panel is the abundance of species showing significant differences between groups. Each bar represents the mean value of the abundance in each species group, showing significant differences between groups. The right panel is the confidential interval of between-group variations. The left-most part of each circle stands for the lower 95% confidential interval limit, while the right-most part is the upper limit. The centre of the circle stands for the difference in the mean value. The circle’s colour agrees with the group whose mean value is higher. The right-most value is the p-value of the significance test of between-group variations
Fig. 4
Fig. 4
Functional gene profiles and differential abundance acrossAvicennia marina compartments: (A) The heatmap displays the relative abundance of Clusters of Orthologous Groups (COGs) in bulk soil, rhizosphere, rhizoplane, roots, and leaves. The color gradient ranges from blue (low abundance) to red (high abundance), highlighting how microbial communities adapt functionally to different microhabitats. Hierarchical clustering reveals compartment-specific patterns of microbial gene expression, emphasizing the specialized roles of these communities in the mangrove ecosystem. (B) The series of boxplots compares the abundance of selected KEGG Orthology (KO) genes between specific compartments. Each boxplot represents a different gene and shows how its abundance varies between compartments, such as bulk soil vs. rhizosphere, bulk soil vs. rhizoplane, or endophytes vs. leaves. The x-axis labels indicate the compartment groups, while the y-axis displays gene abundance. Significant differences in gene abundance are highlighted, suggesting distinct microbial functional roles that contribute to plant growth and stress resilience in varying environmental conditions
Fig. 5
Fig. 5
Cultured bacteria collection and functional attributes across Avicennia marina compartments (A) The bar plot shows the distribution of the 256 cultured bacterial isolates across different phyla, including Proteobacteria, Firmicutes, Actinobacteria, and Bacteroidetes, providing an overview of the taxonomic diversity of the isolates. (B) The pie chart illustrates the distribution of the 256 isolates among the various compartments of origin, including bulk soil (9%), rhizosphere (13%), rhizoplane (46%), and roots (32%). This emphasizes the relative abundance of cultured isolates across different Avicennia marina microhabitats. C)This panel highlights the common plant growth-promoting (PGP) traits exhibited by the isolates, such as: Siderophore Production (red): Facilitating iron acquisition for plants. Pectinase Production (green): Enabling the breakdown of plant cell wall components. IAA Production (blue): Promoting plant growth through phytohormone synthesis. The “+” and “-” symbols indicate the presence or absence of these PGP traits among the isolates D) The circular phylogenetic tree depicts the relationships among the 256 cultured bacteria based on 16 S rRNA gene sequencing. The tree provides a comprehensive view of the phylogenetic diversity of the mangrove-associated bacteria, with branches color-coded according to the phyla and compartments of origin, linking taxonomic identity to ecological niche
Fig. 6
Fig. 6
Genus-level distribution and network analysis of cultured bacteria from Avicennia marina (A) The bubble plot: the bubble plot represents the distribution of bacterial genera across different Avicennia marina compartments, with each row corresponding to a specific genus. The size of the bubbles indicates the relative abundance of each genus, with larger bubbles representing higher abundance. The x-axis denotes the different compartments, while the y-axis lists the bacterial genera. The color of each bubble corresponds to the genus, as indicated by the color legend on the right, providing a visual summary of how bacterial communities are distributed throughout the mangrove microhabitats. bubble size guide, indicating the relative abundance values associated with each bubble size, ranging from 0 to 110. (B) Network Analysis The network diagram illustrates the co-occurrence relationships among bacterial genera isolated from Avicennia marina. Nodes represent bacterial genera, and edges (connecting lines) indicate significant co-occurrence interactions (p < 0.01). The nodes are color-coded to match the genera in the bubble plot, and the size of each node reflects the abundance of the genus. The network layout highlights clusters of closely associated bacteria, suggesting potential functional or ecological interactions within the mangrove microbiome
Fig. 7
Fig. 7
Growth Enhancement of Arabidopsis thaliana Seedlings by Candidate Bacteria Seedling Growth on Square Plate Method (SPM) and Submerged Disk Method (SDM) Plates: A- Images show A. thaliana seedlings inoculated with candidate bacteria versus non-inoculated controls (MOCK) under both normal (½ MS) and Saline Stress conditions (½ MS + 100mM NaCl) using the SPM methods. B- Images show A. thaliana seedlings inoculated with candidate bacteria versus non-inoculated controls (MOCK) under both normal (½ MS) and Saline Stress conditions (½ MS + 100mM NaCl) using the SDM methods. Bacterial inoculation visibly enhances root and shoot growth, especially under saline stress. C-F) Box Plots: plots of the fresh weight mean of A. thaliana grown NaCl after inoculated with the candidate bacteria in comparison with non-inoculated (MOCK) plants. C- SPM on 1/2MS, D- SPM on 1/2MS + 100mM. E- SDM on 1/2MS, F- SDM on 1/2MS + 100mM. Inoculated seedlings generally show higher fresh weight than MOCK, demonstrating the growth-promoting effects of candidate bacteria, particularly under saline stress

Similar articles

References

    1. United Nations DoEaSA, Population Division. World Population Prospects 2022: Summary of Results. UN DESA/POP/2022/TR/NO 3 2022.
    1. Qadir M, Quillérou E, Nangia V, Murtaza G, Singh M, Thomas RJ, Drechsel P, Noble AD. Economics of salt-induced land degradation and restoration. Nat Resour Forum. 2014;38(4):282–95.
    1. Kearl J, McNary C, Lowman JS, Mei C, Aanderud ZT, Smith ST, West J, Colton E, Hamson M. BL. N: salt-tolerant halophyte rhizosphere Bacteria stimulate growth of Alfalfa in Salty Soil. Front Microbiol 2019, 10(1849). - PMC - PubMed
    1. Kumar A, Singh S, Gaurav AK, Srivastava S, Verma JP. Plant growth-promoting Bacteria: Biological Tools for the mitigation of salinity stress in plants. Front Microbiol 2020, 11. - PMC - PubMed
    1. Saad MM, Eida AA, Hirt H. Tailoring plant-associated microbial inoculants in agriculture: a roadmap for successful application. J Exp Bot. 2020;71(13):3878–901. - PMC - PubMed

LinkOut - more resources