. 2024 Dec 5;22(1):584.
doi: 10.1186/s12964-024-01943-w.

The CCL5/CCR5/SHP2 axis sustains Stat1 phosphorylation and activates NF-κB signaling promoting M1 macrophage polarization and exacerbating chronic prostatic inflammation

Affiliations

The CCL5/CCR5/SHP2 axis sustains Stat1 phosphorylation and activates NF-κB signaling promoting M1 macrophage polarization and exacerbating chronic prostatic inflammation

Chen Jin et al. Cell Commun Signal. .

Abstract

Background and objective: Chronic prostatitis (CP) is a condition markered by persistent prostate inflammation, yet the specific cytokines driving its progression remain largely undefined. This study aims to identify key cytokines involved in CP and investigate their role in driving inflammatory responses through mechanistic and therapeutic exploration.

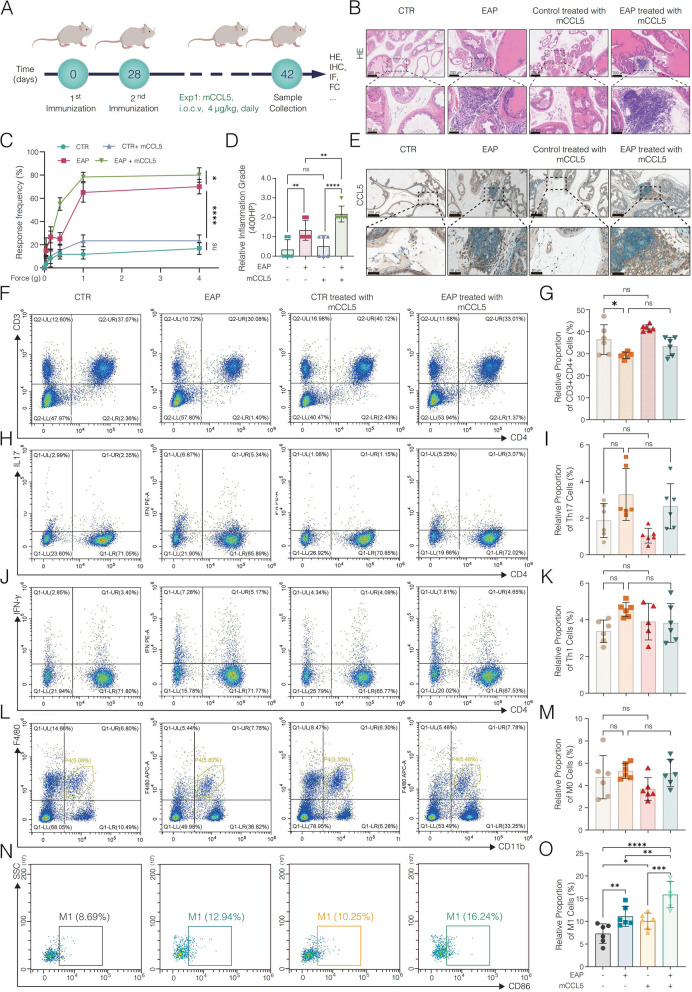
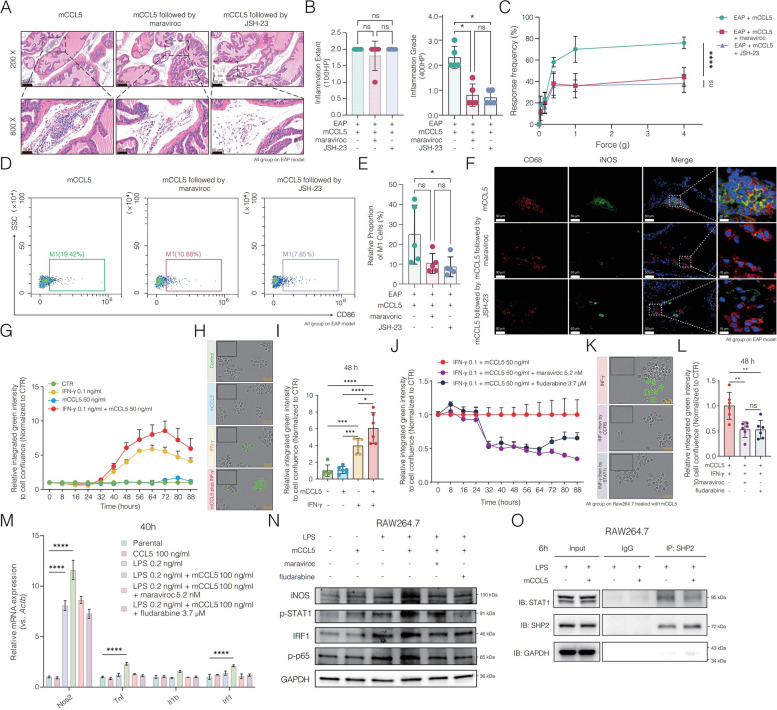
Methods: A 48-cytokine panel test was conducted to compare the plasma cytokine profiles between participants with CP-like symptoms (CP-LS) and healthy controls. Experimental autoimmune prostatitis (EAP) models were used for functional validation, with further mechanistic studies performed through in vivo and in vitro assays. Pharmacological inhibition was applied using maraviroc, and pathway inhibitors to assess therapeutic potential.

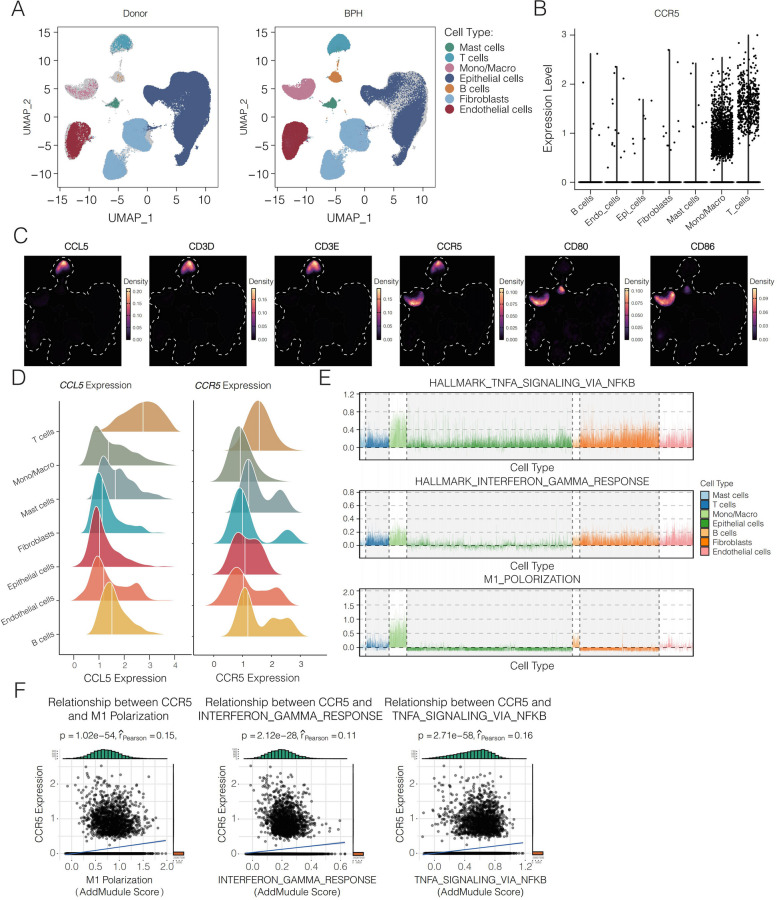
Results: Our analysis identified CCL5 as one of the most prominently elevated cytokines in CP-LS patients. Further validation in the EAP model mice confirmed elevated CCL5 levels, highlighting its role in driving prostatic inflammation. Mechanistic studies revealed that CCL5 interacts with the CCR5 receptor, promoting M1 macrophage polarization and activating key inflammatory signaling pathways, including Stat1 and NF-κB, as indicated by increased phosphorylation of Stat1 and p65. In vitro, CCL5 combined with LPS stimulation amplified these effects, further promoting M1 polarization. CCL5 also sustained Stat1 activation by inhibiting its dephosphorylation through reduced interaction with SHP2, leading to prolonged inflammatory signaling. Single-cell transcriptomics confirmed high CCR5 expression in macrophages, correlating with inflammatory pathways. Pharmacological inhibition of CCR5, or its downstream signaling, significantly reduced macrophage-driven inflammation both in vivo and in vitro.

Conclusion: These findings establish the CCL5/CCR5 axis as a critical driver of persistant prostatic inflammation and present it as a potential therapeutic target for CP.

Keywords: CCL5/CCR5 axis; Chronic prostatitis; Fludarabine; M1 macrophage; Maraviroc; NF-κB signaling; Stat1 signaling.


Conflict of interest statement

Declarations. Ethics approval and consent to participate: All procedures involving human participants, including obtaining written informed consent, were conducted in accordance with the principles outlined in the Helsinki Declaration and were approved by the Ethics Committee of the First Affiliated Hospital of Anhui Medical University on June 10, 2020 (PJ-2020–07-11). Written informed consent was obtained from all participants involved in this study. All animal experiments were conducted in compliance with the guidelines of the Animal Care and Utilization Committee of the Animal Center of Anhui Medical University, with approval (approval no. LLSC20241750). Consent for publication: Informed consent for publication was obtained from all participants involved in the study. Competing interests: The authors declare no competing interests.

Figures

Fig. 1
Fig. 1
CCL5 expression is upregulated in CP-LS patients and EAP model mice. A Heatmap depicting the plasma cytokine profiles of CP-LS patients and healthy controls, with 48 cytokines evaluated. B Bar plot showing significantly altered cytokines, including RANTES/CCL5, GRO-alpha, HGF, IL-4, IL-5, IL-9, IL-17, MIG, MIP-1beta, and PDGF-BB. Each dot represents an individual participant's plasma sample. C Scatter plot showing Pearson correlation between CCL5 expression and the course of CP-LS. D ELISA results illustrating plasma CCL5 levels in EAP and control mice, with each dot representing an individual mouse. E Immunohistochemistry images of CCL5 expression in the prostate of EAP and control mice. Scale bars: 100 μm (low-power field, lpf); 50 μm (high-power field, hpf). For (B) and (D), data are shown as means ± standard deviation (st.d.). *P < 0.05, **P < 0.01, ***P < 0.001, ****P < 0.0001 (independent-samples t-test). Abbreviations: CP-LS, chronic prostatitis-like symptoms; EAP, experimental autoimmune prostatitis; st.d., standard deviation; lpf, low-power field; hpf, high-power field
Fig. 2
Fig. 2
CCL5 exacerbates EAP progression through eliciting M1 macrophage infiltration A Schematic diagram showing EAP model induction, treatment, and subsequent experiments. B Representative H&E staining of prostate sections from control, EAP, control mice treated with mCCL5, and EAP mice treated with mCCL5. Scale bars: 200 μm (lpf); 50 μm (hpf). C Line chart illustrating pelvic pain responses in the indicated groups of mice. D Quantification of inflammation grades across groups (n = 6 per group). E Immunohistochemistry of CCL5 in the prostate interstitium in the indicated groups. Scale bars: 200 μm (lpf); 50 μm (hpf). Flow cytometry analysis and quantification of CD3 + CD4 + T cesll (F), (G), Th17 cells (CD3 + CD4 + IL-17 +) (H), (I), Th1 cells (CD3 + CD4 + IFN-γ +) (J), (K), M0 macrophage cells (F4/80 + CD11b +) (L, M), M1 macrophage cells (F4/80 + CD11b + CD86 +) (NO) in the spleen tissues of contol, mCCL5-treated control, EAP, and mCCL5-treated EAP. Data are shown as means ± st.d. (D), (F), (I) One-way ANOVA with Tukey's multiple comparisons for (D), (G), (I), (K), (M), and (O). Single-factor repeated-measures ANOVA for C, showing statistics at peak force: *P < 0.05, **P < 0.01, ***P < 0.001, ****P < 0.0001. Abbreviations: EAP, experimental autoimmune prostatitis; H&E, hematoxylin and eosin; mCCL5, mouse recombinant CCL5; lpf, low-power field; hpf, high-power field; st.d., standard deviation
Fig. 3
Fig. 3
Blocking CCR5 diminishes EAP prostatic inflammation through inhibiting M1 macrophage polarization. A UMAP projection showing the immune cell distribution landscape. B Violin plot visualizing Ccr5 expression in a specific cluster. C UMAP density plots illustrating the expression of Ccl5, Cd3d, Cd3e, Ccr5, Cd68, Cd86, and Cd163 across cell types (black = low/no expression, yellow = high expression density). D Immunofluorescence staining of M1 macrophages expressed CCR5 (CCR5 + iNOS +) in prostate tissue from the indicated groups. Scale bars: 50 μm (lpf); 10 μm (hpf). E qPCR analysis showing Nos2, Il1b, and Tnf expression in RAW264.7 cells stimulated with LPS, mCCL5, and LPS plus mCCL5 for 24 h under indicated conditions. F Western blot analysis of iNOS in RAW264.7 cells treated with LPS, mCCL5, or a combination for 24 h. G qPCR analysis of Nos2, Il1b, and Tnf expression in RAW264.7 cells under the same conditions, with the addition of maraviroc stimulation for 24 h. H Western blot analysis of iNOS in RAW264.7 under the same conditions as in (G). I Representative H&E staining of prostates from EAP, EAP treated with mCCL5, and EAP treated with maraviroc groups. J Line chart illustrating pelvic pain responses between the indicated groups of mice. K Quantification of inflammation grades between groups (n = 3 per group). L Flow cytometry analysis of M1 macrophages (F4/80 + CD11b + CD86 +) in the spleen tissues of EAP, mCCL5-treated EAP, and maraviroc-treated EAP mice. M Quantification of M1 macrophage proportions per group (n = 3 per group). N Immunofluorescence staining of M1 macrophages (CD68 + iNOS +) in prostate tissue from EAP, EAP treated with mCCL5, and EAP treated with maraviroc groups. Data shown as means ± st.d. One-way ANOVA with Tukey's multiple comparisons for (B), (K), and (M). Two-way ANOVA with Dunnett's multiple comparisons for (E) and (G). :Single-factor repeated-measures ANOVA for (L), showing statistics at peak force: *P < 0.05, **P < 0.01, ***P < 0.001, ****P < 0.0001. Abbreviations: EAP, experimental autoimmune prostatitis; mCCL5, mouse recombinant CCL5; lpf, low-power field; hpf, high-power field; st.d., standard deviation
Fig. 4
Fig. 4
The CCL5/CCR5 axis enhances NF-κB and Stat1 signaling to promote M1 macrophage polarization. A RNA-sequencing analysis of Ccl5 and its receptors (Ccr1, Ccr3, Ccr4, Ccr5) in prostate tissue from different treatment groups. B Hallmark pathway enrichment analysis for the indicated groups (n = 3 per group). C, D GSVA scores for the HALLMARK-INTERFERON-GAMMA-RESPONSE (C) and TNFA-SIGNALING-VIA-NF-KB (D) pathways. E, F Heatmap showing the expression of genes involved in the INTERFERON-GAMMA-RESPONSE/STAT1 (E) and TNFA-SIGNALING-VIA-NF-KB (F) pathways. G Immunohistochemical staining of phosphorylated-p65 and -Stat1 in the prostate interstitium. Scale bars: 100 μm (lpf); 50 μm (hpf). H Western blot analysis of iNOS, p-Stat1, Stat1, p-p65, p65, and IRF1 in RAW264.7 cells under indicated treatments. Data presented as means ± s.e.m. Two-way ANOVA with Dunnett's multiple comparisons: *P < 0.05, **P < 0.01, ***P < 0.001, ****P < 0.0001. Abbreviations: EAP, experimental autoimmune prostatitis; mCCL5, mouse recombinant CCL5; GSVA, gene set variation analysis; lpf, low-power field; hpf, high-power field; s.e.m., standard error of the mean
Fig. 5
Fig. 5
Human sample survey reveals CCL5/CCR5-driven inflammatory pathways involved in M1 macrophage activation. A UMAP projection showing the immune landscape of human prostate samples from BPH and younger donor groups. B Violin plot visualizing CCR5 gene expression within each cell cluster. C Density plots from UMAP projections displaying expression patterns of CCL5, CD3D, CD3E, CCR5, CD80, and CD86 in different cell types. Black areas indicate low or no expression, while luminous yellow represents high-density expression. D Ridge plot illustrating the distribution of CCL5 and CCR5 expression across various cell types. E Gene set enrichment analysis (GSEA) scores for TNFA-SIGNALING-VIA-NFKB, INTERFERON-GAMMA-RESPONSE, and M1-MACROPHAGE-POLARIZATION pathways across different cell types. Horizontal bars represent different cell types, and the vertical width of each bar indicates the density of pathway scores. F Scatter plot with a regression line showing the correlation between CCR5 expression and the GSEA scores for TNFA-SIGNALING-VIA-NFKB, INTERFERON-GAMMA-RESPONSE, and M1-MACROPHAGE-POLARIZATION pathways
Fig. 6
Fig. 6
Mechanistic dissection of the role of the CCL5/CCR5 axis in prostate inflammation through activation of NF-κB and Stat1 pathways. A H&E staining of prostate tissue from EAP mice treated with maraviroc or JSH-23 followed by mCCL5 administration. Scale bars: 200 μm (lpf); 50 μm (hpf). B Quantification of inflammation grades among groups (n = 5 per group, 100 HP and 400 HP). C Line chart depicting pelvic pain response rates in the indicated mouse groups. D Flow cytometry analysis showing the proportion of M1 macrophages (F4/80 + CD11b + CD86 +) among total macrophages (F4/80 + CD11b +) in the spleen tissues of EAP, EAP treated with maraviroc, and EAP treated with JSH-23 mice. E Quantification of M1 macrophages per group (n = 5 per group). F Immunofluorescence staining of M1 macrophages (CD68 + , red; iNOS + , green) in prostate tissue from the indicated groups. Scale bars: 50 μm (lpf); 10 μm (hpf). G Line chart showing time-dependent changes in the relative ratio of integrated green intensity divided by cell confluence, normalized to control (CTR). H, I Representative images and quantification of RAW264.7 cells after 48-h treatments. Scale bars: 50 μm. J Line chart displaying the time-dependent changes in the relative ratio of integrated green intensity normalized to IFN-γ and mCCL5 co-treated cells. K, L Representative images and quantification of RAW264.7 cells after 48-h treatments. Scale bars: 50 μm. M qPCR results showing Nos2, Il1b, Tnf, and Irf1 levels in RAW264.7 cells treated with LPS, mCCL5, LPS treated with mCCL5, LPS treated with mCCL5 then by maraviroc, or LPS treated with mCCL5 then by fludarabine for 40 h. maraviroc was pretreated for 1–2 h; fludarabine was pretreated for 18–24 h (each sample measured in triplicate). N Western blot analysis showing iNOS, p-Stat1, Stat1, and IRF1 levels in RAW264.7 cells treated under the same conditions as the qPCR assays. O Co-immunoprecipitation showing that mCCL5 affects the interaction of SHP2 with Stat1. Data are presented as means ± st.d. One-way ANOVA with Tukey’s multiple comparisons (B), (E), (I), (L); single-factor repeated-measures ANOVA (C); and two-way ANOVA with Dunnett’s multiple comparisons (M): *P < 0.05, **P < 0.01, ***P < 0.001, ****P < 0.0001. Abbreviations: EAP, experimental autoimmune prostatitis; mCCL5, mouse recombinant CCL5; H&E, hematoxylin and eosin; lpf, low-power field; hpf, high-power field; st.d., standard deviation

References

    1. Cai T, Alidjanov J, Palagin I, Medina-Polo J, Nickel JC, Wagenlehner FME. Chronic prostatitis/chronic pelvic pain syndrome (CP/CPPS): look to the future. Prostate Cancer Prostatic Dis. 2023;27(2):239–41. - PubMed
    1. Magistro G, Wagenlehner FM, Grabe M, Weidner W, Stief CG, Nickel JC. Contemporary management of chronic prostatitis/chronic pelvic pain syndrome. Eur Urol. 2016;69:286–97. - PubMed
    1. Zhang M, Liu Y, Chen J, Chen L, Meng J, Yang C, Yin S, Zhang X, Zhang L, Hao Z, et al. Single-cell multi-omics analysis presents the landscape of peripheral blood T-cell subsets in human chronic prostatitis/chronic pelvic pain syndrome. J Cell Mol Med. 2020;24:14099–109. - PMC - PubMed
    1. Breser ML, Salazar FC, Rivero VE, Motrich RD. Immunological mechanisms underlying chronic pelvic pain and prostate inflammation in chronic pelvic pain syndrome. Front Immunol. 2017;8:898. - PMC - PubMed
    1. Vickman RE, Aaron-Brooks L, Zhang R, Lanman NA, Lapin B, Gil V, Greenberg M, Sasaki T, Cresswell GM, Broman MM, et al. TNF is a potential therapeutic target to suppress prostatic inflammation and hyperplasia in autoimmune disease. Nat Commun. 2022;13:2133. - PMC - PubMed

MeSH terms

LinkOut - more resources