. 2025 Feb;45(2):238-259.
doi: 10.1161/ATVBAHA.124.321421. Epub 2024 Dec 5.

SGK1-Mediated Vascular Smooth Muscle Cell Phenotypic Transformation Promotes Thoracic Aortic Dissection Progression

Affiliations

SGK1-Mediated Vascular Smooth Muscle Cell Phenotypic Transformation Promotes Thoracic Aortic Dissection Progression

Shuai Leng et al. Arterioscler Thromb Vasc Biol. 2025 Feb.

Abstract

Background: The occurrence of thoracic aortic dissection (TAD) is closely related to the transformation of vascular smooth muscle cells (VSMCs) from a contractile to a synthetic phenotype. The role of SGK1 (serum- and glucocorticoid-regulated kinase 1) in VSMC phenotypic transformation and TAD occurrence is unclear.

Methods: Four-week-old male Sgk1F/F (Sgk1 floxed) and Sgk1F/F;TaglnCre (smooth muscle cell-specific Sgk1 knockout) mice were administered β-aminopropionitrile monofumarate for 4 weeks to model TAD. The SGK1 inhibitor GSK650394 was administered daily via intraperitoneal injection to treat the mouse model of TAD. Immunopurification and mass spectrometry were used to identify proteins that interact with SGK1. Immunoprecipitation, immunofluorescence colocalization, and GST (glutathione S-transferase) pull-down were used to detect molecular interactions between SGK1 and SIRT6 (sirtuin 6). RNA-sequencing analysis was performed to evaluate changes in the SIRT6 transcriptome. Quantitative chromatin immunoprecipitation was used to determine the target genes regulated by SIRT6. Functional experiments were also conducted to investigate the role of SGK1-SIRT6-MMP9 (matrix metalloproteinase 9) in VSMC phenotypic transformation. The effect of SGK1 regulation on target genes was evaluated in human and mouse TAD samples.

Results: Sgk1F/F;TaglnCre or pharmacological blockade of Sgk1 inhibited the formation and rupture of β-aminopropionitrile monofumarate-induced TADs in mice and reduced the degradation of the ECM (extracellular matrix) in vessels. Mechanistically, SGK1 promoted the ubiquitination and degradation of SIRT6 by phosphorylating SIRT6 at Ser338, thereby reducing the expression of the SIRT6 protein. Furthermore, SIRT6 transcriptionally inhibits the expression of MMP9 through epigenetic modification, forming the SGK1-SIRT6-MMP9 regulatory axis, which participates in the ECM signaling pathway. Additionally, our data showed that the lack of SGK1-mediated inhibition of ECM degradation and VSMC phenotypic transformation is partially dependent on the regulatory effect of SIRT6-MMP9.

Conclusions: These findings highlight the key role of SGK1 in the pathogenesis of TAD. A lack of SGK1 inhibits VSMC phenotypic transformation by regulating the SIRT6-MMP9 axis, providing insights into potential epigenetic strategies for TAD treatment.

Keywords: dissection, thoracic aorta; mass spectrometry; sequence analysis, RNA; sirtuins; ubiquitination.


Conflict of interest statement

None.

Figures

Figure 1.
Figure 1.
Vascular smooth muscle cell–specific Sgk1 (serum- and glucocorticoid-regulated kinase 1) ablation represses β-aminopropionitrile monofumarate (BAPN)–induced thoracic aortic dissection formation and rupture in mice. A through J, Four-week-old Sgk1F/F (Sgk1 floxed) and Sgk1F/F;TaglnCre (smooth muscle cell–specific Sgk1 knockout) mice were treated with the control or BAPN for 28 days (n=7 for each control group, n=16 for each BAPN group). A, Body weights of the indicated groups (n=7 for each control group, n=13–16 for each BAPN group). B, Incidence of aortic complications. C, Representative macrographs of the aorta. D, Representative microscopy images of the thoracic aorta. Scale bar=1 mm. E, Representative ultrasound images of the thoracic aorta. Scale bar=1 mm. F, Measurements of the maximum aortic diameter (n=7 for each control group, n=13–15 for each BAPN group). G, Representative ultrasound images of the abdominal aorta. Scale bar=1 mm. H, Measurements of the maximum abdominal aortic diameter (n=7 for each control group, n=13–15 for each BAPN group). I, Mean blood pressure (BP; n=7 for each control group, n=13–15 for each BAPN group). J, Pulse pressure (PP; n=7 for each control group, n=13–15 for each BAPN group). K, Representative hematoxylin and eosin (HE), elastic van Gieson (EVG) and Masson staining images of the thoracic aorta. Scale bar=500 µm. Scale bar=100 µm. Data were presented as mean±SD. Statistical analyses were performed via 2-way ANOVA followed by the Tukey post hoc test.
Figure 2.
Figure 2.
Inhibition of Sgk1 (serum- and glucocorticoid-regulated kinase 1) with specific inhibitor alleviates thoracic aortic dissection (TAD) progression in mice. A through H, Four-week-old C57BL/6 mice were observed with or without GSK 650394 (20 mg/kg per day) within the control or β-aminopropionitrile monofumarate (BAPN) treatment for 28 days (n=5 for each control group, n=10 for each BAPN group). A, Body weights of the indicated groups (n=5 for each control group, n=8–10 for each BAPN group). B, Incidence of aortic complications. C, Representative macrographs of the aorta. D, Representative microscopy images of the thoracic aorta. Scale bar=1 mm. E, Representative ultrasound images of the thoracic aorta. Scale bar=1 mm. F, Measurements of the maximum aortic diameter (n=5 for each control group, n=8–9 for each BAPN group). G, Representative ultrasound images of the abdominal aorta. Scale bar=1 mm. H, Measurements of the maximum abdominal aortic diameter (n=7 for each control group, n=8–9 for each BAPN group). I, Representative hematoxylin and eosin (HE), elastic van Gieson (EVG), and Masson staining images of the thoracic aorta. Scale bar=500 µm. Scale bar=100 µm. Data were presented as the mean±SD. Statistical analyses were performed via 2-way ANOVA followed by the Tukey post hoc test.
Figure 3.
Figure 3.
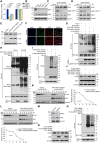
SGK1 (serum- and glucocorticoid-regulated kinase 1) regulates contractile-to-synthetic phenotypic transformation of mVSMCs and interacts with SIRT6 (sirtuin 6). A through G, Control or Sgk1 small interfering RNA (siRNA)–transfected vascular smooth muscle cells (VSMCs) after 48 hours. A, Real-time quantitative polymerase chain reaction (RT-qPCR) data showing the relative mRNA expression levels of the indicated genes in Sgk1 knockdown mVSMCs. The mRNA levels were normalized to those of Gapdh. B, Western blot analysis of the indicated proteins in Sgk1 knockdown mVSMCs. β-Actin served as a loading control for Western blotting. C and D, Representative immunofluorescence staining for the contractile markers Tagln (C) and α-Sma (D) in Sgk1 knockdown mVSMCs. nDNA was stained with DAPI (4′,6-diamidino-2-phenylindole). Scale bar=50 µm. E, Sgk1 knockdown mVSMCs were incubated with 5-ethynyl-2′-deoxyuridine (EdU) for 3 hours. A fluorescence microscope was used to detect EdU (left), and the results were statistically analyzed (right). nDNA was stained with DAPI. Scale bar=100 µm. F, Representative images of SA-β-gal (senescence-associated β-galactosidase)–stained Sgk1 knockdown mVSMCs (left) and statistical analysis (right). The green regions are positively stained. Scale bar=200 µm. G, Western blot analysis of senescence markers in Sgk1 knockdown mVSMCs. β-Actin served as a loading control for Western blotting. H, Immunoaffinity purification and mass spectrometry analysis of SGK1-interacting proteins. Whole-cell extracts from HEK-293T cells stably expressing FLAG (vector) or FLAG-SGK1 were immunopurified using anti-FLAG affinity columns and eluted with the FLAG peptide. The eluates were resolved using SDS-PAGE and silver stained. Protein bands were retrieved and analyzed using mass spectrometry. I, Mass spectrometry analysis of SGK1-interacting proteins. J, Western blot analysis of the purified fractions using antibodies against SIRT6. K, Coimmunoprecipitation (Co-IP) assay of endogenous SGK1 and SIRT6 in HEK-293T, MOVAS, and mVSMC cells. L, Immunoprecipitation (IP) assay in HEK-293T cells ectopically expressing the indicated proteins. M, Normally cultured VSMCs were fixed and analyzed by immunofluorescence using antibodies specific for SGK1 and SIRT6. nDNA was stained with DAPI. Scale bar=100 µm. N, Glutathione S-transferase (GST) pull-down assays with bacterially expressed GST-fused proteins and in vitro transcribed/translated proteins. O, Domain architectures of SIRT6. P, Identification of the essential domains required for interaction. Q, In vitro kinase assay using recombinant human active SGK1 and GST-fused SIRT6 as substrates. R, IP analysis of the serine phosphorylation of SIRT6 in the total lysates of vector- and SGK1-S422D–transfected HEK-293T cells. S, Sequence alignment of the SGK1 phosphorylation motif of SIRT6 from various species. T, IP analysis of HEK-293T cells revealed that SGK1 phosphorylates serine in wild-type (WT) SIRT6 but not in SIRT6-S338A. Data were presented as the mean±SD of 3 independent experiments. Statistical analyses were performed via 2-tailed unpaired t test. α-Sma indicates alpha smooth muscle actin; FLAG, a peptide tag consisting of eight amino acids (DYKDDDDK); MOVAS, mouse aortic vascular smooth muscle cell line; and mVSMC, primary mouse smooth muscle cells.
Figure 4.
Figure 4.
SGK1 (serum- and glucocorticoid-regulated kinase 1) modulates SIRT6 (sirtuin 6) protein ubiquitination and degradation. A, Real-time quantitative polymerase chain reaction (RT-qPCR) data showing the relative mRNA expression levels of Sgk1 and Sirt6 in control oligonucleotide- or siSgk1-transfected mVSMCs. The mRNA levels were normalized to those of Gapdh. B, Western blot analysis of Sgk1 and Sirt6 in control and siSgk1-infected mVSMCs. β-Actin served as a loading control for Western blotting. C and D, Western blot analysis of Sirt6, pSgk1-Ser422, and Sgk1 in mVSMCs treated with EMD 638683 (50 µmol/L for 0, 1, or 2 hours; C) or GSK 650394 (20 µmol/L for 0, 1, or 2 hours; D), which act as Sgk1 inhibitors. β-Actin served as a loading control for Western blotting. E, Overexpression of active SGK1-S422D decreased SIRT6 protein levels compared with overexpression of inactive SGK1-S422A in HEK-293T cells. β-Actin served as a loading control for Western blotting. F, Representative fluorescence images of Sgk1 and Sirt6 in control- or siSgk1-transfected mVSMCs. nDNA was stained with DAPI (4′,6-diamidino-2-phenylindole). Scale bar=50 µm. G, Overexpression of active SGK1-S422D increased SIRT6 ubiquitination, as determined by Western blotting for HA-Ub (hemagglutinin [HA]-tagged ubiquitin). HEK-293T cells were cotransfected with wild-type (WT) SGK1 (GFP-SGK1), inactive SGK1 (GFP-SGK1-S422A), or active SGK1 (GFP-SGK1-S422D) in combination with FLAG-SIRT6 and HA-ubiquitin (Ub) for 48 hours. Whole-cell extracts from HEK-293T cells stably expressing FLAG-SIRT6 were immunopurified using anti-FLAG affinity columns and eluted with the FLAG peptide. H, Overexpression of active SGK1-S422D increased SIRT6 ubiquitination, as determined by Western blotting for HA-Ub in HEK-293T cells transfected with the indicated plasmids in the presence of MG132 (10 μmol/L for 7 hours). I, Ubiquitination of SIRT6 and SIRT6-S338A with overexpression of active SGK1-S422D by Western blot in HEK-293T cells. J, Overexpression of active SGK1-S422D decreases WT SIRT6 but not SIRT6-S338A protein levels compared with inactive SGK1-S422A overexpression. β-Actin served as a loading control for Western blotting. K, Western blotting in lysates from HEK-293T cells transfected with FLAG-tagged SIRT6 and either vector or GFP-SGK1-S422D in the presence of cycloheximide (CHX) for up to 15 hours. GAPDH served as a loading control for Western blotting. L, Western blotting in lysates from HEK-293T cells transfected with FLAG-tagged SIRT6-S338A and either vector or GFP-SGK1-S422D in the presence of CHX for up to 15 hours. GAPDH served as a loading control for Western blotting. M, Western blot analysis of Sirt6 in control and siMdm2-infected mVSMCs. β-Actin served as a loading control for Western blotting. N, Ubiquitination of SIRT6 and SIRT6-S338A with overexpression of MDM2 by Western blot in HEK-293T cells. O, Overexpression of MDM2 decreases WT SIRT6 but not SIRT6-S338A protein levels. β-Actin served as a loading control for Western blotting. Data were presented as the mean±SD of 3 independent experiments. A, Data were statistically analyzed by 1-way ANOVA followed by Tukey post hoc test. K and L, Data were statistically analyzed by 2-way ANOVA followed by the Tukey post hoc test. FLAG indicates a peptide tag consisting of eight amino acids (DYKDDDDK); MDM2, mouse double minute 2 homolog; mVSMC, primary mouse smooth muscle cells; and siMdm2, small interfering RNA targeting Mdm2.
Figure 5.
Figure 5.
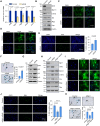
SGK1 (serum- and glucocorticoid-regulated kinase 1) and SIRT6 (sirtuin 6) regulate proliferation, senescence, and contractile-to-synthetic phenotypic transformation in mVSMCs. A through G, Control or Sirt6 small interfering RNA (siRNA)–transfected vascular smooth muscle cells (VSMCs) after 48 hours. A, Real-time quantitative polymerase chain reaction (RT-qPCR) data showing the relative mRNA expression levels of the indicated genes in Sirt6 knockdown mVSMCs. The mRNA levels were normalized to those of Gapdh. B, Western blot analysis of the indicated proteins in Sirt6 knockdown mVSMCs. β-Actin served as a loading control for Western blotting. C and D, Representative immunofluorescence staining for the contractile markers α-Sma (C) and Tagln (D) in Sirt6 knockdown mVSMCs. Scale bar=50 µm. E, Sirt6 knockdown mVSMCs were incubated with 5-ethynyl-2′-deoxyuridine (EdU) for 3 hours. A fluorescence microscope was used to detect EdU (left), and the results were statistically analyzed (right). Scale bar=100 µm. F, Representative images of SA-β-gal (senescence-associated β-galactosidase)–stained Sirt6 knockdown mVSMCs (left) and statistical analysis (right). The green regions are positively stained. Scale bar=200 µm. G, Western blot analysis of senescence markers in Sirt6 knockdown mVSMCs. β-Actin served as a loading control for Western blotting. H, Western blot analysis of the indicated proteins in mVSMCs that knock down Sgk1 or co-knock down Sgk1 and Sirt6. β-Actin served as a loading control for Western blotting. I, Representative immunofluorescence staining for the contractile marker Tagln in mVSMCs that knock down Sgk1 or co-knock down Sgk1 and Sirt6. Scale bar=25 µm. J, mVSMCs that knock down Sgk1 or co-knock down Sgk1 and Sirt6 were incubated with EdU for 3 hours. A fluorescence microscope was used to detect EdU (left), and the results were statistically analyzed (right). Scale bar=100 µm. K, Representative images of SA-β-gal stained in mVSMCs that knock down Sgk1 or co-knock down Sgk1 and Sirt6 and statistical analysis. The green regions are positively stained. Scale bar=200 µm. Data were presented as mean±SD of 3 independent experiments. A, E, and F, Statistical analyses were performed via 2-tailed unpaired t tests. J and K, Data were statistically analyzed by 1-way ANOVA followed by Tukey post hoc test. α-Sma indicates alpha smooth muscle actin; and mVSMC, primary mouse smooth muscle cells.
Figure 6.
Figure 6.
Whole-transcriptome identification of SIRT6 (sirtuin 6) targets. A, Heatmap of differentially expressed genes (fold change, ≥1.5; Q<0.05) in RNA-seq data from control (control-1, control-2, and control-3) and siSirt6 (siSirt6-1, siSirt6-2, and siSirt6-3) vascular smooth muscle cells (VSMCs). Blue, downregulated genes; red, upregulated genes. B, A bubble chart of the 10 enriched Kyoto Encyclopedia of Genes and Genomes (KEGG) pathways associated with the target genes of Sirt6. Representative genes of each pathway are also shown. The Rich factor represents the ratio of the number of target genes to the total number of genes annotated in a pathway. The Q value represents the corrected P value. C and D, Verification of the RNA-seq results via real-time quantitative polymerase chain reaction (RT-qPCR) analysis of downregulated genes (C) and upregulated genes (D). E, Gene set enrichment analysis (GSEA) of RNA-seq data. F and G, Heatmap of differentially expressed genes in the ECM (extracellular matrix) signaling pathway (F) and the MMP (matrix metalloproteinase) family (G). H and I, RT-qPCR data showing the relative mRNA expression levels of target genes in the ECM signaling pathway (H) and MMP family (I) in control or siSirt6-transfected mVSMCs. J, RT-qPCR data showing the relative mRNA expression levels of target genes of MMPs in control or siSgk1-transfected mVSMCs. C, D, and H through J, mRNA levels were normalized to those of Gapdh. Data were presented as the mean±SD of 3 independent experiments. Statistical analyses were performed via 2-tailed unpaired t tests. mVSMC indicates primary mouse smooth muscle cells; siSgk1, small interfering RNA targeting Sgk1; and siSirt6, small interfering RNA targeting Sirt6.
Figure 7.
Figure 7.
The Sgk1 (serum- and glucocorticoid-regulated kinase 1)-Sirt6 (sirtuin 6)-Mmp9 (matrix metalloproteinase 9) axis regulates the phenotypic transformation of mVSMCs. A, Quantitative chromatin immunoprecipitation (qChIP) analysis of indicated genes using antibodies against SIRT6 in mVSMCs. The results are presented as the fold change relative to IgG, with Gapdh serving as a negative control. B, qChIP analysis of MMPs (matrix metalloproteinases) using antibodies against SIRT6 in mVSMCs. The results are presented as the fold change relative to that of IgG, with Gapdh serving as a negative control. C through F, qChIP analysis of the recruitment of Sirt6 (C), H3K27ac (D), H3K9ac (E), and H3K18ac (F) to Mmp9 promoters in mVSMCs after transfection with control or siSirt6. The results are presented as a percentage of the input, with Gapdh serving as a negative control. G and H, qChIP analysis of the recruitment of Sirt6 (G) and H3K27ac (H) to Mmp9 promoters in mVSMCs after transfection with control or siSgk1. The results are presented as a percentage of the input, with Gapdh serving as a negative control. I, Western blot analysis of the indicated proteins in Sgk1- or Sirt6-knockdown mVSMCs. β-Actin served as a loading control for Western blotting. J, Transwell migration assays of mVSMCs following transfection with the corresponding small interfering RNA (siRNA). Migrated cells were stained and counted. The images in each group are representative of 1 field of view under the microscope. Scale bar=500 µm. K, Representative immunofluorescence staining for the contractile marker α-Sma in mVSMCs following transfection with the corresponding siRNA. Scale bar=25 µm. Data were presented as mean±SD of 3 independent experiments. A through H, Statistical analyses were performed via 2-tailed unpaired t tests. J, Data were statistically analyzed by 2-way ANOVA followed by the Tukey post hoc test. α-Sma indicates alpha smooth muscle actin; H3K9ac, acetylation of histone 3 lysine 9; H3K18ac, acetylation of histone 3 lysine 18; H3K27ac, acetylation of histone 3 lysine 27; Mvsmc, primary mouse smooth muscle cells; siSgk1, small interfering RNA targeting Sgk1; and siSirt6, small interfering RNA targeting Sirt6.
Figure 8.
Figure 8.
SGK1 (serum- and glucocorticoid-regulated kinase 1) regulates SIRT6 (sirtuin 6)-MMP9 (matrix metalloproteinase 9) in patients and mice with thoracic aortic dissection. A, Representative images of hematoxylin and eosin (HE) and elastic van Gieson (EVG) staining of human thoracic aortic dissection (TAD) and control samples. Scale bar=100 µm. B, Representative images of immunohistochemical staining of SGK1, SIRT6, MMP9, and MMP2 (matrix metalloproteinase 2) in human TAD and control samples. Scale bar=100 µm. C, Western blots of SGK1, SIRT6, MMP9, and MMP2 in human TAD and control samples. β-Actin served as a loading control for Western blotting. D, Real-time quantitative polymerase chain reaction (RT-qPCR) data showing the relative mRNA expression levels of Sgk1, Sirt6, and Mmp9 in the aortas of Sgk1F/F (Sgk1 floxed) and Sgk1F/F;TaglnCre (smooth muscle cell–specific Sgk1 knockout) mice treated with control or β-aminopropionitrile monofumarate (BAPN). The mRNA levels were normalized to those of Gapdh. E, Western blots of Sgk1, Sirt6, Mmp9, Mmp2, and α-Sma in the aortas of Sgk1F/F and Sgk1F/F;TaglnCre mice treated with control or BAPN. Gapdh served as a loading control for Western blotting. F, Schematic diagram of the proposed role of SGK and SIRT6 in TAD. The proposed regulatory mechanisms of the SGK1-SIRT6-MMP9 axis in controlling vascular smooth muscle cell (VSMC) phenotypic transformation and ECM (extracellular matrix) degradation in TAD. Data were presented as mean±SD of 3 independent experiments. Statistical analyses were performed via 2-way ANOVA followed by the Tukey post hoc test. α-Sma indicates alpha smooth muscle actin.

References

    1. Kim HW, Stansfield BK. Genetic and epigenetic regulation of aortic aneurysms. Biomed Res Int. 2017;2017:7268521. doi: 10.1155/2017/7268521 - PMC - PubMed
    1. Bossone E, Eagle KA. Epidemiology and management of aortic disease: aortic aneurysms and acute aortic syndromes. Nat Rev Cardiol. 2021;18:331–348. doi: 10.1038/s41569-020-00472-6 - PubMed
    1. Thompson RW. Detection and management of small aortic aneurysms. N Engl J Med. 2002;346:1484–1486. doi: 10.1056/NEJM200205093461910 - PubMed
    1. El-Hamamsy I, Yacoub MH. Cellular and molecular mechanisms of thoracic aortic aneurysms. Nat Rev Cardiol. 2009;6:771–786. doi: 10.1038/nrcardio.2009.191 - PubMed
    1. Jauhiainen S, Kiema M, Hedman M, Laakkonen JP. Large vessel cell heterogeneity and plasticity: focus in aortic aneurysms. Arterioscler Thromb Vasc Biol. 2022;42:811–818. doi: 10.1161/ATVBAHA.121.316237 - PubMed

MeSH terms

Substances