. 2024 Nov 20:12:1495586.
doi: 10.3389/fcell.2024.1495586. eCollection 2024.

Forced MyD88 signaling in microglia impacts the production and survival of regenerated retinal neurons

Affiliations

Forced MyD88 signaling in microglia impacts the production and survival of regenerated retinal neurons

Jordan E Rumford et al. Front Cell Dev Biol. .

Abstract

Inflammation and microglia appear to be key factors influencing the outcome of retinal regeneration following acute retinal damage. Despite such findings, direct connection of microglia-specific inflammatory factors as drivers of regenerative responses in the retina are still not defined, and intracellular pathways activated to stimulate such signals from microglia are currently unknown. We became interested in MyD88 regulation in microglia because transcriptomic datasets suggest myd88 could be regulated temporally in zebrafish microglia responding to damage in the central nervous system. MyD88 is an intracellular molecular adaptor that initiates signaling cascades downstream of several innate immune receptors, and probably most well-known for inducing gene expression of pro-inflammatory factors. Using zebrafish, which spontaneously regenerate retinal neurons after acute retinal damage, we studied the effects of overactivation of MyD88 signaling in microglia and macrophages on the Müller glia-mediated regenerative response. Our results indicate that increased MyD88 signaling in microglia/macrophages impacts the initial response of Müller glia entering a regenerative response after acute, neurotoxin-induced retinal damage to inner retinal neurons. In addition, increased MyD88 signaling in microglia/macrophages resulted in reduced survival of inner retinal neurons in regenerated retinas. This work supports the idea that temporal control of inflammatory signaling is a key component in the production of MG-derived progenitors yet further indicates that such control is important for differentiation and survival of regenerated neurons.

Keywords: MyD88; Müller glia; NFkB; inflammation; microglia; regeneration; retina; zebrafish.


Conflict of interest statement

The authors declare that the research was conducted in the absence of any commercial or financial relationships that could be construed as a potential conflict of interest.

Figures

FIGURE 1
FIGURE 1
RNA-seq indicates downregulation of myd88 in mpeg1+ cells during retinal regeneration and upon CNS damage. Normalized transcript counts (fragments per kilobase million, fpkm) of myd88 (A), nfkbiaa (B), nfkbiab (C) in mpeg1:GFP+ cells isolated from undamaged zebrafish brain [homeostatic (Oosterhof et al., 2017)] or regenerating zebrafish retinas [Regen (7DPI) (Mitchell et al., 2019)]. Normalized transcript counts (fragments per kilobase million, fpkm) of myd88 (D), nfkbiaa (E), nfkbiab (F) in mpeg1:GFP+ cells isolated from undamaged (UD) or acutely damaged zebrafish brain at 1 or 2 days post injury (1DPI, 2DPI) using transcriptome data from (Oosterhof et al., 2017). Fish used in the retina sequencing study were 10–12 months old (Mitchell et al., 2019); fish used in the brain study were 3 months old (Oosterhof et al., 2017).
FIGURE 2
FIGURE 2
Creation of transgenic zebrafish with forced myd88 expression in microglia/macrophages. Tol2 transgenesis followed by several generations of outcrossing was used to generate a zebrafish line in which the mpeg1 promoter drives expression of myd88 cDNA followed by a 2A-mCherry sequence. (A, A’) mCherry fluorescence in 4C4+ microglia visualized from mpeg1:myd88-2A-mCherry zebrafish eyes/retinas at 3 days post fertilization (dpf). Through the remainder of the manuscript, we refer to this line as mpeg1:myd88 for simplicity. (B) Fold change of myd88 transcripts measured by RT-qPCR in whole retinas from non-transgenic (non-Tg) and mpeg1:myd88 adult fish. Each dot represents result of one single adult retina. Differences were not statistically significant (p = 0.08). (C, D) Microglia stained and visualized with the 4C4 antibody using whole, flat mounted adult zebrafish retinas. Nuclei stained with DAPI. (C’, D’) Retinal cryosections (adult) stained and visualized with 4C4 antibody and DAPI. ONL = outer nuclear layer, INL = inner nuclear layer, GCL = ganglion cell layer.
FIGURE 3
FIGURE 3
Prolonged inflammatory signaling in retinas with forced myd88 signaling in microglia/macrophages. RT-qPCR was used to measure transcripts for (A) myd88, (B) irg1, and (C) gfp after intravitreal injection of ouabain. (A, B) Fold change of each transcript in ouabain injected samples relative to saline injected samples. (C) Fold change of gfp in retinas also carrying the Nfkb::gfp transcriptional reporter. (A–C) p-values shown below the graphs indicate statistically significant differences between the indicated groups (Kruskal–Wallis, followed by Conover’s posthoc). (D, E) Visualization of GFP in Nfkb::gfp reporter line at 4 days post-ouabain injection (4DPI). (D) Enlarged panels show GFP signal detected in a subset of responding L-plastin+ cells within the damaged inner retina (arrowheads). (E) GFP expression also detective in vascular (v) structures. (F, G) Visualization of GFP in mpeg1:myd88 transgenics also carrying Nfkb::gfp reporter. (F) Enlarged panels show strong GFP expression visible in a subset of responding L-plastin+ cells within the damaged inner retina (arrowheads). (G) GFP expression also seen in regions of the inner nuclear layer that is consistent with Müller glia and Müller glia-derived progenitors at 4DPI. ONL = outer nuclear layer; the vertical dotted line indicates inner retinal region damaged by ouabain.
FIGURE 4
FIGURE 4
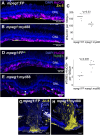
Leukocyte responses and cell death levels in acutely damaged and regenerating retinas. (A, B) TUNEL staining of retinal cryosections from mpeg1:FP or mpeg1:myd88 fish at 2 days post ouabain injection (2DPI, acute damage). (C) TUNEL counts in retinal cryosections from mpeg1:FP or mpeg1:myd88 fish at 2DPI. (D, E) TUNEL staining of retinal cryosections from mpeg1:FP or mpeg1:myd88 fish at 6DPI. (F) TUNEL counts in retinal cryosections from mpeg1:FP or mpeg1:myd88 fish at 6DPI. No statistically significant differences were found between mpeg1:FP and mpeg1:myd88 groups (Welch’s test). (G, H) Retinal cryosections at 2DPI stained and imaged for L-plastin and DAPI. (I) Quantification of L-plastin+ cells at 2DPI. (J, K) Retinal cryosections at 6DPI stained and imaged for L-plastin and DAPI. (L) Quantification of L-plastin+ cells at 6DPI. No statistically significant differences were found between mpeg1:FP and mpeg1:myd88 groups (Welch’s test). ONL = outer nuclear layer; the vertical dotted line indicates inner retinal region damaged by ouabain.
FIGURE 5
FIGURE 5
Analysis of Müller glia reactivity and induction of stem-like genes in damaged retinas. (A) RT-qPCR was used to examine upregulation of gfap in mpeg1:FP and mpeg1:myd88 retinas at 4-, 5-, or 6-days post ouabain injection (4-6DPI), fold change was determined relative to saline injected samples. Statistically significant differences between groups are shown by the p-values reported at the bottom of the plot. B-E. Retinal cryosections stained for GFAP and DAPI at 4DPI (B, C) or 6DPI (D, E). ONL = outer nuclear layer; the vertical dotted line indicates inner retinal region damaged by ouabain. (F, G) RT-qPCR was used to examine upregulation of ascl1a (F) and lin28a (G) in mpeg1:FP and mpeg1:myd88 retinas; fold change was determined relative to saline injected samples. Statistically significant differences between groups are shown by the p-values reported at the bottom of the plot (Kruskal–Wallis, followed by Conover’s posthoc).
FIGURE 6
FIGURE 6
Analysis of proliferative response in damaged retinas. (A) RT-qPCR was used to examine upregulation of pcna transcript in mpeg1:FP and mpeg1:myd88 retinas at 4-, 5-, or 6-days post ouabain injection (4-6DPI); fold change was determined relative to saline injected samples. Statistically significant differences between groups are shown by the p-values reported at the bottom of the plot (Kruskal–Wallis, followed by Conover’s posthoc). (B, C’’’) Retinal cryosections were stained for PCNA, Glutamine Synthetase (GS), L-plastin, and DAPI. Selected overlays for mpeg1:FP and mpeg1:myd88 samples are shown in (B-B’’’) and (C-C’’’). ONL = outer nuclear layer; the vertical dotted line indicates inner retinal region damaged by ouabain. (D) Quantification of total PCNA+ cells in retinal cryosections; PCNA+ DAPI+ nuclei were counted for this analysis. (E) Quantification of PCNA+ L-plastin+ cells in retinal cryosections; L-plastin+ cells with PCNA+ DAPI+ nuclei were counted for this analysis. Statistically significant difference is indicated by the shown p-value (Welch’s test).
FIGURE 7
FIGURE 7
Analysis of transcripts associated with ganglion cell neurogenesis. A-C. RT-qPCR was used to examine expression of genes atoh7 (A), brn3b (B), and fgf8a (C), which are associated with ganglion cell neurogenesis, in mpeg1:FP and mpeg1:myd88 retinas at 4-, 5-, or 6-days post ouabain injection (4-6DPI). Fold change was determined relative to saline injected samples. Statistically significant differences between groups are shown by the p-values reported at the bottom of the plot (Kruskal–Wallis, followed by Conover’s posthoc). Differences in fgf8a were not statistically significant for any comparisons.
FIGURE 8
FIGURE 8
Analysis of regeneration of inner retinal neurons. (A, B) Retinal cryosections at 10 days post ouabain injection (10DPI) stained for HuC/D, Zn-5, and DAPI. ONL = outer nuclear layer; the vertical dotted line indicates inner retinal region damaged by ouabain. (C) Quantification of HuC/D+ neurons at 10DPI. Statistically significant difference between groups is indicated by the p-value shown at the top of the plot (Welch’s test). (D, E) Retinal cryosections at 10 days post ouabain injection (10DPI) stained for HuC/D, TUNEL, and DAPI. Arrowheads: TUNEL+ HuC/D+ cells. (F) Quantification of HuC/D+ neurons that are TUNEL+. Statistically significant differences between groups are indicated by the p-value shown at the top of the plot (Welch’s test). (G, H) Regions of regenerated optic nerve head in retinal cryosections after staining with Zn-5 antibody.

Similar articles

Cited by

References

    1. Bernardos R. L., Barthel L. K., Meyers J. R., Raymond P. A. (2007). Late-stage neuronal progenitors in the retina are radial müller glia that function as retinal stem cells. J. Neurosci. 27 (26), 7028–7040. 10.1523/JNEUROSCI.1624-07.2007 - DOI - PMC - PubMed
    1. Bludau O., Weber A., Bosak V., Kuscha V., Dietrich K., Hans S., et al. (2024). Inflammation is a critical factor for successful regeneration of the adult zebrafish retina in response to diffuse light lesion. Front. Cell. Dev. Biol. 12, 1332347. 10.3389/fcell.2024.1332347 - DOI - PMC - PubMed
    1. Bringmann A., Iandiev I., Pannicke T., Wurm A., Hollborn M., Wiedemann P., et al. (2009). Cellular signaling and factors involved in Müller cell gliosis: neuroprotective and detrimental effects. Prog. Retin Eye Res. 28 (6), 423–451. 10.1016/j.preteyeres.2009.07.001 - DOI - PubMed
    1. Bringmann A., Pannicke T., Grosche J., Francke M., Wiedemann P., Skatchkov S. N., et al. (2006). Müller cells in the healthy and diseased retina. Prog. Retin Eye Res. 25 (4), 397–424. 10.1016/j.preteyeres.2006.05.003 - DOI - PubMed
    1. Brown N. L., Patel S., Brzezinski J., Glaser T. (2001). Math5 is required for retinal ganglion cell and optic nerve formation. Development 128 (13), 2497–2508. 10.1242/dev.128.13.2497 - DOI - PMC - PubMed

LinkOut - more resources