. 2024 Nov 19;128(47):20275-20286.
doi: 10.1021/acs.jpcc.4c05878. eCollection 2024 Nov 28.

Label-Free Anti-Brownian Trapping of Single Nanoparticles in Solution

Affiliations

Label-Free Anti-Brownian Trapping of Single Nanoparticles in Solution

William B Carpenter et al. J Phys Chem C Nanomater Interfaces. .

Abstract

Today, biomolecular nanoparticles are prevalent as diagnostic tools and molecular delivery carriers, and it is particularly useful to examine individuals within a sample population to quantify the variations between objects and directly observe the molecular dynamics involving these objects. Using interferometric scattering as a highly sensitive label-free detection scheme, we recently developed the interferometric scattering anti-Brownian electrokinetic (ISABEL) trap to hold a single nanoparticle in solution for extended optical observation. In this perspective, we describe how we implemented this trap, how it extends the capabilities of previous ABEL traps, and how we have begun to study individual carboxysomes, a fascinating biological carbon fixation nanocompartment. By monitoring single nanocompartments for seconds to minutes in the ISABEL trap using simultaneous interferometric scattering and fluorescence spectroscopy, we have demonstrated single-compartment mass measurements, cargo-loading trends, and redox sensing inside individual particles. These experiments benefit from rich multiplexed correlative measurements utilizing both scattering and fluorescence with many exciting future capabilities within reach.


Conflict of interest statement

The authors declare no competing financial interest.

Figures
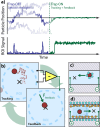
Figure 1
Figure 1
(a) Illustration of the position and signal of simulated diffusing fluorescent particles in and near the region of interest (ROI) when trapping feedback is off (left, blue) and on (right, green; only one particle is selected). (b) Principle of closed-loop feedback for ABEL trapping (top view). (c) Electrophoretic and (d) electro-osmotic feedback forces (side view) can move the particle toward the trap center. Figure adapted with permission from ref (16). Copyright 2018 Springer.
Figure 2
Figure 2
ISABEL trap overview. (a) Schematic of the ISABEL trap layout. Laser: orange. Hardware: gray. Microfluidic cell: light blue. Electrodes: red and black. Trapped particle: maroon. (b) Top view of the ISABEL 32-point illumination grid (orange), showing the knight’s tour scan pattern (arrows, gray circles), the trap center (black x), and the particle position (maroon). (c) Side view of a particle in the ISABEL microfluidic cell, showing incident (Ei) and scattered (Es) fields along with the reference field (Er). (d) Flat-fielded representation of interferometric scattering data from the ISABEL trap, showing the point of highest contrast at the location of the particle. Left: The particle is located toward +y relative to the trap center (black x), resulting in application of a restoring force (cyan F) on the electrodes. Right: On the next update loop, the applied feedback successfully returned the particle position to coincide with the trap center. (e) Raw and filtered data from a working ISABEL trap. Particles from a mixture of 20, 30, and 50 nm gold beads are observed to enter the trap one at a time when feedback is on (white background), causing a sharp step up in scattering contrast (orange). Contrast remains high during trapping and returns to the background level upon switching off the feedback (gray background). The darker orange trace has been filtered at 100 Hz; the bold brown trace denotes the values of maximum-likelihood-estimated levels for each trapping event. (f) Fractional contrast for each trapping event should correspond to particle size; an all-particles histogram of the data from panel (e) illustrates three distinct peaks. (g) Peak positions for gold nanoparticles of known diameter (blue x, blue error bars) confirm d3 scaling (solid line fit) rather than d6 scaling (dashed line fit). Panels (a–c) adapted with permission from ref (66). Copyright 2022 American Chemical Society. Panel (g) adapted with permission from ref (54). Copyright 2019 American Chemical Society.
Figure 3
Figure 3
Calibrating normalized scatter to the scattering cross section for single nanoparticles. (a) Measured scattering levels on a series of gold and polystyrene beads, normalized for reflectivity. (b) Power law fit to the 30 nm gold beads, 80 nm polystyrene beads, and 50 nm gold beads to create a calibration to the scattering cross section. (c) Measurements from (a) converted to single-particle scattering cross sections. (d) Two polystyrene bead samples from (c) not used for calibration converted to single-particle diameters. The diameters as measured by TEM are 108 ± 6 and 130 ± 2.4 nm. Figure adapted with permission from ref (60). Copyright 2022 American Chemical Society.
Figure 4
Figure 4
(a) Optical diagram of an augmented ISABEL trap that incorporates simultaneous fluorescence spectroscopy. Wide-field fluorescence excitation illumination is spatially overlapped via dichroic mirrors (DCM) with the knight’s tour scan pattern used to detect scattering particles. Emitted fluorescence is spatially filtered through a pinhole, spectrally purified, and detected on an avalanche photodiode (APD). (b) Example trapping trace from carboxysome nanoparticles (see below), highlighting simultaneous scattering and fluorescence information. Carboxysomes are observed to enter the ROI and become trapped one at a time when the feedback is on (white background), causing a sharp step up in both scattering contrast (orange) and fluorescence (green). Contrast remains high during trapping and returns to the background level upon switching off the feedback (gray background). (c) A single 100 nm polystyrene bead labeled with Alexa Fluor 647 is trapped stably for nearly 15 min, even though the fluorescence photobleaches over time. The trapped bead is replaced with a bead with larger contrast and unbleached fluorophores. Panel (b) adapted with permission from ref (60). Copyright 2022 American Chemical Society.
Figure 5
Figure 5
Measuring carboxysome masses and mass distribution. (a) Schematic of the trapped carboxysomes expressed in E. coli, with superfolder GFP targeted to the core. (b) Cryo-TEM images of the carboxysomes reveal heterogeneity of size and loading. Scale bar: 100 nm. (c) Distribution of masses inferred from carboxysome trapping data, assuming no correlation between the measured scattering and assumed diameter. Inset: histogram of mass estimates from a single carboxysome. (d) Ensemble of simulated carboxysomes with an intermediate correlation between the radius and the scattering cross section. (e) Measured distribution of fluorescence and normalized scatter for the carboxysome trapping data. The points are colored by local density of neighbors, and points above a cutoff of density (white dashed line) are fit to a power law to characterize the shape, with an exponent of 1.6. (f) Distribution of core mass vs normalized scatter calculated for the ensemble in (d), where the correlation was chosen such that the power law fit matches the exponent from (e). Figure adapted with permission from ref (60). Copyright 2022 American Chemical Society.
Figure 6
Figure 6
(a) Schematic of a carboxysome with internal roGFP2. (b) Bulk fluorescence excitation spectra from roGFP2 demonstrate changes in the fluorescence with redox conditions. Vertical arrows indicate the excitation wavelengths used in this study. (c) The bulk ratiometric fluorescence readout from roGFP2 decreases with the added reductant. Figure adapted with permission from ref (66). Copyright 2022 American Chemical Society.
Figure 7
Figure 7
(a) Example carboxysome trapping trace where scattering contrast (top), fluorescence from 488 nm excitation (middle), and fluorescence from 405 nm excitation (bottom) are collected simultaneously from each particle. For each trace, average signal levels are superimposed over trapping events. (b) Ratiometric fluorescence and scattering contrast measured for carboxysomes in highly reducing conditions (1 mM TCEP). The error bar indicates the RMS standard error on ratio measurements. (c) Ratiometric fluorescence and scattering contrast for air-oxidized carboxysomes. (d) Ratiometric fluorescence for carboxysomes loaded with sfGFP, which is insensitive to redox. The measured ratios all lie within measurement error (red bar). (e) Upon mixing air-equilibrated roGFP2-carboxysomes with a reducing buffer, the ratiometric fluorescence decreases demonstrate the minutes-long kinetics for small-molecule reductants to enter the carboxysome. Panels (a–d) adapted with permission from ref (66). Copyright 2022 American Chemical Society. With the exception of shell mutant data, panel (e) is also adapted with permission from ref (66). Copyright 2022 American Chemical Society.

Similar articles

References

    1. Zijlstra P.; Paulo P. M. R.; Orrit M. Optical detection of single non-absorbing molecules using the surface plasmon resonance of a gold nanorod. Nat. Nanotechnol. 2012, 7, 379–382. 10.1038/nnano.2012.51. - DOI - PubMed
    1. Mitchell M. J.; Billingsley M. M.; Haley R. M.; Wechsler M. E.; Peppas N. A.; Langer R. Engineering precision nanoparticles for drug delivery. Nat. Rev. Drug Discovery 2021, 20, 101–124. 10.1038/s41573-020-0090-8. - DOI - PMC - PubMed
    1. Liu L.; Corma A. Metal Catalysts for Heterogeneous Catalysis: From Single Atoms to Nanoclusters and Nanoparticles. Chem. Rev. 2018, 118, 4981–5079. 10.1021/acs.chemrev.7b00776. - DOI - PMC - PubMed
    1. Kirst H.; Ferlez B. H.; Lindner S. N.; Cotton C. A. R.; Bar-Even A.; Kerfeld C. A. Toward a glycyl radical enzyme containing synthetic bacterial microcompartment to produce pyruvate from formate and acetate. Proc. Natl. Acad. Sci. U.S.A. 2022, 119, e211687111910.1073/pnas.2116871119. - DOI - PMC - PubMed
    1. Aharonovich I.; Castelletto S.; Simpson D. A.; Su C. H.; Greentree A. D.; Prawer S. Diamond-based single-photon emitters. Rep. Prog. Phys. 2011, 74, 07650110.1088/0034-4885/74/7/076501. - DOI

LinkOut - more resources