. 2024 Nov 15:78:102928.
doi: 10.1016/j.eclinm.2024.102928. eCollection 2024 Dec.

The analytical and clinical validity of AI algorithms to score TILs in TNBC: can we use different machine learning models interchangeably?

Affiliations

The analytical and clinical validity of AI algorithms to score TILs in TNBC: can we use different machine learning models interchangeably?

Joan Martínez Vidal et al. EClinicalMedicine. .

Abstract

Background: Pathologist-read tumor-infiltrating lymphocytes (TILs) have showcased their predictive and prognostic potential for early and metastatic triple-negative breast cancer (TNBC) but it is still subject to variability. Artificial intelligence (AI) is a promising approach toward eliminating variability and objectively automating TILs assessment. However, demonstrating robust analytical and prognostic validity is the key challenge currently preventing their integration into clinical workflows.

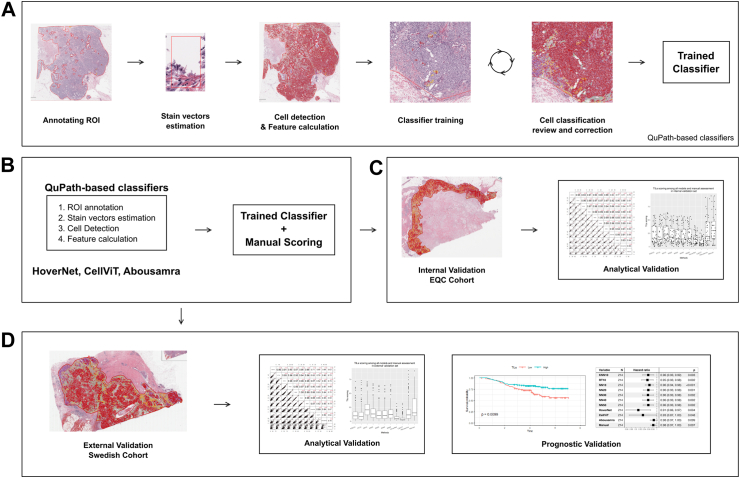
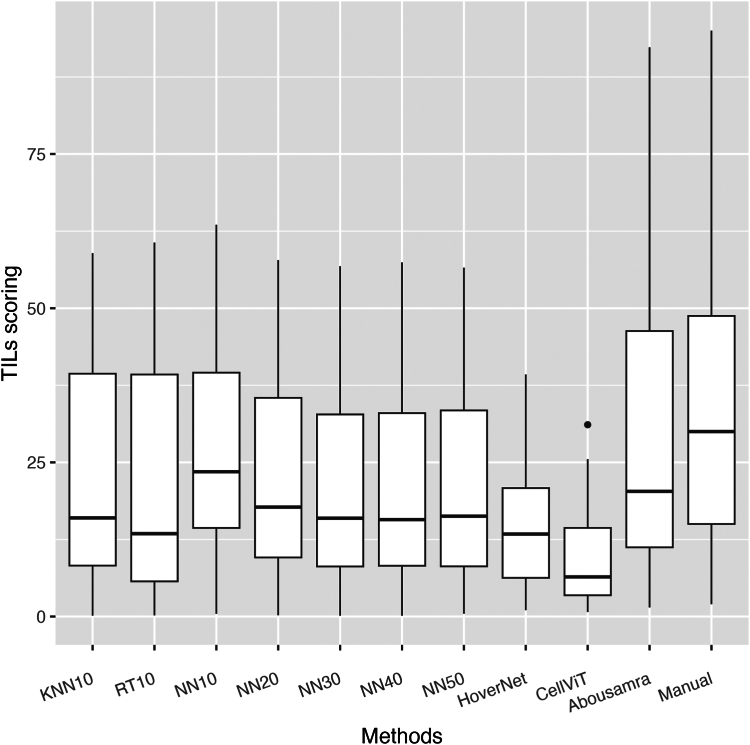
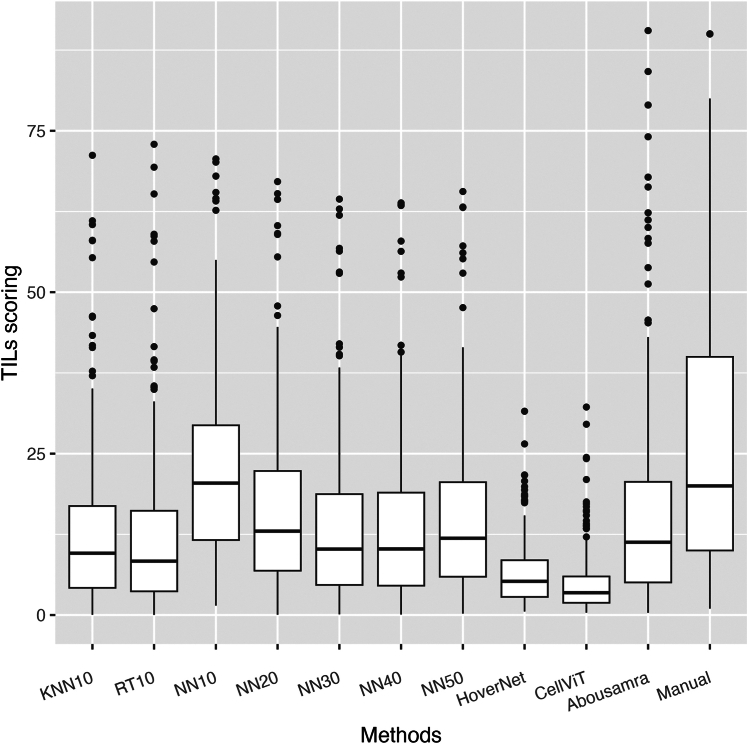
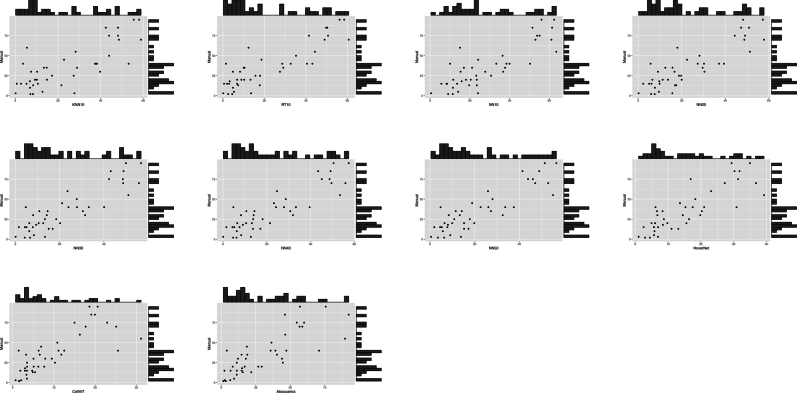
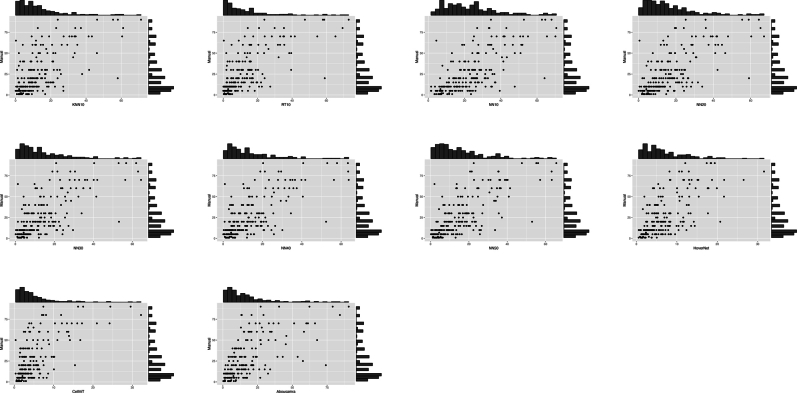
Methods: We evaluated the impact of ten AI models on TILs scoring, emphasizing their distinctions in TILs analytical and prognostic validity. Several AI-based TILs scoring models (seven developed and three previously validated AI models) were tested in a retrospective analytical cohort and in an independent prospective cohort to compare prognostic validation against invasive disease-free survival endpoint with 4 years median follow-up. The development and analytical validity set consisted of diagnostic tissue slides of 79 women with surgically resected primary invasive TNBC tumors diagnosed between 2012 and 2016 from the Yale School of Medicine. An independent set comprising of 215 TNBC patients from Sweden diagnosed between 2010 and 2015, was used for testing prognostic validity.

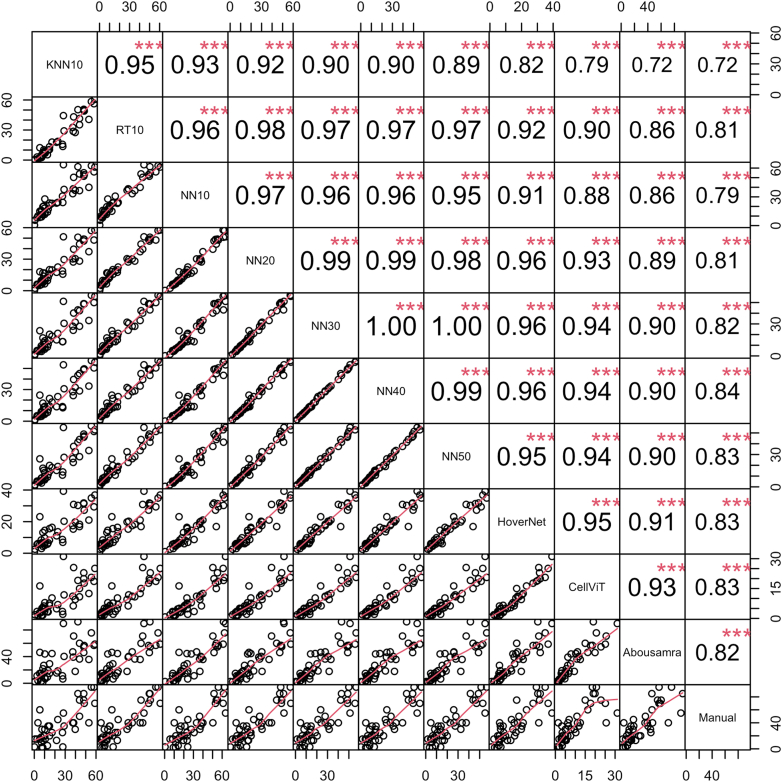
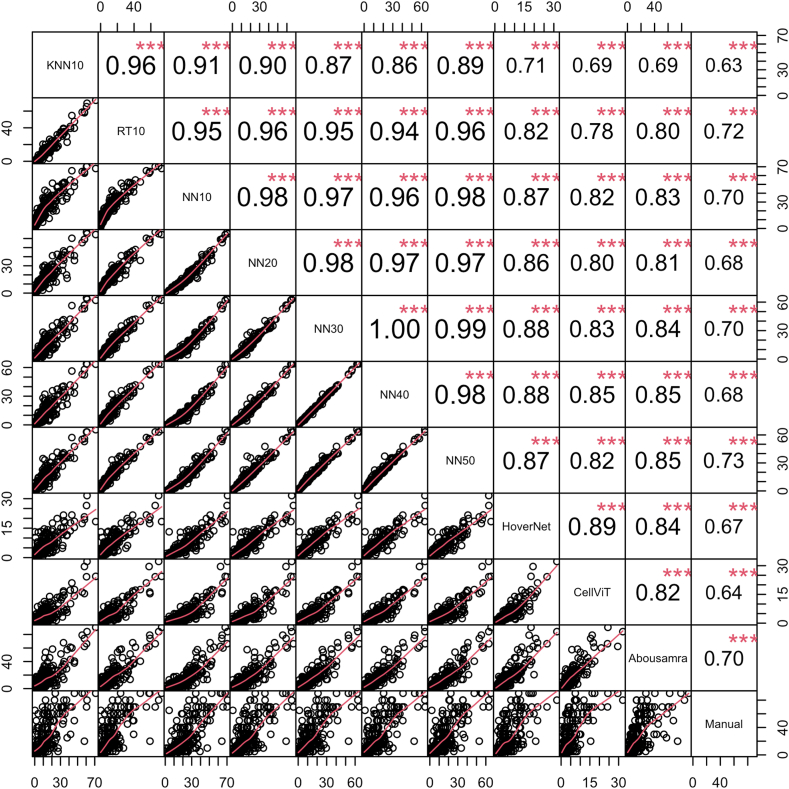
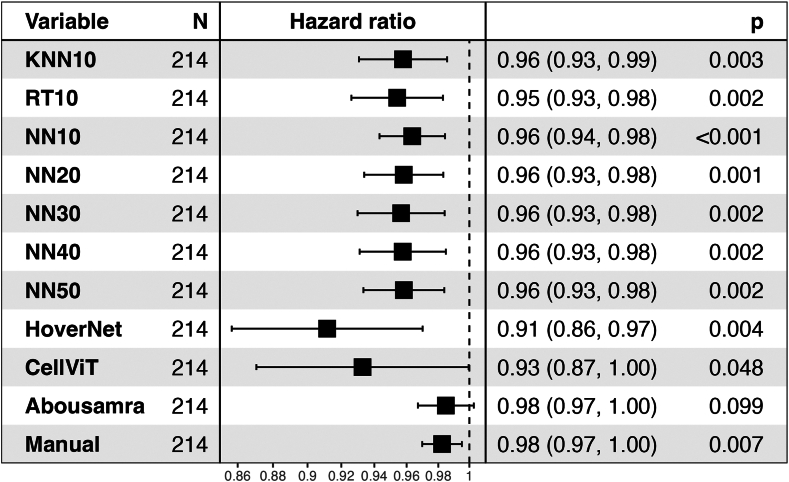
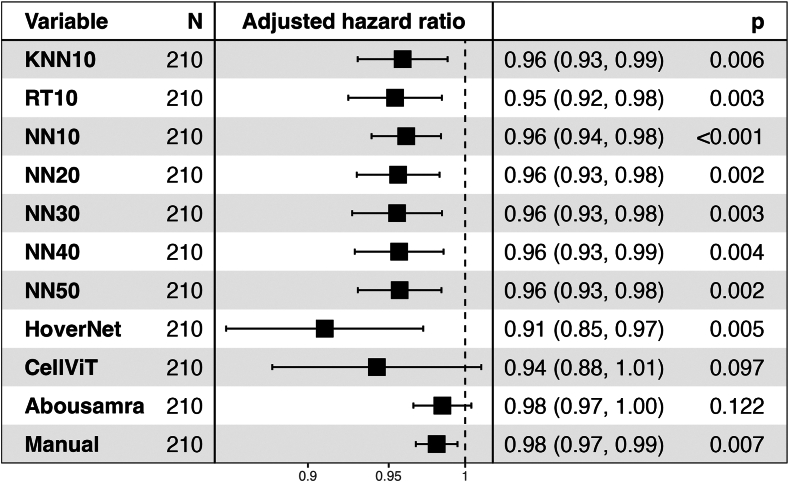
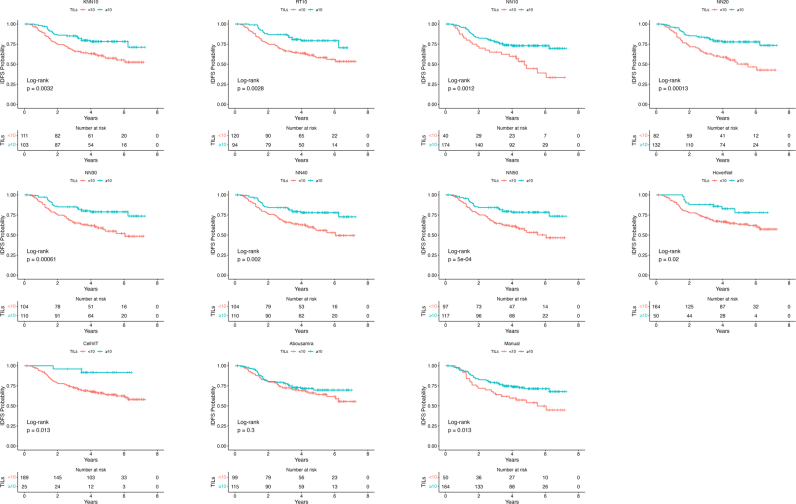
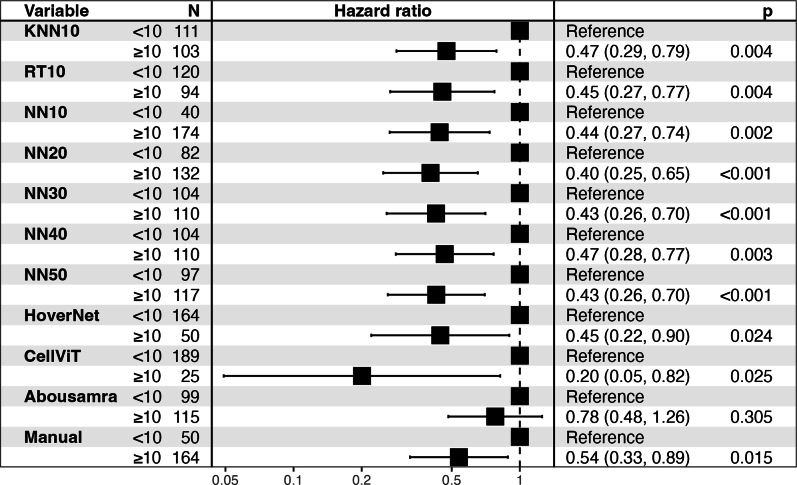
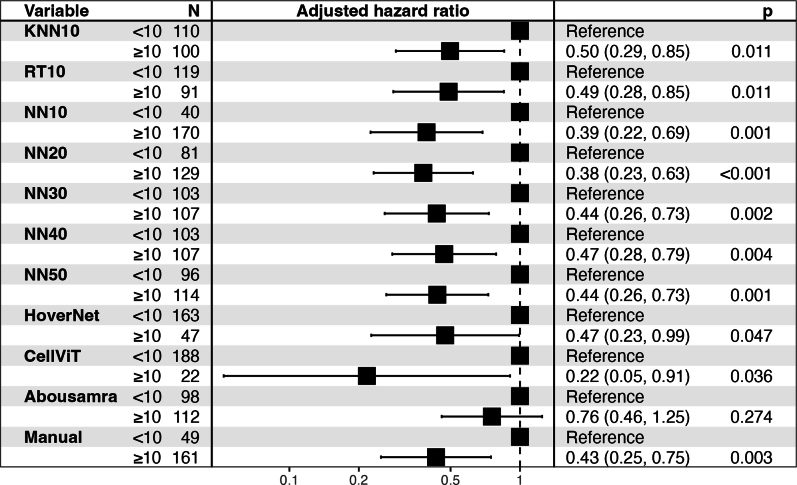
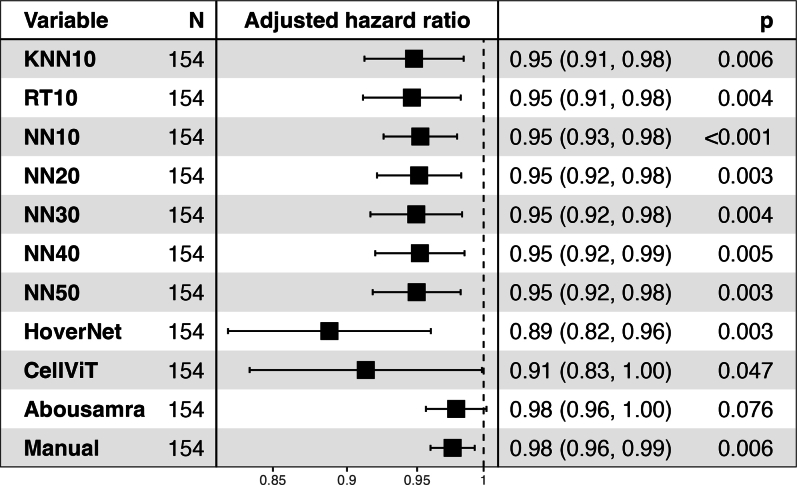
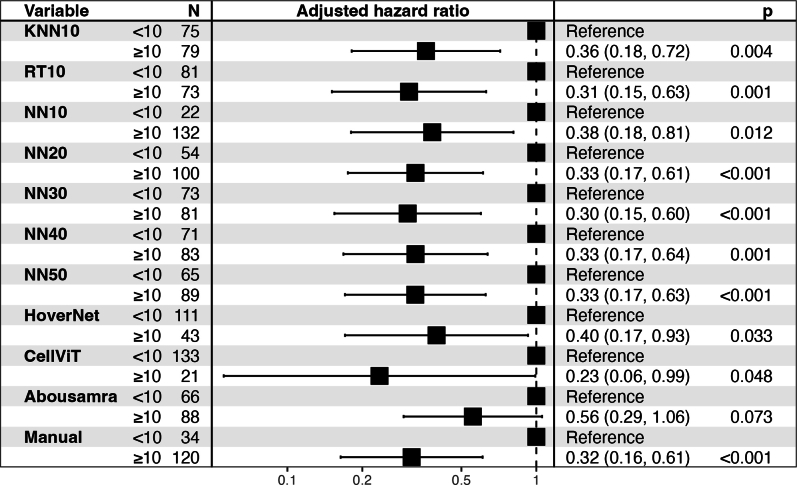
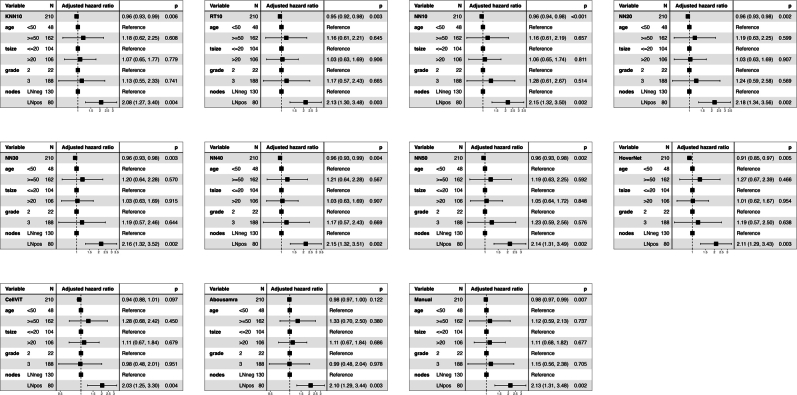
Findings: A significant difference in analytical validity (Spearman's r = 0.63-0.73, p < 0.001) is highlighted across AI methodologies and training strategies. Interestingly, the prognostic performance of digital TILs is demonstrated for eight out of ten AI models, even less extensively trained ones, with similar and overlapping hazard ratios (HR) in the external validation cohort (Cox regression analysis based on IDFS-endpoint, HR = 0.40-0.47; p < 0.004).

Interpretation: The demonstrated prognostic validity for most of the AI TIL models can be attributed to the intrinsic robustness of host anti-tumor immunity (measured by TILs) as a biomarker. However, the discrepancies between AI models should not be overlooked; rather, we believe that there is a critical need for an accessible, large, multi-centric dataset that will serve as a benchmark ensuring the comparability and reliability of different AI tools in clinical implementation.

Funding: Nikos Tsiknakis is supported by the Swedish Research Council (Grant Number 2021-03061, Theodoros Foukakis). Balazs Acs is supported by The Swedish Society for Medical Research (Svenska Sällskapet för Medicinsk Forskning) postdoctoral grant. Roberto Salgado is supported by a grant from Breast Cancer Research Foundation (BCRF).

Keywords: Artificial intelligence; Breast cancer; Deep learning; Machine learning; TILs; Tumor infiltrating lymphocytes.


Conflict of interest statement

JH has obtained speaker's honoraria or advisory board remunerations from Roche, Novartis, Pfizer, EliLilly, MSD, Gilead, Sakura and has received institutional research support from Roche, AstraZeneca, MSD and Novartis. JH is a co-founder and shareholder of Stratipath AB. AB has received honoraria from Gilead for participation in advisory board meetings and has received institutional honoraria for lectures and participation in advisory board meetings from Pfizer, Roche, Novartis and Elli Lilly. AB is a co-founder, shareholder, and CEO of SACRA Therapeutics AB. DLR has served as a Consultant/Advisor to Astra Zeneca, Cell Signaling Technology, Cepheid, Danaher, NextCure, PAIGE.AI, Regeneron, and Sanofi. Cepheid, NavigateBP, NextCure, and Leica currently fund, or have previously funded, research in his lab. RS serves on an Advisory Board and/or has a consultancy role for BMS, Roche, Owkin, Astra Zeneca, Daiichi Sankyo and Case45. RS has received research funding by Roche, Puma, Merck and BMS. RS has received travel and congress-registration support by Roche, Merck, BMS, Daiichii Sankyo and AstraZeneca. All the other authors had no potential conflicts of interest to disclose.

Figures

Fig. 1
Fig. 1
Digital image analysis flowchart for classifiers development and utilization. (a) Preprocessing and classifiers training pipeline (KNN10, RT10, NN10, NN20, NN30, NN40 and NN50). (b) Application of TILs models. (c) Analytical evaluation of the classifiers on the Yale internal validation set. (d) Prognostic evaluation in an independent validation set. Note that the “trained classifier” applied in sub-figures b-d is the one created in a, in addition to HoverNet, CellViT and Abousamra's.
Fig. 2
Fig. 2
Boxplots of all TILs scoring methods in the internal validation Yale cohort. The horizontal black line in the boxplots indicates the median, the outlined solid box represents the 25th–75th percentile, the black vertical lines represent the range of the data distribution and dots are outliers from the distribution.
Fig. 3
Fig. 3
Boxplots of all TILs scoring methods in the external SCAN-B validation cohort. The horizontal black line in the boxplots indicates the median, the outlined solid box represents the 25th–75th percentile, the black vertical lines represent the range of the data distribution and dots are outliers from the distribution.
Fig. 4
Fig. 4
Spearman's correlation coefficient matrix for all methods and manual sTILs in the internal validation set of Yale cohort. The bottom part of the diagonal shows the bivariate scatter plots with a fitted line. The upper part of the diagonal shows the correlation coefficient value and the significance level as stars. The three stars correspond to a p-value <0.001.
Fig. 5
Fig. 5
Spearman's correlation coefficient matrix for all methods and manual sTILs in the external SCAN-B validation cohort. The bottom part of the diagonal shows the bivariate scatter plots with a fitted line. The upper part of the diagonal shows the correlation coefficient value and the significance level as stars. The three stars correspond to a p-value <0.001.
Fig. 6
Fig. 6
Forest plot for the univariate Cox analysis of continuous TILs scores of all methods, using IDFS as clinical endpoint, in the SCAN-B validation cohort. The black squares regard the hazard ratio values, while the horizontal error bars indicate the confidence interval (CI). The CI is also shown in parentheses next to the hazard ratio value. The number range at the bottom of the plot regards the hazard ratio values, while the dotted vertical line pinpoints the point where HR = 1.
Fig. 7
Fig. 7
Forest plot for the multivariate Cox analysis of continuous TILs scores of all methods (adjusted for age group, tumor size group, grade and nodal status), using IDFS as clinical endpoint, in the SCAN-B validation cohort. Hazard ratios for the adjusted variables are not illustrated to conserve space. The black squares regard the hazard ratio values, while the horizontal error bars indicate the confidence interval (CI). The CI is also shown in parentheses next to the hazard ratio value. The number range at the bottom of the plot regards the hazard ratio values, while the dotted vertical line pinpoints the point where HR = 1.
Supplementary Figure S2
Kaplan Meier curves for all scoring methods dichotomized at 10% value, using IDFS as clinical endpoint, in the SCAN-B validation cohort. The red curve regards the Low-TILs subgroup (<10%), while the blue curve regards the High-TILs subgroup (≥10%).
Supplementary Figure S3
Scatter and histogram plots of each AI-based TILs score against manual assessment of sTILs in the internal validation set of Yale cohort. The central plot of each subfigure shows the bivariate scatter plot, while the top and right histograms illustrate the distributions of each method compared to the manual sTILs.
Supplementary Figure S4
Scatter and histogram plots of each AI-based TILs score against manual assessment of sTILs in the external SCAN-B validation cohort. The central plot of each subfigure shows the bivariate scatter plot, while the top and right histograms illustrate the distributions of each method compared to the manual sTILs.
Supplementary Figure S5
Forest plot for the univariate Cox analysis of all TIL scoring methods dichotomized at 10% value, using IDFS as clinical endpoint, in the SCAN-B validation cohort. The black squares regard the hazard ratio values, while the horizontal error bars indicate the confidence interval (CI). The CI is also shown in parentheses next to the hazard ratio value. The number range at the bottom of the plot regards the hazard ratio values, while the dotted vertical line pinpoints the point where HR=1.
Supplementary Figure S6
Forest plot for the multivariate Cox analysis of all TIL scoring methods dichotomized at 10% value (adjusted for age group, tumor size group, grade and nodal status), using IDFS as clinical endpoint, in the SCAN-B validation cohort. The black squares regard the hazard ratio values, while the horizontal error bars indicate the confidence interval (CI). The CI is also shown in parentheses next to the hazard ratio value. The number range at the bottom of the plot regards the hazard ratio values, while the dotted vertical line pinpoints the point where HR=1.
Supplementary Figure S7
Forest plot for the multivariate Cox analysis of all continuous TIL scoring methods (adjusted for age group, tumor size group, grade and nodal status), using IDFS as clinical endpoint, in the chemotherapy-administered subgroup of the SCAN-B validation cohort. The black squares regard the hazard ratio values, while the horizontal error bars indicate the confidence interval (CI). The CI is also shown in parentheses next to the hazard ratio value. The number range at the bottom of the plot regards the hazard ratio values, while the dotted vertical line pinpoints the point where HR=1.
Supplementary Figure S8
Forest plot for the multivariate Cox analysis of all TIL scoring methods dichotomized at 10% value (adjusted for age group, tumor size group, grade and nodal status), using IDFS as clinical endpoint, in the chemotherapy-administered subgroup of the SCAN-B validation cohort. The black squares regard the hazard ratio values, while the horizontal error bars indicate the confidence interval (CI). The CI is also shown in parentheses next to the hazard ratio value. The number range at the bottom of the plot regards the hazard ratio values, while the dotted vertical line pinpoints the point where HR=1.
Supplementary Figure S9
Forest plot for the multivariate Cox analysis of continuous TILs scores of all methods (adjusted for age group, tumor size group, grade and nodal status), using IDFS as clinical endpoint, in the SCAN-B validation cohort. Adjusted covariates which were omitted in the main manuscript have been included here for reference. Similar HR values for each covariate is exhibited in dichotomized and chemo-administered analyses. The black squares regard the hazard ratio values, while the horizontal error bars indicate the confidence interval (CI). The CI is also shown in parentheses next to the hazard ratio value. The number range at the bottom of the plot regards the hazard ratio values, while the dotted vertical line pinpoints the point where HR=1.

References

    1. Burstein H.J., Curigliano G., Thürlimann B., et al. Customizing local and systemic therapies for women with early breast cancer: the St. Gallen international consensus guidelines for treatment of early breast cancer 2021. Ann Oncol. 2021;32(10):1216–1235. - PMC - PubMed
    1. Curigliano G., Burstein H.J., Gnant M., et al. Understanding breast cancer complexity to improve patient outcomes: the St Gallen international consensus conference for the primary therapy of individuals with early breast cancer 2023. Ann Oncol. 2023;34:970–986. - PubMed
    1. Denkert C., Loibl S., Noske A., et al. Tumor-associated lymphocytes as an independent predictor of response to neoadjuvant chemotherapy in breast cancer. J Clin Oncol. 2010;28(1):105–113. - PubMed
    1. Denkert C., von Minckwitz G., Darb-Esfahani S., et al. Tumour-infiltrating lymphocytes and prognosis in different subtypes of breast cancer: a pooled analysis of 3771 patients treated with neoadjuvant therapy. Lancet Oncol. 2018;19(1):40–50. - PubMed
    1. Loi S., Drubay D., Adams S., et al. Tumor-infiltrating lymphocytes and prognosis: a pooled individual patient analysis of early-stage triple-negative breast cancers. J Clin Oncol. 2019;37:559–569. - PMC - PubMed

LinkOut - more resources