. 2024 Nov 30:17:119-138.
doi: 10.2147/AABC.S489131. eCollection 2024.

LAMP5, One of Four Genes Related to Oxidative Stress That Predict Biochemical Recurrence-Free Survival, Promotes Proliferation and Invasion in Prostate Cancer

Affiliations

LAMP5, One of Four Genes Related to Oxidative Stress That Predict Biochemical Recurrence-Free Survival, Promotes Proliferation and Invasion in Prostate Cancer

Peiqiang Wu et al. Adv Appl Bioinform Chem. .

Retraction in

Abstract

Background: Prostate cancer (PCa) development largely depends on increased levels of oxidative stress (OS) and a deficient anti-oxidative system. Identifying genes associated with oxidative stress is critical in order to direct PCa therapy and future research.

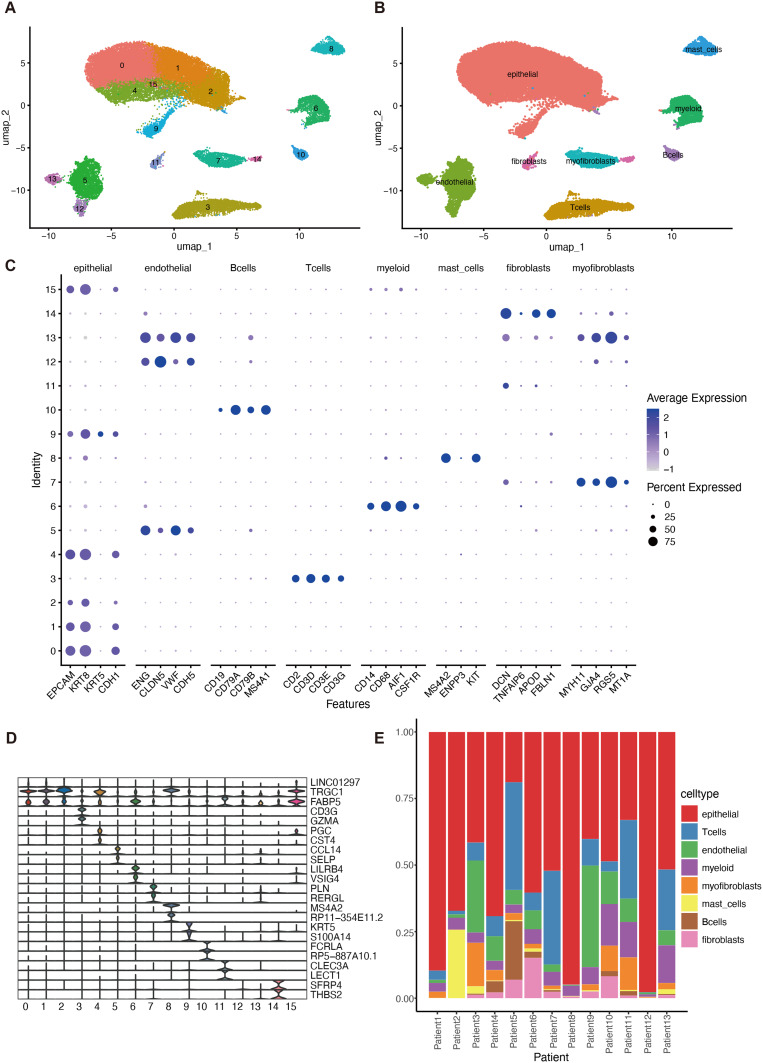
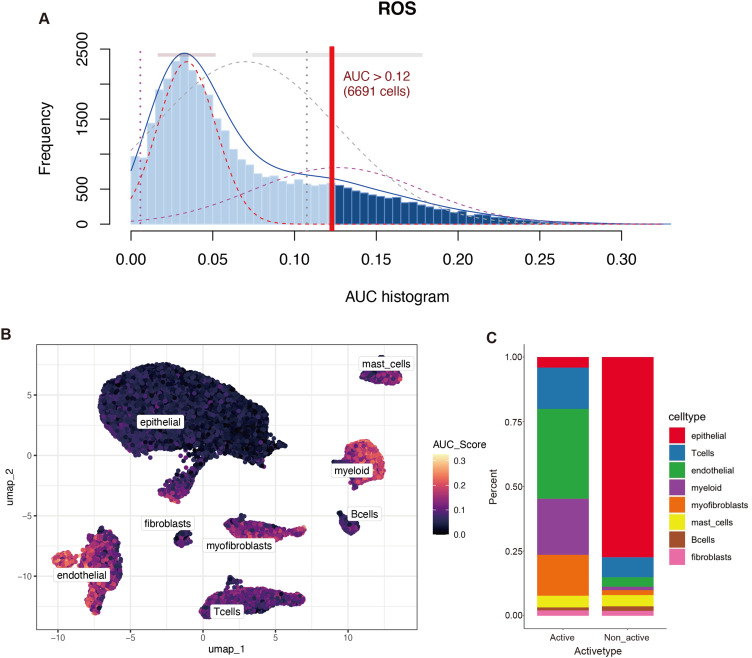
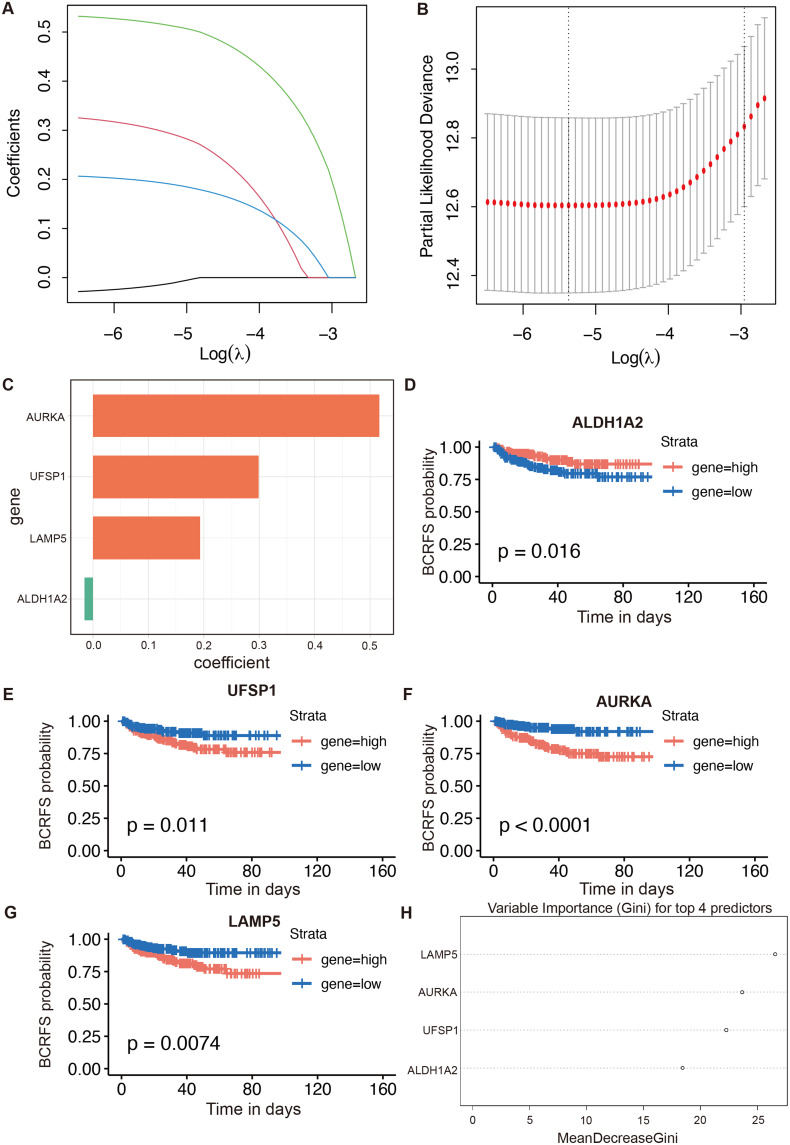
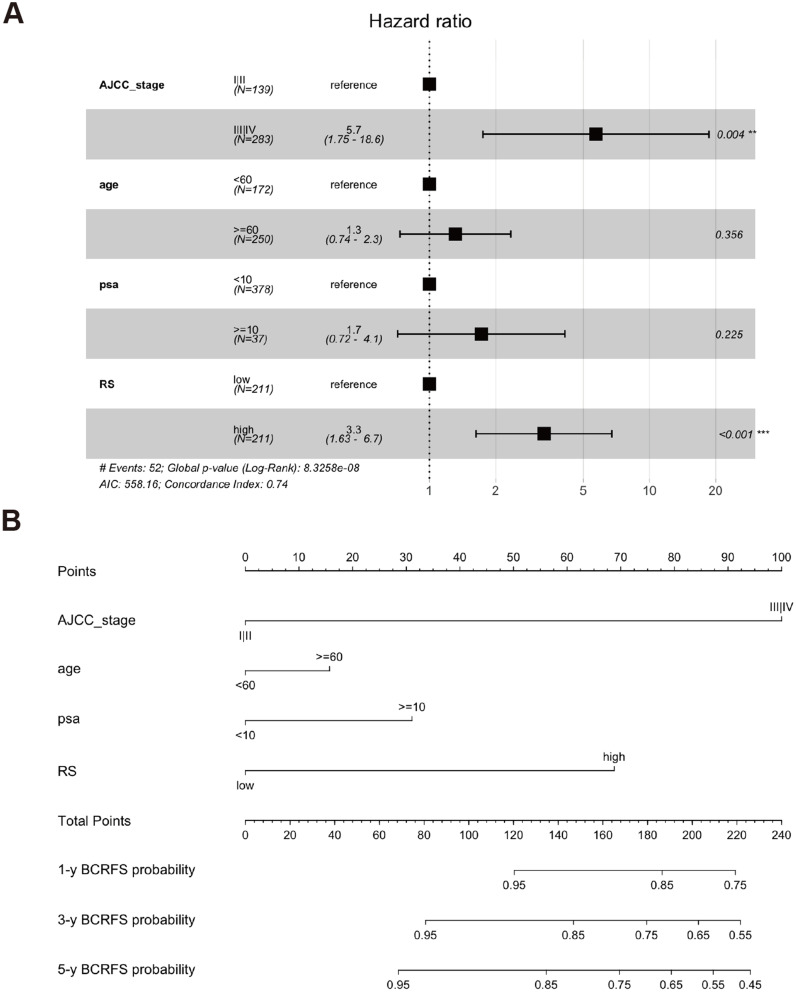
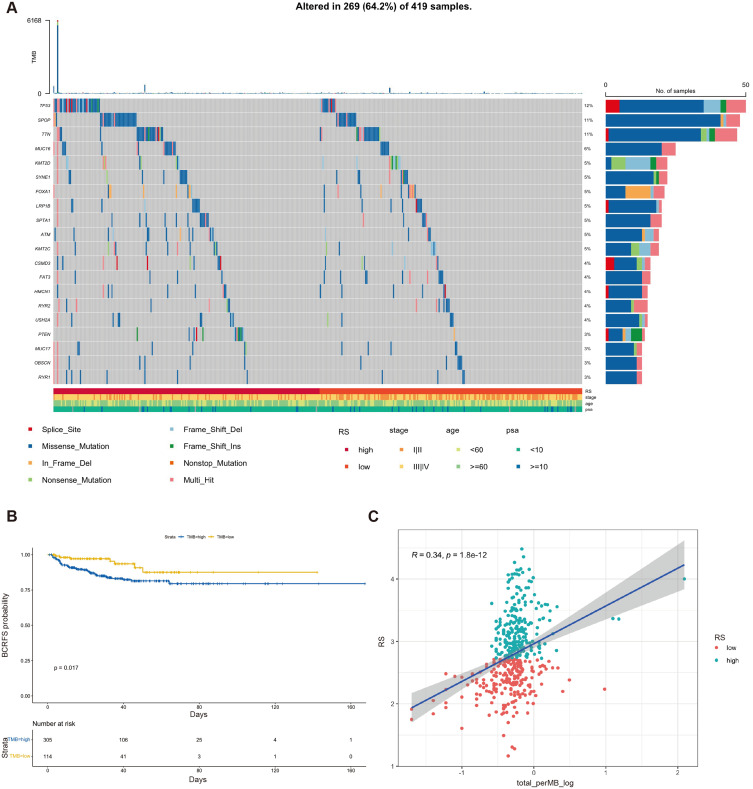
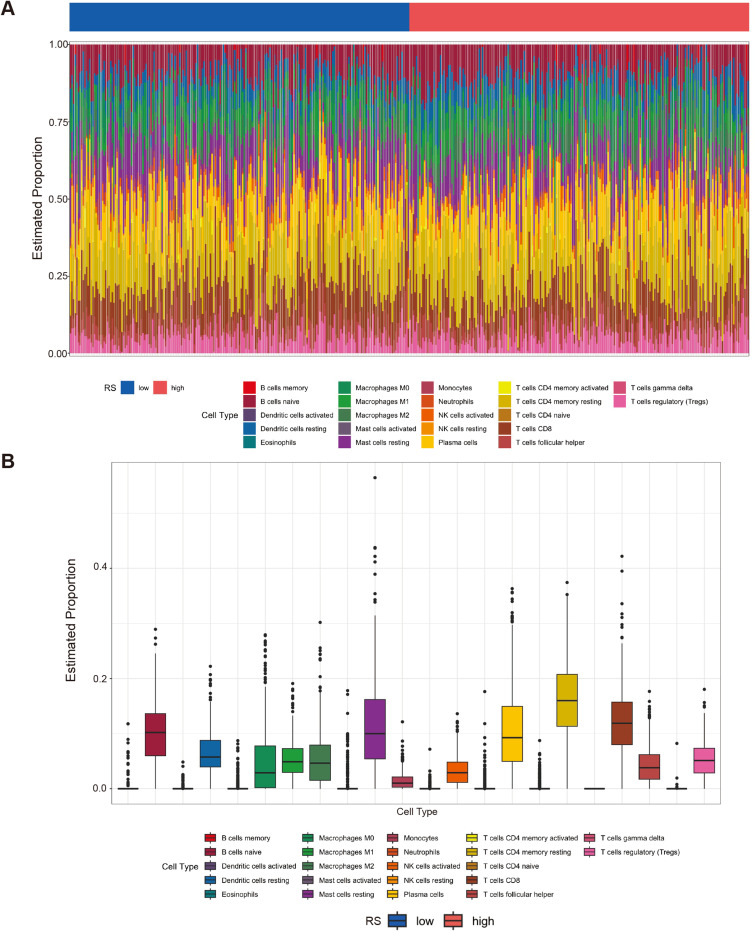
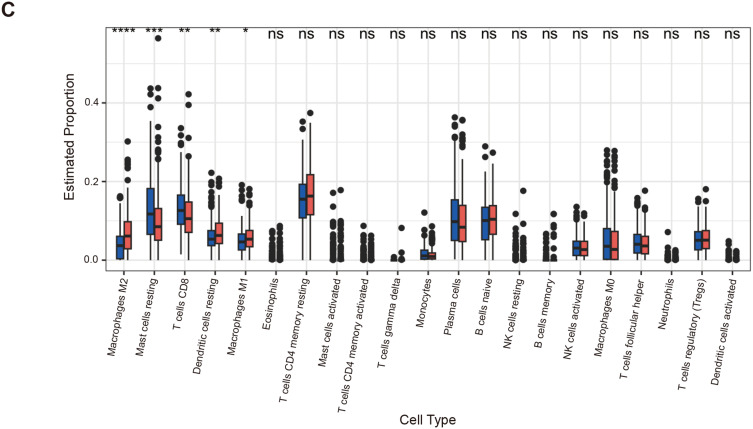
Methods: The TCGA and GTEx databases provided the bulk RNA-seq data, and the GEO database provided the single-cell data GSE141445. Utilizing reactive oxygen species (ROS) markers, single-cell analysis and cluster identification related to oxidative stress were conducted using the R packages "Seurat" and "AUCell". The differentially expressed genes (DEGs) in normal and PCa samples were identified with the "limma" R package. LASSO regression analysis was used to build a recurrence score (RS) model. The R packages "maftools" and the CIBERSORT method were employed to explore genetic mutation and the infiltrating immune cell, respectively. LAMP5 was chosen for further investigation after random forest analysis was performed.

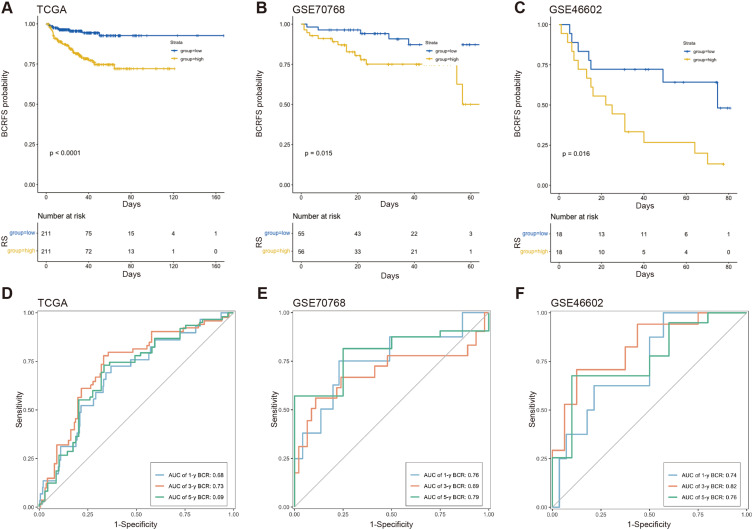
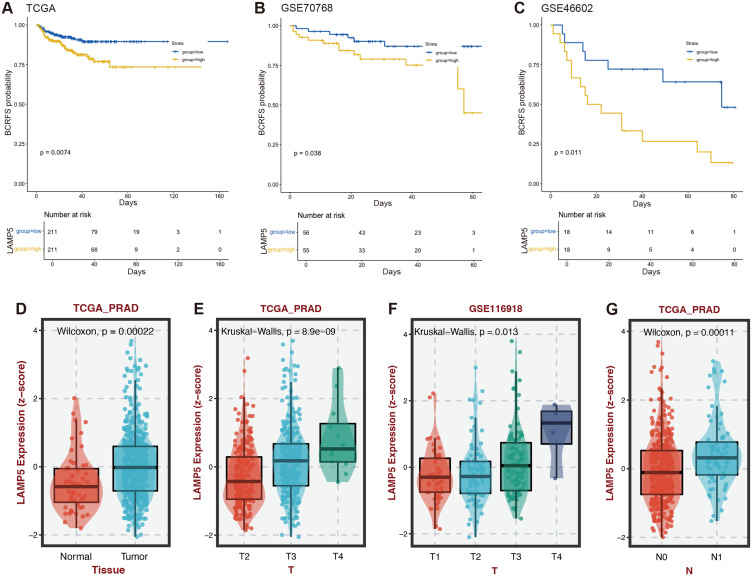
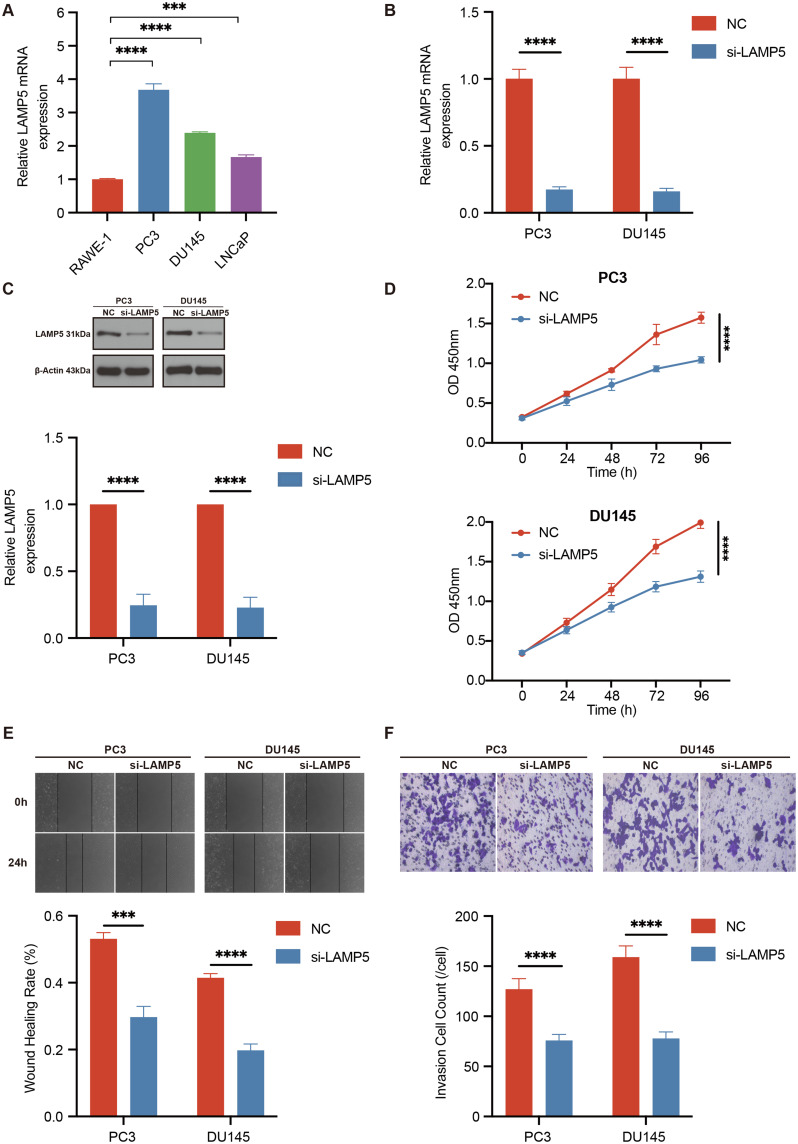
Results: The RS model for PCa was found to be an independent predictor. The tumor immune microenvironment and the frequency of gene mutations differed significantly between the high- and low-risk score groups. Further investigation revealed that downregulation of LAMP5 in PC-3 and DU145 cell lines suppressed cell proliferation and invasion, as demonstrated by the results of in vitro experiments.

Conclusion: We successfully created a robust RS model. The result of the study indicates that LAMP5 could contribute to cell proliferation and invasion in PCa.

Keywords: LAMP5; oxidative stress; prostate cancer; recurrence score model; single-cell analysis.


Conflict of interest statement

The authors declare that the research was conducted in the absence of any commercial or financial relationships that could be construed as a potential conflict of interest.

Figures

Figure 1
Figure 1
Determination of cell subgroups and marker gene expression using single-cell data. (A) UMAP displays the distribution of subgroups in PCa. (B) UMAP displays the subgroup annotation findings for PCa. (C) Marker gene expression of various kinds of cells, where the percentage of marker gene expression and the average scaled expression are shown by the size and color of the dots, respectively. (D) The violin diagram displays specific gene expression in cell subgroups. (E) Normalized infiltrating immune cell composition of each sample.
Figure 2
Figure 2
Active cell subgroup Identification. (A) The cutoff value for AUC scores of oxidative stress marker genes is 0.12. (B) UMAP displays the cell activity score. The activity level increases with color brightness. (C) The histogram displays the total distribution of the subgroup of active and inactive cells.
Figure 3
Figure 3
Lasso regression and random forest analysis of the TCGA-PRAD dataset. (A) Analysis of 4 genes using Lasso regression. (B) Lasso regression analysis with cross-validation. (C) The coefficient of the lasso regression model for the vital prognostic genes. (D-G) KM survival curve of prognostic gene signatures. (H) Random forest analysis of key prognostic genes.
Figure 4
Figure 4
Validation of the BCRFS predictive model. (A-C) KM survival curves for patients in the TCGA, GSE70768, and GSE46602 cohorts indicate high- and low-risk groups, respectively. (D-F) Time-dependent ROC curves of models for the TCGA, GSE70768, and GSE46602 cohorts at 1, 3, and 5 years.
Figure 5
Figure 5
Continued.
Figure 5
Figure 5
Nomogram construction using RS and clinical features. (A) Multivariate Cox regression analysis shows the correlation of BCRFS with RS and various clinical features based on TCGA dataset. **P<0.01, ***P<0.001. (B) The prognostic nomogram constructed using the RS and different clinical features can predict the 1-, 3-, and 5-year BCRFS rates of PCa patients. (C) Calibration curves show the predicted and actual BCRFS for 1, 3, and 5 years.
Figure 6
Figure 6
Landscapes of somatic mutations in the two groups. (A) The waterfall plot displays the top 20 genes that were mutated most frequently in two different RS groups. (B) The KM survival curve for two different TMB groups. (C) The scatter plot depicts a relationship between RS and TMB.
Figure 7
Figure 7
Continued.
Figure 7
Figure 7
Characteristics of Infiltrating Immune Cell in the Model. (A) The proportion of infiltrating immune cells in the two different RS groups. (B) The proportion of 22 different kinds of immune cells infiltrating tumors. (C) The proportion of 22 different kinds of immune cells infiltrating tumors in the two different RS groups. *P<0.05, **P<0.01, ***P<0.001, ****P<0.0001.
Figure 8
Figure 8
KM survival and Clinical correlation analysis of LAMP5. (A-C) KM survival curve of LAMP5 in the TCGA, the GSE70768, and the GSE46602 cohorts. (D-G) LAMP5 expression in different tissue types, T stages, and N stages.
Figure 9
Figure 9
Experimental Validation of LAMP5 in PCa. (A) RT-qPCR of LAMP5 expression in PCa cell lines. (B and C) RT-qPCR and Western blot analysis verified the efficacy of LAMP5 knockdown; Original blots/gels are presented in Supplementary Figure 5. (D) CCK-8 assay detected the proliferative activity of PCa cells. (E) Wound-healing assay showed the migration ability of PCa cells. (F) Transwell invasion assay showed the invasion ability of PCa cells. ***P<0.001, ****P<0.0001.

Similar articles

References

    1. Bray F, Laversanne M, Sung H, et al. Global cancer statistics 2022: GLOBOCAN estimates of incidence and mortality worldwide for 36 cancers in 185 countries. CA Cancer J Clin. 2024;74(3):229–263. doi:10.3322/caac.21834 - DOI - PubMed
    1. Van den Broeck T, van den Bergh RCN, Arfi N, et al. Prognostic value of biochemical recurrence following treatment with curative intent for prostate cancer: a systematic review. Eur Urol. 2019;75(6):967–987. doi:10.1016/j.eururo.2018.10.011 - DOI - PubMed
    1. Heidenreich A, Bastian PJ, Bellmunt J, et al. EAU guidelines on prostate cancer. Part II: treatment of advanced, relapsing, and castration-resistant prostate cancer. Eur Urol. 2014;65(2):467–479. doi:10.1016/j.eururo.2013.11.002 - DOI - PubMed
    1. Roach M, Hanks G, Thames H, et al. Defining biochemical failure following radiotherapy with or without hormonal therapy in men with clinically localized prostate cancer: recommendations of the RTOG-ASTRO phoenix consensus conference. Int J Radiat Oncol Biol Phys. 2006;65(4):965–974. doi:10.1016/j.ijrobp.2006.04.029 - DOI - PubMed
    1. Stephenson AJ, Kattan MW, Eastham JA, et al. Defining biochemical recurrence of prostate cancer after radical prostatectomy: a proposal for a standardized definition. J Clin Oncol. 2006;24(24):3973–3978. doi:10.1200/JCO.2005.04.0756 - DOI - PubMed

Publication types

LinkOut - more resources