Review
. 2024 Nov 21:45:162-180.
doi: 10.1016/j.bioactmat.2024.11.012. eCollection 2025 Mar.

Epitope-imprinted biomaterials with tailor-made molecular targeting for biomedical applications

Affiliations
Review

Epitope-imprinted biomaterials with tailor-made molecular targeting for biomedical applications

Youlu Diao et al. Bioact Mater. .

Abstract

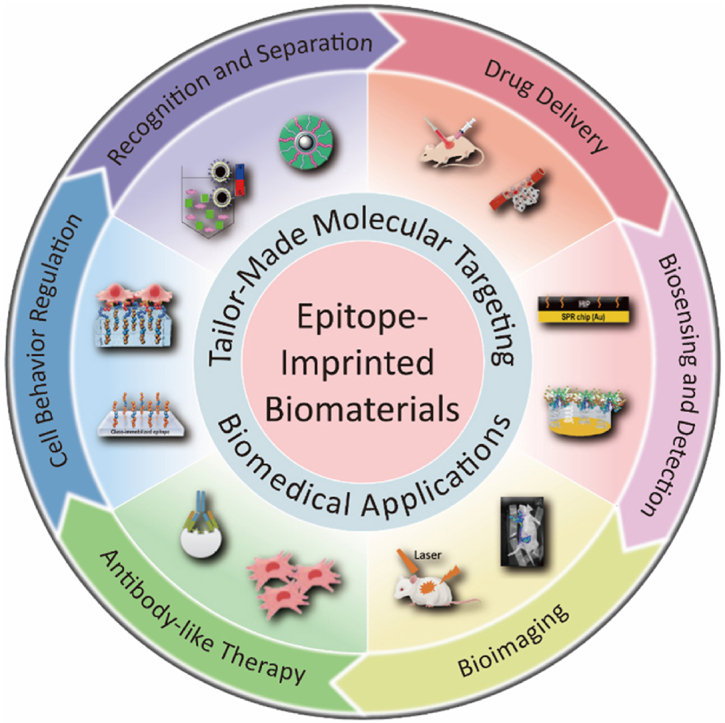
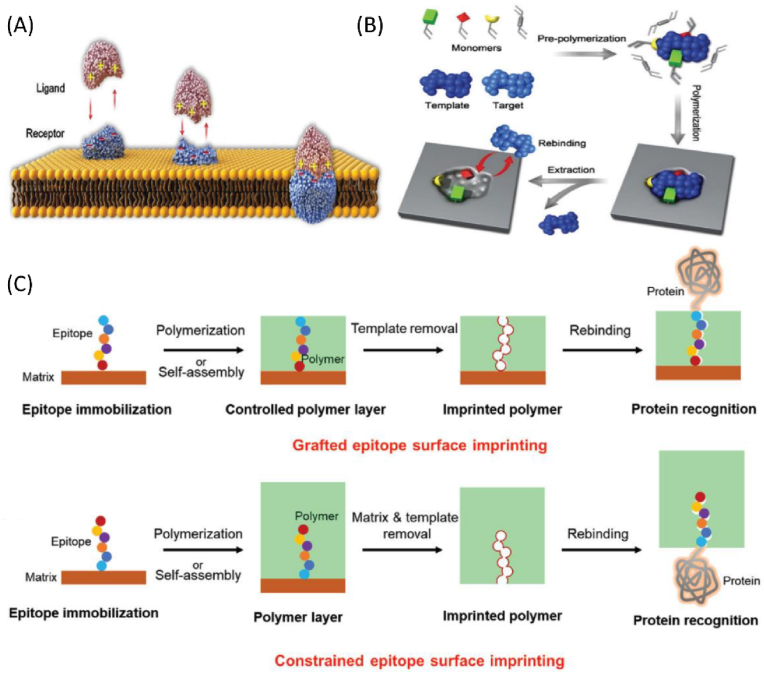
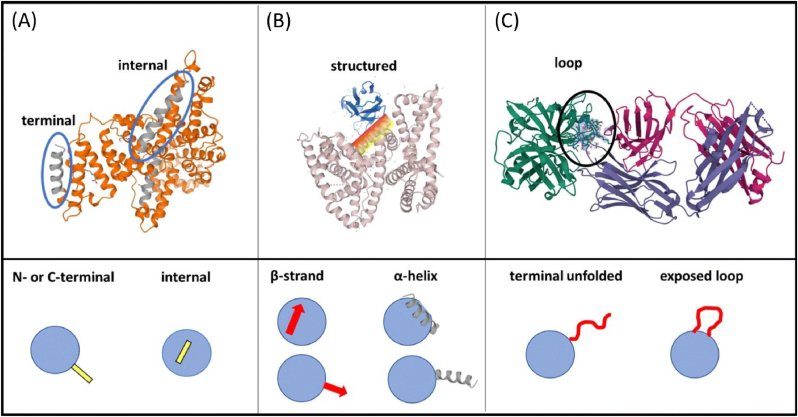
Molecular imprinting technology (MIT), a synthetic strategy to create tailor-made molecular specificity, has recently achieved significant advancements. Epitope imprinting strategy, an improved MIT by imprinting the epitopes of biomolecules (e.g., proteins and nucleic acids), enables to target the entire molecule through recognizing partial epitopes exposed on it, greatly expanding the applicability and simplifying synthesis process of molecularly imprinted polymers (MIPs). Thus, epitope imprinting strategy offers promising solutions for the fabrication of smart biomaterials with molecular targeting and exhibits wide applications in various biomedical scenarios. This review explores the latest advances in epitope imprinting techniques, emphasizing selection of epitopes and functional monomers. We highlight the significant improvements in specificity, sensitivity, and stability of these materials, which have facilitated their use in bioanalysis, clinical therapy, and pharmaceutical development. Additionally, we discuss the application of epitope-imprinted materials in the recognition and detection of peptides, proteins, and cells. Despite these advancements, challenges such as template complexity, imprinting efficiency, and scalability remain. This review addresses these issues and proposes potential directions for future research to overcome these barriers, thereby enhancing the efficacy and practicality of epitope molecularly imprinting technology in biomedical fields.

Keywords: Cell recognition; Drug delivery; Epitope imprinting; Molecular targeting; Synthetic antibody.


Conflict of interest statement

The authors declared that no conflict of interest in this paper.

Figures

Image 1
Graphical abstract
Fig. 1
Fig. 1
(A) The innate development of receptor-ligand complexes with remarkable complementarity in their chemical roles and geometries. Primary recognition, conformational change, and specific binding are listed from left to right. (B) The diagram of the molecularly imprinted process's mechanism [11]. (C) Diagrammatic illustration of the grafted epitope surface imprinting and restricted epitope surface imprinting techniques. Reproduced with permission [9]. Copyright 2019 WILEY‐VCH Verlag GmbH & Co. KGaA, Weinheim.
Fig. 2
Fig. 2
Antigenic determinants that emerge from a contiguous amino acid sequence are particularly promising for imprinted purposes. These can be categorized as follows: (A) Epitopes can be found at the protein's N- or C-terminus, or within its linear amino acid sequence, and are known as internal epitopes. (B) Certain epitopes are distinguished by their secondary structural features, such as alpha-helices or beta-strands, and are thus classified as structured epitopes. (C) Many epitopes lack a clear secondary structure and are often described as loose ends or flexible loops in proteins. Despite their flexibility, these epitopes are exposed to the solvent and accessible to binding partners in a specific orientation, which is governed by certain directional constraints. The following structures are exemplified: (A) Human serum albumin (HSA). (B) The co-crystal structure of HSA with the shark IgNAR variable domain. (C) The co-crystal structure of the Fab fragment with human serum kallikrein. Reproduced with permission [53]. Copyright 2021 The Author(s). Analytical and Bioanalytical Chemistry published by Springer Nature.
Fig. 3
Fig. 3
(A) STEM image and EDS mapping (including C, Si, O, B, S, and N elements) of FITC-MILND. Scale bar: 1 μm. Reproduced with permission [66]. Copyright 2024 Elsevier Ltd. (B) TEM images of MagMIP (left)s and MagNanoGels (right) [67].
Fig. 4
Fig. 4
(A) The experimental production of MCNTs@D-EIPs is facilitated by employing a dual-template epitope imprinting approach, integrating metal chelation imprinted with distillation-precipitation polymerization. Reproduced with permission [81]. Copyright 2018 Elsevier B.V. (B) A schematic representation of the synthetic procedure for Fe3O4@EIPs is provided, along with a depiction of the selective enrichment process for Cyt C utilizing Fe3O4@EIPs microspheres and magnetic separation. Reproduced with permission [83]. Copyright 2017 Elsevier B.V.
Fig. 5
Fig. 5
(A) The schematic depicts the creation of double-imprinted nanoMIPs, using an EGFR peptide as the primary and doxorubicin as the secondary template. (B) Cytotoxicity of EGFR-nanoMIPs (with and without doxorubicin) on MDA-MB-468 and SKBR-3 cells was evaluated by MTS assay, with a nanoMIP-free control group. (C) FACS analysis showed increased sub-G1 MDA-MB-468 cells with doxo-nanoMIPs (95 nM doxorubicin) and free doxorubicin (100 nM), with one-way ANOVA (P < 0.01) for significance. FACS analysis on (D) FACS analysis was performed on SKBR-3 cells, which express low levels of EGFR, and (E) MDA-MB-468 cells were utilized to establish a correlation between the binding affinity of EGFR-nanoMIPs and the abundance of EGFR on the cell surface. (F) Laser confocal microscopy confirmed EGFR-nanoMIP binding in SKBR-3 and (G) MDA-MB-468 cells (green fluorescence). Reproduced with permission [98]. Copyright 2018 American Chemical Society.
Fig. 6
Fig. 6
(A) A schematic representation of the QCM chip and the QCM experimental setup is provided. AFM images are presented for (B) EMIP-QCM and (C) a bare QCM surface. (D) The adsorption capacity of EMIP (a) and ENIP (b) was evaluated at various adsorption times, with a constant concentration of HSA at 1.0 mg mL−1. (E) The adsorption capacity of EMIP (a) and ENIP (b) was also assessed at different concentrations of HSA, with a fixed adsorption time of 12 h. Reproduced with permission [117]. Copyright 2017 Elsevier B.V. (F) The diagram illustrates coating a gold SPR chip with dopamine and MIP templates or dopamine alone for NIP, for analyte capture and detection. Reproduced with permission [119]. Copyright 2018 Elsevier B.V. (G) Raman reporter indicator mechanism for SERS sensing of protein. Reproduced with permission [122]. Copyright 2020 Elsevier B.V.
Fig. 7
Fig. 7
(A) The structural model depicts hVEGF and its epitope in complex with the FLT-1 receptor, illustrating the spatial interactions crucial for understanding molecular recognition and binding. (B) The schematic outlines our in vivo experiments: (i) QD-MIPs against hVEGF in hVEGF-positive and negative models, and (ii) QD-NIPs against vancomycin in an hVEGF-positive model. (C) ANOVA Bonferroni analysis compared nanoprobe-cell distances in QD-MIPs (hVEGF(+)), QD-NIPs (WM-266 hVEGF(+)), and QD-MIPs (hVEGF(−)) models, yielding a p-value of 0.0006 (n ≥ 7 embryos). (D) Images of WM-266 (hVEGF+) and A-375 (hVEGF-) cells with nanoprobes, with an overlay and 100 μm scale bar. Reproduced with permission [128]. Copyright 2017 American Chemical Society. (E) MIPs are used to image sialic acid-ending sugar patterns. (F) Fluorescence images of DU145 cells with FITC-lectin, nuclei stained by DAPI, and a 10 μm scale bar. Reproduced with permission [129]. Copyright 2015 American Chemical Society. (G) A diagram shows how FZIF-8/DOX-MIPs are used for targeted imaging and drug delivery that responds to GSH and pH levels. (H) MCF-7 tumor mice were imaged post-injection of two nanoparticle types at 530 nm excitation. (I) The relative tumor volume is charted over the course of the treatment. Reproduced with permission [130]. Copyright 2020 American Chemical Society.
Fig. 8
Fig. 8
(A) The schematic shows a strategy for enhancing immunotherapy by reversing PD-L1 immunosuppression with MILND. (B) A schematic representation of the therapeutic procedure applied to a 4T1 tumor-bearing mouse model is provided. (C) Tumor growth curves are presented, comparing the effects of different treatment regimens. (D) The variation in body weight of mice is documented throughout the 15-day treatment period. (E) Photographs and (F) Tumor weights from different treatment groups are shown, harvested on day 15. Error bars represent standard deviations (n = 5). Reproduced with permission [139]. Copyright 2024, American Chemical Society. (G) CLSM images and (H) Hs578T cells (DiI green) and U937 cells (DiD red) were analyzed by flow cytometry. Phagocytosis is indicated by arrows and squares, with a 20 μm scale bar. (I) Mice with MDA-MB-157 tumors were imaged post-IV injection of MINBs and NINBs (5 mg/mL, 200 μL). Tumor regions are indicated by red circles. (J) Time-dependent changes in fluorescence intensity at the tumor sites are plotted for the mice (n = 3). (K) Ex vivo fluorescence imaging of tumors and major organs from mice in MINBs and NINBs groups after euthanasia. (L) ROI analysis measures the fluorescent signal from tumors and organs, with error bars showing standard deviations for three samples. Reproduced with permission [141]. Copyright 2023 The Authors. Angewandte Chemie International Edition published by Wiley-VCH GmbH.
Fig. 9
Fig. 9
(A) A diagram shows the experiment: hASCs on MINP-2-coated surfaces had stronger TGF-β3 signaling than those on NINP-2 surfaces. (B) qPCR results for genes that are either upregulated (SOX9, SCX) or downregulated (FABP4) by TGF-β3/Smad signaling are shown. Data are normalized to GAPDH and YWHAZ genes and shown as fold changes from pre-seeding gene levels (n = 3). Statistical analysis by two-way ANOVA followed by Šidák's post hoc tests. (∗∗∗p < 0.001, ∗∗∗∗p < 0.0001). (C) A diagram shows that hASC pellets cultured with MINP-2 had more matrix production than those cultured with NINP-2. (D) Light microscopy images of hASC pellets stained with Masson's trichrome are displayed. Left: scale bar—150 μm. Right: scale bar—50 μm; red arrows indicate the collagenous matrix. (E) Light microscopy images of hASC pellets stained with Alcian blue (AB) are presented. Left image has a scale bar of 150 μm. Right image has a scale bar of 50 μm, with black arrows indicating the glycosaminoglycan-rich matrix stained by AB. Reproduced with permission [150]. Copyright 2020 Wiley‐VCH GmbH. (F) Developing a biointerface imprinted with epitopes for dynamic cell adhesion. Reproduced with permission [154]. Copyright 2017 The Authors. Angewandte Chemie International Edition published by Wiley-VCH Verlag GmbH & Co. KGaA.

Similar articles

Cited by

References

    1. Chen L.X., Wang X.Y., Lu W.H., Wu X.Q., Li J.H. Molecular imprinting: perspectives and applications. Chem. Soc. Rev. 2016;45:2137–2211. doi: 10.1039/c6cs00061d. - DOI - PubMed
    1. Ali M.M., Zhu S., Amin F.R., Hussain D., Du Z., Hu L. Molecular imprinting of glycoproteins: from preparation to cancer theranostics. Theranostics. 2022;12:2406–2426. doi: 10.7150/thno.69189. - DOI - PMC - PubMed
    1. Hansen D.E. Recent developments in the molecular imprinting of proteins. Biomaterials. 2007;28:4178–4191. doi: 10.1016/j.biomaterials.2007.06.017. - DOI - PubMed
    1. Li Y., Tan L., Li H., Xu Z., Zuo X., Tang Y. An artificial receptor fabricated by target recognition determinant imprinting for selective capture of α-amanitin. J. Chromatogr. A. 2014;1324:190–197. doi: 10.1016/j.chroma.2013.11.042. - DOI - PubMed
    1. Teixeira S.P.B., Reis R.L., Peppas N.A., Gomes M.E., Domingues R.M.A. Epitope-imprinted polymers: design principles of synthetic binding partners for natural biomacromolecules. Sci. Adv. 2021;7 doi: 10.1126/sciadv.abi9884. - DOI - PMC - PubMed

LinkOut - more resources