. 2022 May 9;11(12):2909-2919.
doi: 10.1515/nanoph-2022-0108. eCollection 2022 Jun.

Topologically driven Rabi-oscillating interference dislocation

Affiliations

Topologically driven Rabi-oscillating interference dislocation

Amir Rahmani et al. Nanophotonics. .

Abstract

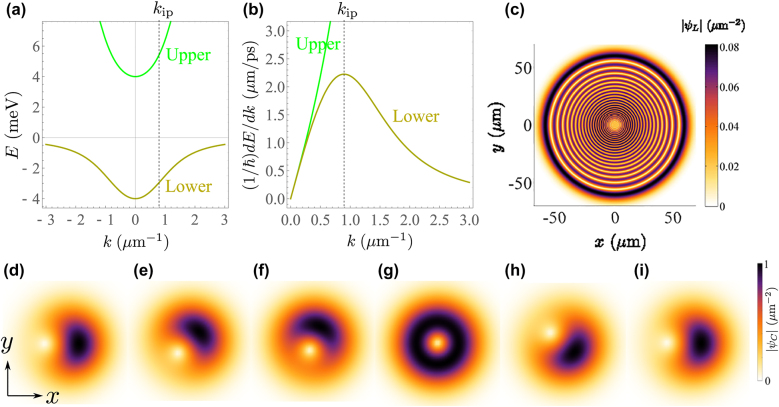
Quantum vortices are the quantized version of classical vortices. Their center is a phase singularity or vortex core around which the flow of particles as a whole circulates and is typical in superfluids, condensates and optical fields. However, the exploration of the motion of the phase singularities in coherently-coupled systems is still underway. We theoretically analyze the propagation of an interference dislocation in the regime of strong coupling between light and matter, with strong mass imbalance, corresponding to the case of microcavity exciton-polaritons. To this end, we utilize combinations of vortex and tightly focused Gaussian beams, which are introduced through resonant pulsed pumping. We show that a dislocation originates from self-interference fringes, due to the non-parabolic dispersion of polaritons combined with moving Rabi-oscillating vortices. The morphology of singularities is analyzed in the Poincaré space for the pseudospin associated to the polariton states. The resulting beam carries orbital angular momentum with decaying oscillations due to the loss of spatial overlap between the normal modes of the polariton system.

Keywords: exciton-polariton; interference dislocation; linear momentum; orbital angular momentum; self-interfering wavepacket.


Figures

Figure 1:
Figure 1:
Background concepts. (a) Branches of exciton–polariton dispersion; the lower polariton dispersion, shown in dark yellow, deviates from the parabolic shape for k > kip. The upper branch, shown in green, is always almost parabolic. Considering the lower branch, its concavity is upward for k > kip and is downward for k < kip, and as a consequence kip is an inflection point. (b) The derivative of energy (E) with respect to wavenumber (k) shows a local maximum at the inflection point kip, so the lower polariton packet is slower beyond kip. (c) Example of self-interfering wavepacket for the lower polariton (ψL), generated from a 1.5 μm wide initial state and after 200 ps of diffusion. This regime is reached by exciting with a momentum width extending over the inflection point of the lower branch, that is by a spatially tight beam, where the field interferes with itself. (d–i) Rabi oscillating  motion of a displaced vortex as seen in the photon component of the exciton–polariton field. The vortex core (the point of zero density) makes an entire counter-clockwise rotation during a Rabi cycle.. Here the size of the packet is large enough large in real space so that the wavepacket never straddles the inflection point.
Figure 2:
Figure 2:
The regime of Rabi interference dislocation, shown in the amplitude of the photon component of polaritons. After sending the second pulse, the mixed dynamics of SIP and the moving Rabi vortices produce a moving dislocation in the pattern. The dislocation stems from the misalignment of the rings, induced by the motion of the vortex core. Here, different frames along one Rabi period have been chosen. In each frame, the position of the vortex core is shown by a blue point. It follows an expanding orbit that is shown (in one period) by the dark-dashed green line in the first panel. The starting point is marked as a green dot and the end point as a red one. For the numerical simulations, we used: Ω = 4 meV, ω = −Ω/3, W1 = 5 μm, W2 = 1.2 μm, t1 = 0, t2 = 1.5 ps, δ t = 0.3 ps, R1 = 1 ps−1, and R2 = 4 ps−1.
Figure 3:
Figure 3:
(a) Creation, evolution and stabilization of the NTLM vector, here for the lower polariton field. The final direction is shown by the red vector. (b) Different values of Δt (time delay between the pulses) yield different final NTLM directions. (c) Amplitude of the total linear momentum ⟨p⟩ = ⟨pC⟩ + ⟨pX⟩ = ⟨pL⟩ + ⟨pU⟩ for different Δt. Linear momentum is created with the second pulse and remains constant when its direction stabilizes. (d) Wavepacket centroids for various fields, showing with curly curly oscillations of the bare fields and straight linear motion for the dressed ones (the small deviations in the L direction at earlier times are not visible on this scale).
Figure 4:
Figure 4:
Various representations of the fields morphology, namely, based on their relative phase σ=argψU*ψL and amplitude s={|ψU|2|ψL|2}{|ψU|2+|ψL|2} (in upper–lower polariton basis), isolines of σ and s, ellipses (in upper–lower polariton basis), and amplitude (the square root is used to enhance the contrast) of the photon and exciton fields together with vortex cores and saddle points, at t = 3.15 ps. (a) The phase map of σ, also shows the positions of vortices in the upper–lower basis. Indeed, the unitary vortex charges in each of the two fields compose a vortex dipole in the relative phase map. The displaced vortices (located at yellow and green rings) also induce two saddle points (indicated by two cross symbols) in the relative phase. (b) The relative amplitude s (or equivalently the amplitude of quantum states) varies between −1 and 1 and has an inhomogeneous profile. Panels (a) and (b) imply that all quantum states of the Poincaré sphere are simultaneously present in the 2D space. (c) The isolines of relative phase (shown as black curves, at π/3 intervals) are superimposed with isolines of the relative amplitudes: s (white lines, at 0.4 intervals). (d) Elliptical representation of the polariton state and its spatial variations in 2D space. The green (yellow) point, where the state of the ellipse becomes a circle, corresponds to the upper (lower) vortex core. The state of the ellipse is linear at the exciton and photon vortex cores (blue antidiagonal and red diagonal, respectively). Indeed, at the exciton and photon vortex cores, the polariton state is purely photonic and excitonic, respectively. (e) Squared amplitude of the photon field, with the position of the vortex core at intersection of s = 0 and σ = 0. (f) Squared amplitude map of the exciton field, with the position of the vortex core at the intersection of s = 0 and σ = π. The vortex cores in real space move along the inner white curve during a Rabi cycle.
Figure 5:
Figure 5:
Relative phases and vortex cores positions at different times. (a) and (c) Show the phase map of σ=ψU*ψL , which is the relative phase between the upper and lower fields, at t = 3.15 ps and t = 8.14 ps, respectively. The corresponding phase map of ψC*ψX , between the exciton and photon fields, is shown in panels (b) and (d), at the same times as (a–c). The position of the vortex cores in all the fields are shown by C, X, L, U labels (for photon, exciton, lower polariton and upper polariton). The upper mode, excited by the second and tight pulse, undergoes a rapid diffusion, and the initial vortex core remains little affected by interferences, remaining almost at the center of the packet, close to the origin of the 2D map (green circle). The core in the lower mode experiences a larger interference with the tight excitation diffusing more slowly, for such a reason it is displaced at the boundary of the packet (yellow circle). The core in the lower mode is then set aside due to the delayed arrival of different radial momenta (changing the interfering phase and hence azimuthal position of the vortex core). However, the cores in the photon and exciton fields are displaced at the boundary as well, and due to Rabi oscillations, they orbit, e.g., around the lower mode core. Differential diffusion between the two normal modes then leads to a loss of their overlap, damping the Rabi oscillations and reducing the C, X vortex cores orbits.
Figure 6:
Figure 6:
Time-varying orbital angular momentum. Although there is no decay of the fields, oscillations dampen in time. This is due to the fast diffusion of the packet in the upper mode and the consequent loss of overlap with the lower mode. This happens in a small fraction of the polariton lifetime and can be engineered either by energy or packet size manipulations. In (a–b) the energy detuning is δ = 0. We assume δ = 1.5 in (c–d) and δ = −1.5 in (e–f). We used W = 2 μm for the first pulse and w = 0.5 μm for the second pulse.

References

    1. Blatter G., Feigel’man M. V., Geshkenbein V. B., Larkin A. I., Vinokur V. M. Vortices in high-temperature superconductors. Rev. Mod. Phys. . 1994;66:1125. doi: 10.1103/revmodphys.66.1125. - DOI
    1. Leggett A. J. Superfluidity. Rev. Mod. Phys. . 1999;71:S318. doi: 10.1103/revmodphys.71.s318. - DOI
    1. Matthews M. R., Anderson B. P., Haljan P. C., Hall D. S., Wieman C. E., Cornell E. A. Vortices in a Bose-Einstein condensate. Phys. Rev. Lett. . 1999;83:2498. doi: 10.1103/physrevlett.83.2498. - DOI
    1. Franke-Arnold S., Allen L., Padgett M. Advances in optical angular momentum. Laser Photon. Rev. . 2008;2:299. doi: 10.1002/lpor.200810007. - DOI
    1. Lagoudakis K. G., Wouters M., Richard M., et al. Quantized vortices in an exciton–polariton condensate. Nat. Phys. . 2008;4:706. doi: 10.1038/nphys1051. - DOI

LinkOut - more resources