

Exploring the pathogenesis, biomarkers, and potential drugs for type 2 diabetes mellitus and acute pancreatitis through a comprehensive bioinformatic analysis
- PMID: 39634181
- PMCID: PMC11614670
- DOI: 10.3389/fendo.2024.1405726
Exploring the pathogenesis, biomarkers, and potential drugs for type 2 diabetes mellitus and acute pancreatitis through a comprehensive bioinformatic analysis
Abstract
Background: Type 2 diabetes mellitus (T2DM) is a chronic metabolic disease that accounts for > 90% of all diabetes cases. Acute pancreatitis (AP) can be triggered by various factors and is a potentially life-threatening condition. Although T2DM has been shown to have a close relationship with AP, the common mechanisms underlying the two conditions remain unclear.
Methods: We identified common differentially expressed genes (DEGs) in T2DM and AP and used functional enrichment analysis and Mendelian randomization to understand the underlying mechanisms. Subsequently, we used several machine learning algorithms to identify candidate biomarkers and construct a diagnostic nomogram for T2DM and AP. The diagnostic performance of the model was evaluated using ROC, calibration, and DCA curves. Furthermore, we investigated the potential roles of core genes in T2DM and AP using GSEA, xCell, and single-cell atlas and by constructing a ceRNA network. Finally, we identified potential small-molecule compounds with therapeutic effects on T2DM and AP using the CMap database and molecular docking.
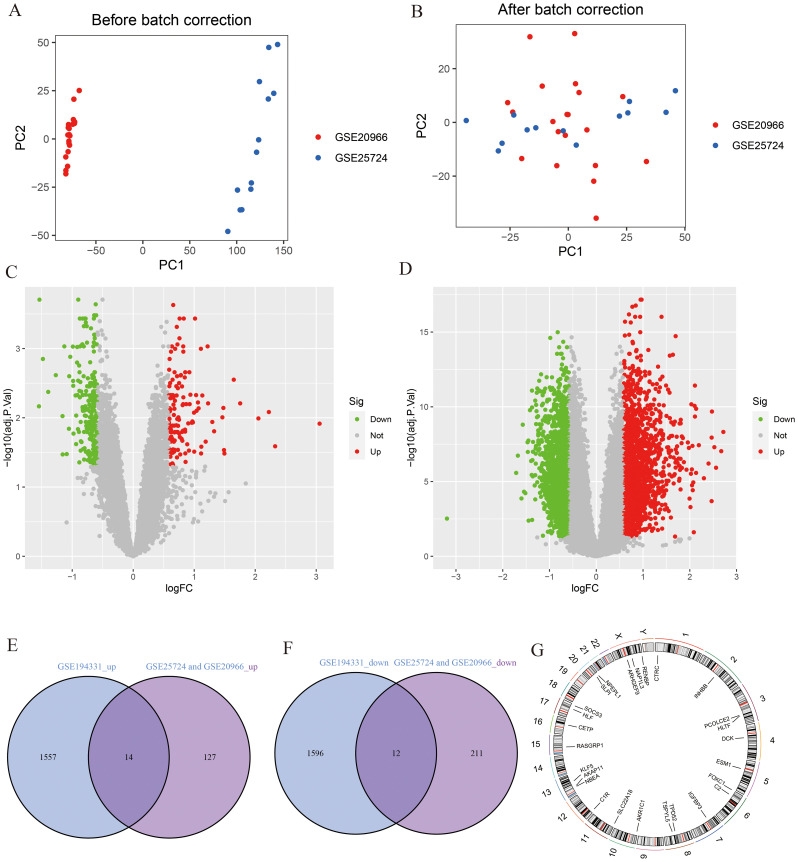
Results: A total of 26 DEGs, with 14 upregulated and 12 downregulated genes, were common between T2DM and AP. According to functional and DisGeNET enrichment analysis, these DEGs were mainly enriched in immune effector processes, blood vessel development, dyslipidemia, and hyperlipidemia. Mendelian randomization analyses further suggested that lipids may be a potential link between AP and T2DM. Machine learning algorithms revealed ARHGEF9 and SLPI as common genes associated with the two diseases. ROC, calibration, and DCA curves showed that the two-gene model had good diagnostic efficacy. Additionally, the two genes were found to be closely associated with immune cell infiltration. Finally, imatinib was identified as a potential compound for the treatment of T2DM and AP.
Conclusion: This study suggests that abnormal lipid metabolism is a potential crosstalk mechanism between T2DM and AP. In addition, we established a two-gene model for the clinical diagnosis of T2DM and AP and identified imatinib as a potential therapeutic agent for both diseases.
Keywords: acute pancreatitis; biomarker; machine learning; molecular docking; type 2 diabetes mellitus.
Copyright © 2024 Zhong, Yang, Shang, Yang, Li, Liu, Zhang, Liu and Jiang.
Conflict of interest statement
The authors declare that the research was conducted in the absence of any commercial or financial relationships that could be construed as a potential conflict of interest.
Figures


Similar articles
-
Investigating potential biomarkers of acute pancreatitis in patients with a BMI>30 using Mendelian randomization and transcriptomic analysis.Lipids Health Dis. 2024 Apr 22;23(1):119. doi: 10.1186/s12944-024-02102-3. Lipids Health Dis. 2024. PMID: 38649912 Free PMC article.
-
Integrative bioinformatics analysis of biomarkers and pathways for exploring the mechanisms and molecular targets associated with pyroptosis in type 2 diabetes mellitus.Front Endocrinol (Lausanne). 2023 Nov 15;14:1207142. doi: 10.3389/fendo.2023.1207142. eCollection 2023. Front Endocrinol (Lausanne). 2023. PMID: 38034011 Free PMC article.
-
Identification and study of mood-related biomarkers and potential molecular mechanisms in type 2 diabetes mellitus.J Mol Histol. 2025 Feb 7;56(2):82. doi: 10.1007/s10735-025-10353-2. J Mol Histol. 2025. PMID: 39915429
-
Bioinformatics analysis of effective biomarkers and immune infiltration in type 2 diabetes with cognitive impairment and aging.Sci Rep. 2024 Oct 7;14(1):23279. doi: 10.1038/s41598-024-74480-8. Sci Rep. 2024. PMID: 39375405 Free PMC article.
-
Integrating bioinformatics and machine learning to unravel shared mechanisms and biomarkers in chronic obstructive pulmonary disease and type 2 diabetes.Postgrad Med J. 2025 May 18;101(1196):535-544. doi: 10.1093/postmj/qgae186. Postgrad Med J. 2025. PMID: 39691970
Cited by
-
Multi-Omics Profiling Reveals Glycerolipid Metabolism-Associated Molecular Subtypes and Identifies ALDH2 as a Prognostic Biomarker in Pancreatic Cancer.Metabolites. 2025 Mar 18;15(3):207. doi: 10.3390/metabo15030207. Metabolites. 2025. PMID: 40137171 Free PMC article.
-
Targeting PFKFB3 to restore glucose metabolism in acute pancreatitis via nanovesicle delivery.Mol Med. 2025 Jul 5;31(1):253. doi: 10.1186/s10020-025-01261-y. Mol Med. 2025. PMID: 40618046 Free PMC article.
-
Identification of biomarkers associated with programmed cell death in liver ischemia-reperfusion injury: insights from machine learning frameworks and molecular docking in multiple cohorts.Front Med (Lausanne). 2025 Mar 14;12:1501467. doi: 10.3389/fmed.2025.1501467. eCollection 2025. Front Med (Lausanne). 2025. PMID: 40160318 Free PMC article.
References
-
- Xiao AY, Tan ML, Wu LM, Asrani VM, Windsor JA, Yadav D, et al. . Global incidence and mortality of pancreatic diseases: a systematic review, meta-analysis, and meta-regression of population-based cohort studies. Lancet Gastroenterol Hepatol. (2016) 1:45–55. doi: 10.1016/S2468-1253(16)30004-8 - DOI - PubMed
MeSH terms
Substances
LinkOut - more resources
Full Text Sources
Medical