. 2024 Oct 2;10(11):2036-2047.
doi: 10.1021/acscentsci.4c00937. eCollection 2024 Nov 27.

A Glucose-Responsive Glucagon-Micelle for the Prevention of Hypoglycemia

Affiliations

A Glucose-Responsive Glucagon-Micelle for the Prevention of Hypoglycemia

Daniele Vinciguerra et al. ACS Cent Sci. .

Abstract

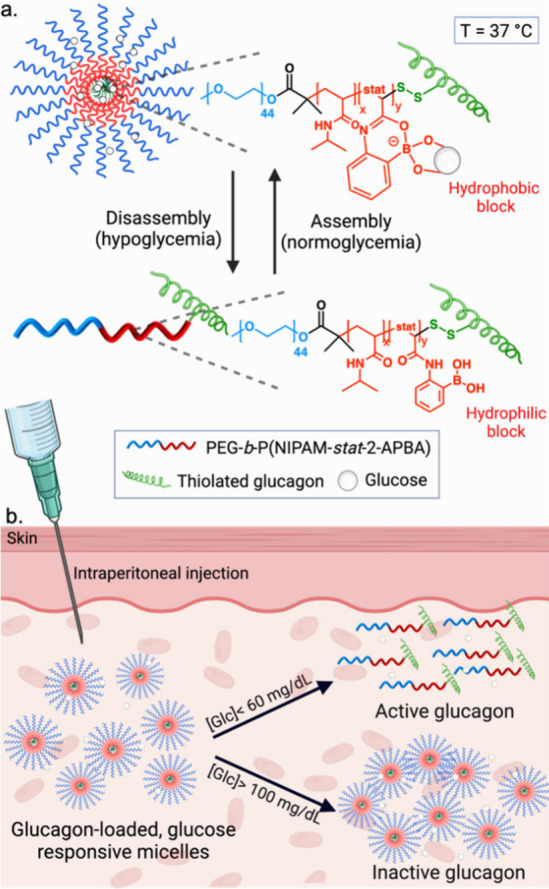
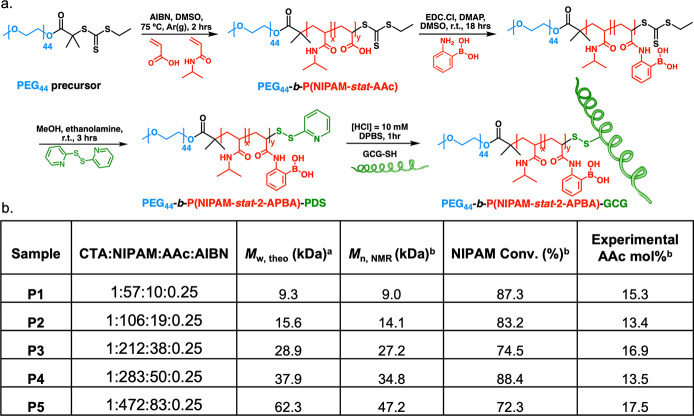
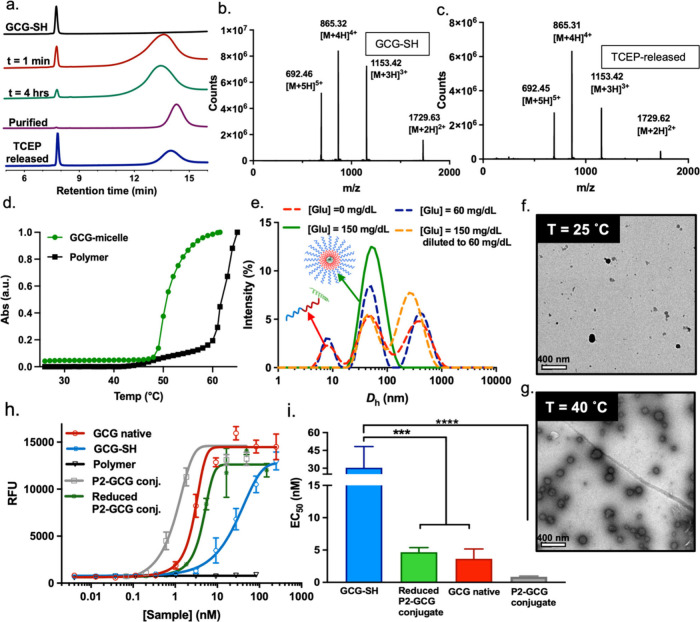
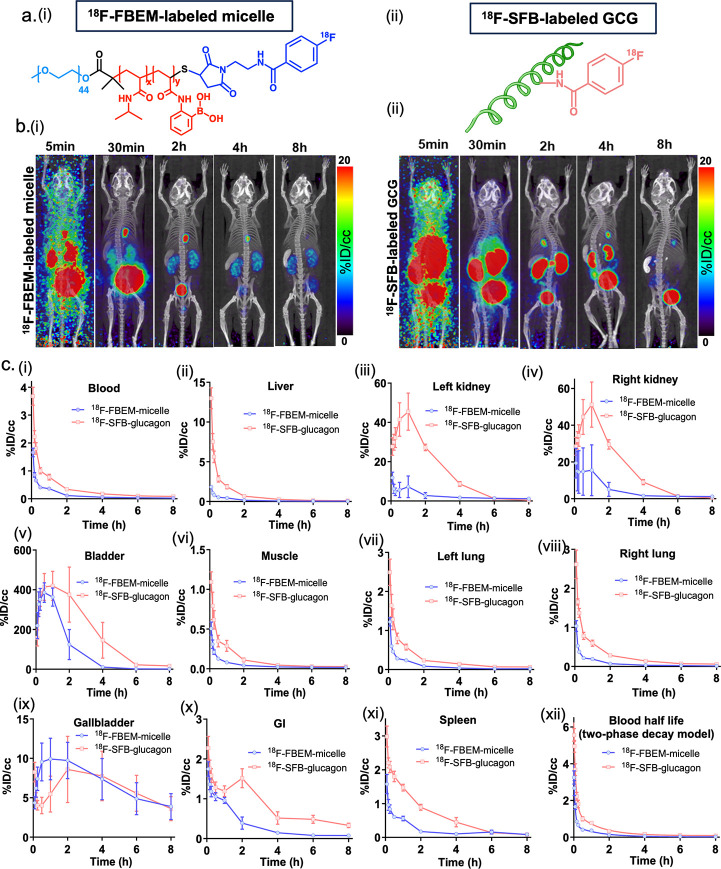
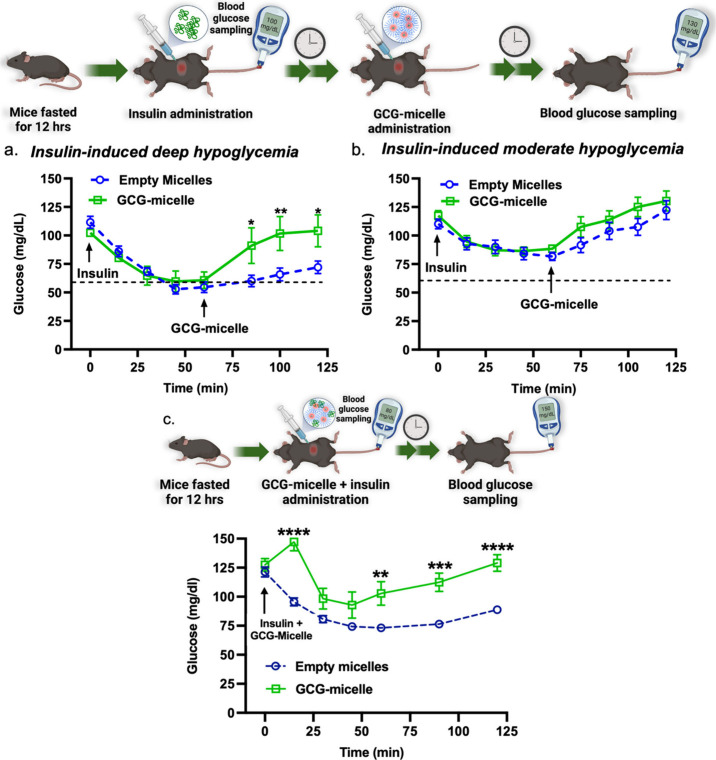
While glucose-responsive insulin delivery systems are in widespread clinical use to treat insulin insufficiency, the on-demand supplementation of glucagon for acute hypoglycemia treatment remains understudied. A self-regulated glucagon release material is highly desired to mitigate the potential risks of severe insulin-induced hypoglycemia. Here, we describe a glucose-responsive polymeric nanosystem with glucagon covalently grafted to the end-group. Under normoglycemic conditions, phenylboronic acid units in the polymer chain reversibly bind glucose, triggering self-assembly of the conjugate into micelles. During hypoglycemia, however, the micelle disassembles into its original, unimeric state, revealing the active glucagon conjugate. The formulation showed a 5-fold increase in activity compared to native glucagon when tested in vitro. Glucagon-loaded micelles injected into mice prevented or reversed deep hypoglycemia when administered prior to or during an insulin challenge. Glucagon release was only observed at or below the counterregulatory threshold and not during normoglycemia or moderate hypoglycemia. The in vivo acute and chronic toxicity analysis, along with μPET/μCT imaging, established the biosafety profile of this formulation and demonstrated no organ accumulation. This proof-of-concept work is the first step toward development of a translational, stimuli-responsive glucagon delivery platform to control glycemia.


Conflict of interest statement

The authors declare no competing financial interest.

Figures

Scheme 1
Scheme 1. Schematic of Glucagon-Polymer Conjugate
Mode of action overview of PEG-b-P(NIPAM-stat-2-APBA)-GCG between micellar form in normoglycemic conditions and linear (unimer) format in hypoglycemic conditions. (a) Glucose-responsive self-assembly and disassembly of PEG-b-P(NIPAM-stat-2-APBA)-GCG conjugate. Binding of glucose with the PBA group increases the hydrophobicity of the P(NIPAM-stat-2-APBA) block so that at 37 °C the polymer forms micelles. When glucose levels are lowered, the P(NIPAM-stat-2-APBA) core becomes more hydrophilic, and the micelle disassembles. (b) Exposure to normoglycemic conditions ([Glc] > 100 mg/dL), GCG micelles retain their nanoparticle format. Under exposure to deep hypoglycemia ([Glc] < 60 mg/dL), GCG-micelles disassemble promoting the release of GCG and subsequent increase of blood glucose concentration.
Figure 1
Figure 1
(a) Synthetic route of PEG-b-P(NIPAM-stat-2-APBA)-GCG (P2-GCG) conjugate (AIBN = 2,2′-azobis(2-methylpropionitrile), DMSO = dimethyl sulfoxide, EDC = N-3-dimethylaminopropyl)-N′-ethylcarbodiimide hydrochloride, DMAP = 4-(dimethylamino)pyridine, MeOH = methanol, HCl = hydrochloric acid). (b) Block copolymer characteristics of the PEG-b-P(NIPAM-stat-AAc) library. aDetermined assuming 100% chain extension efficiency. bDetermined by 1H NMR analysis in DMSO-d6.
Figure 2
Figure 2
(a) GCG-SH conjugation to PEG-b-P(NIPAM-stat-2-APBA)-PDS monitored by HPLC at λ = 224 nm. (b) LC-MS mass spectra of fresh GCG-SH and (c) GCG-SH released from the conjugate with TCEP (10 mM). (d) Normalized cloud point (10 mg/mL) of block copolymer candidate (P2) before and after GCG-conjugation measured by UV–vis spectroscopy between 25 and 65 °C by determining absorbance at λ = 600 nm. (e) Intensity-weighted size distributions obtained by DLS for GCG-micelles at 37 °C showing micelle formation at normoglycemia and their disruption when the media is diluted to hypoglycemic level. [Glc] = 0 (red curve), 60 (purple curve), 150 (green curve), and 60 mg/dL upon dilution (orange curve). (f) TEM image of GCG-micelle at 25 °C, presenting no micelles and (g) at 40 °C, presenting defined micelles. (h) Dose response curves of native GCG (red), GCG-SH (blue), P2 Polymer (black), P2-GCG conjugate (gray), and TCEP reduced P2-GCG conjugate (green) using commercial kit cAMP Hunter eXpress GCGR CHO-K1 GPCR assay. (i) EC50 values of native GCG (red), GCG-SH (blue), P2-GCG linear conjugate (gray), and TCEP reduced P2-GCG in the linear form (green) using commercial kit cAMP Hunter eXpress GCGR CHO-K1 GPCR assay. Data are shown as the mean ± SEM of five to six independent repeats. p < 0.001 (***), p < 0.0001 (****).
Figure 3
Figure 3
μPET-μCT imaging showing the time course biodistribution and excretion of 18F-FBEM-labeled-micelle and 18F-SFB-labeled GCG (n = 4). (a) Chemical structure of (i) 18F-FBEM-labeled micelle and (ii) 18F-SFB-labeled GCG. (b) PET-CT images of (i) 18F-FBEM-labeled micelle and (ii) 18F-SFB-labeled GCG. (c) The time course biodistribution in blood, liver, left kidney, right kidney, bladder, muscle, left lung, right lung, gall bladder, gastrointestine (GI), spleen, and blood half-life time. ID, injected dose. CC, cubic centimeters.
Figure 4
Figure 4
Micelle-reversal of insulin-induced deep (a) or moderate (b) hypoglycemia in fasted C57Bl/6J mice. The dotted line represents the approximate gluco-counterregulatory threshold. (c) Micelle-induced prevention of insulin-stimulated hypoglycemia in fasted C57Bl/6J mice. Data are represented as mean ± SEM, n = 5–6. p < 0.05 (*), p < 0.01 (**), p < 0.001 (***), p < 0.0001 (****). Statistical comparison of glucose levels between the two groups at the same time point during the ITT.

Similar articles

References

    1. Brawerman G.; Ntranos V.; Thompson P. J. Alpha Cell Dysfunction in Type 1 Diabetes Is Independent of a Senescence Program. Front Endocrinol (Lausanne) 2022, 13, 13.10.3389/fendo.2022.932516. - DOI - PMC - PubMed
    1. Weir G. C.; Gaglia J.; Bonner-Weir S. Inadequate β-Cell Mass Is Essential for the Pathogenesis of Type 2 Diabetes. Lancet Diabetes Endocrinol 2020, 8 (3), 249–256. 10.1016/S2213-8587(20)30022-X. - DOI - PMC - PubMed
    1. Reusch J. E. B.; Manson J. E. Management of Type 2 Diabetes in 2017: Getting to Goal. JAMA 2017, 317 (10), 1015–1016. 10.1001/jama.2017.0241. - DOI - PMC - PubMed
    1. Veiseh O.; Tang B. C.; Whitehead K. A.; Anderson D. G.; Langer R. Managing Diabetes with Nanomedicine: Challenges and Opportunities. Nat. Rev. Drug Discov 2015, 14 (1), 45–57. 10.1038/nrd4477. - DOI - PMC - PubMed
    1. Ong K. L.; Stafford L. K.; Vos T.; et al. Global, Regional, and National Burden of Diabetes from 1990 to 2021, with Projections of Prevalence to 2050: A Systematic Analysis for the Global Burden of Disease Study 2021. Lancet 2023, 402 (10397), 203–234. 10.1016/S0140-6736(23)01301-6. - DOI - PMC - PubMed