

Hemostatic conditions following autologous transfusion of fresh vs stored platelets in experimental endotoxemia: an open-label randomized controlled trial with healthy volunteers
- PMID: 39634321
- PMCID: PMC11616504
- DOI: 10.1016/j.rpth.2024.102612
Hemostatic conditions following autologous transfusion of fresh vs stored platelets in experimental endotoxemia: an open-label randomized controlled trial with healthy volunteers
Abstract
Background: Platelet increment is reportedly lower for maximum stored platelet concentrates (PCs) and during pyrexia, and in vitro function differs between fresh and stored PCs. However, little is known about the function of fresh and stored platelets during inflammation.
Objectives: The aim was to study differences in hemostatic function after transfusion of fresh or stored PCs in a human model of experimental endotoxemia.
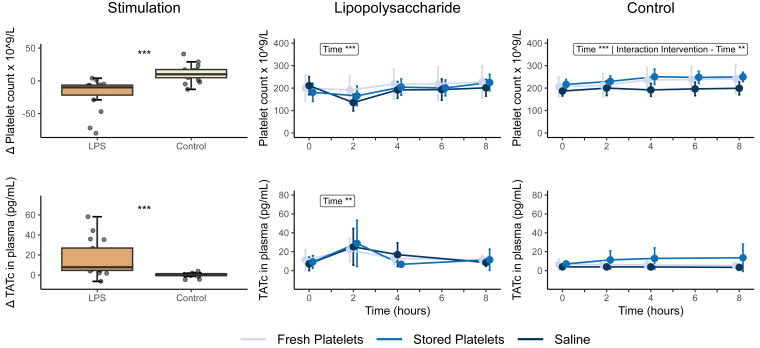
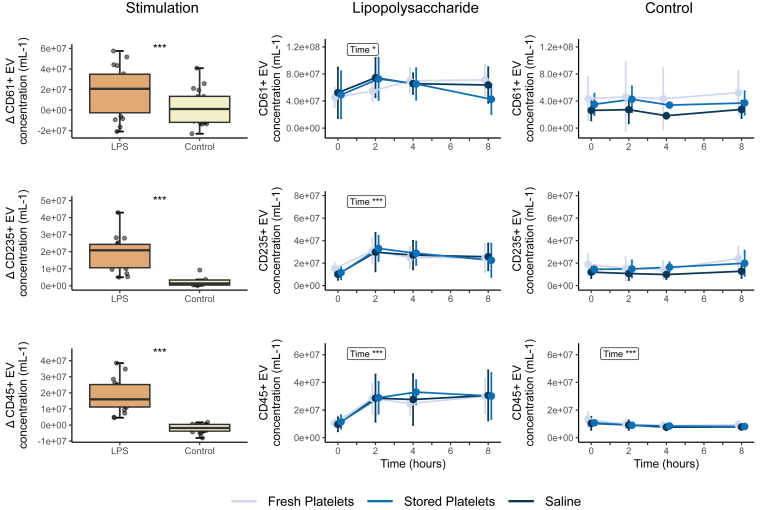
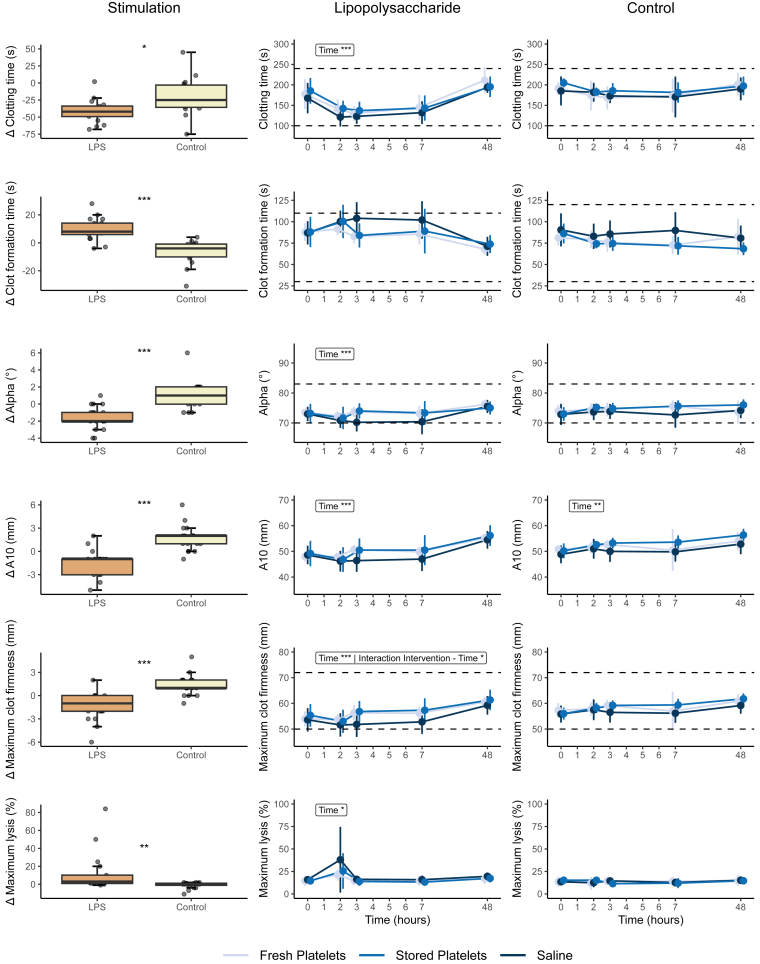
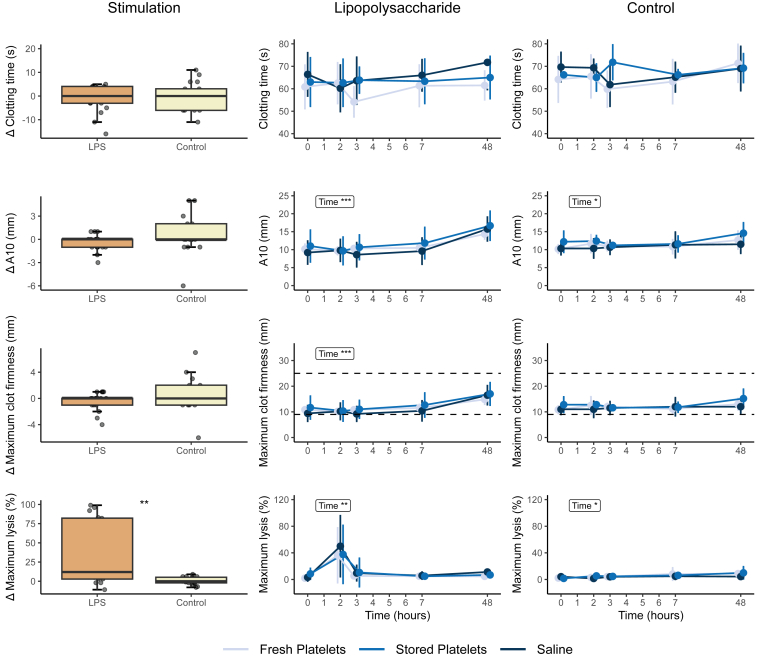
Methods: Thirty-six healthy male subjects received either 2 ng/kg lipopolysaccharide (LPS) or a control (physiological saline 0.9%) and were randomly assigned to subsequently receive an autologous transfusion of either fresh (2-days-old) or stored (7-days-old) platelets, or saline control. Extracellular vesicles (EVs) were determined using flow cytometry, thrombin-antithrombin complex (TATc) was assessed using enzyme-linked immunosorbent assay, and hemostatic function was assessed using rotational thromboelastometry (ROTEM).
Results: LPS infusion caused a marked increase in TATc, EVs and fibrinolysis. Thromboelastometry data revealed that following infusion of LPS, subjects exhibited in general a hypocoagulable state compared with those not receiving LPS. Platelet transfusions led to a reduced clotting time and an augmentation in clot strength, indicated by maximum clot firmness, solely among subjects undergoing endotoxemia. There were no significant differences in TATc or amount of EVs release after transfusion of fresh or stored platelets.
Conclusion: A significant increase in TATc and EVs as well as a difference in hemostatic function after endotoxemia were observed. During endotoxemia, platelet transfusion resulted in enhanced coagulation and hemostatic function; however, no substantial differences were observed between transfusion of fresh or stored PCs.
Keywords: endotoxemia; hemostasis; platelet; platelet transfusion; thromboelastography.
© 2024 The Authors.
Figures

Similar articles
-
Transfusion of autologous extracellular vesicles from stored red blood cells does not affect coagulation in a model of human endotoxemia.Transfusion. 2018 Jun;58(6):1486-1493. doi: 10.1111/trf.14607. Epub 2018 Mar 25. Transfusion. 2018. PMID: 29577324 Clinical Trial.
-
Evaluation of platelet function using the in vitro bleeding time and corrected count increment of transfused platelets. Comparison between platelet concentrates derived from pooled buffy coates and apheresis.Vox Sang. 1996;70(2):69-75. doi: 10.1111/j.1423-0410.1996.tb01296.x. Vox Sang. 1996. PMID: 8801766
-
In vitro thromboelastometric evaluation of the efficacy of frozen platelet transfusion.Thromb Res. 2015 Aug;136(2):348-53. doi: 10.1016/j.thromres.2015.05.031. Epub 2015 Jun 2. Thromb Res. 2015. PMID: 26058942 Clinical Trial.
-
Cold stored platelets in the management of bleeding: is it about bioenergetics?Platelets. 2023 Dec;34(1):2188969. doi: 10.1080/09537104.2023.2188969. Platelets. 2023. PMID: 36922733 Review.
-
Viscoelastic Testing Prior to Non-surgical Procedures Reduces Blood Product Use Without Increasing Bleeding Risk in Cirrhosis.Dig Dis Sci. 2022 Nov;67(11):5290-5299. doi: 10.1007/s10620-021-07376-6. Epub 2022 Feb 5. Dig Dis Sci. 2022. PMID: 35122595 Free PMC article.
References
-
- Yuan S., Otrock Z.K. Platelet transfusion: an update on indications and guidelines. Clin Lab Med. 2021;41:621–634. - PubMed
-
- Stanworth S.J., Shah A. How I use platelet transfusions. Blood. 2022;140:1925–1936. - PubMed
-
- Davis K.B., Slichter S.J., Corash L. Corrected count increment and percent platelet recovery as measures of posttransfusion platelet response: problems and a solution. Transfusion. 1999;39:586–592. - PubMed
-
- Jaime-Pérez J.C., Vázquez-Hernández K.E., Jiménez-Castillo R.A., Fernández L.T., Salazar-Riojas R., Gómez-Almaguer D. Platelet survival in hematology patients assessed by the corrected count increment and other formulas. Am J Clin Pathol. 2018;150:267–272. - PubMed
LinkOut - more resources
Full Text Sources
