. 2024 Nov 15:33:100694.
doi: 10.1016/j.ynstr.2024.100694. eCollection 2024 Nov.

Acute stress activates basolateral amygdala neurons expressing corticotropin-releasing hormone receptor type 1 (CRHR1): Topographical distribution and projection-specific activation in male and female rats

Affiliations

Acute stress activates basolateral amygdala neurons expressing corticotropin-releasing hormone receptor type 1 (CRHR1): Topographical distribution and projection-specific activation in male and female rats

Robert J Aukema et al. Neurobiol Stress. .

Abstract

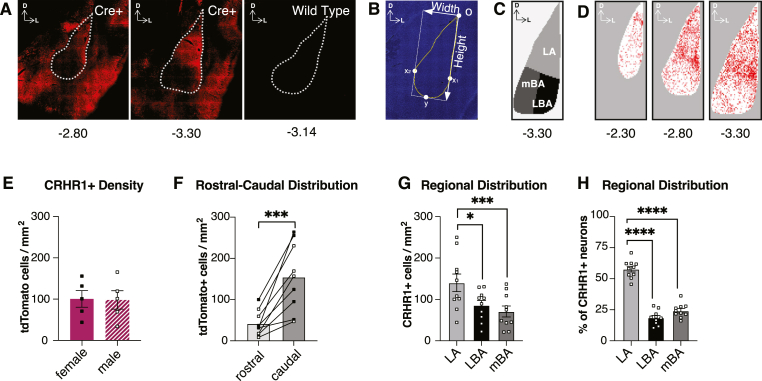
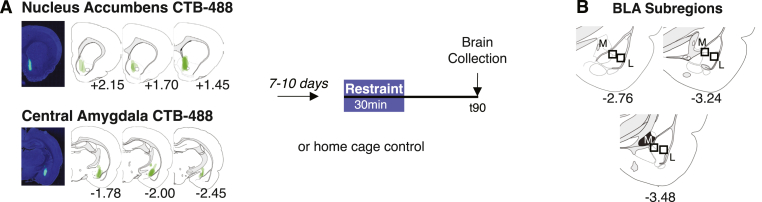
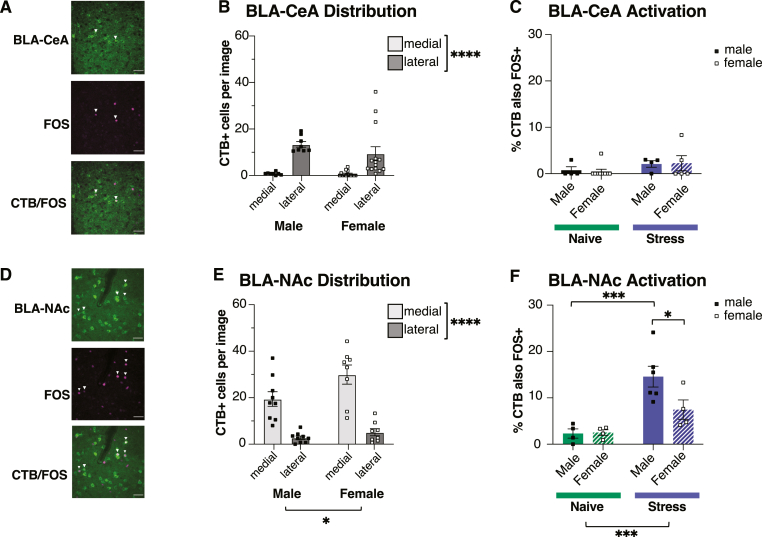
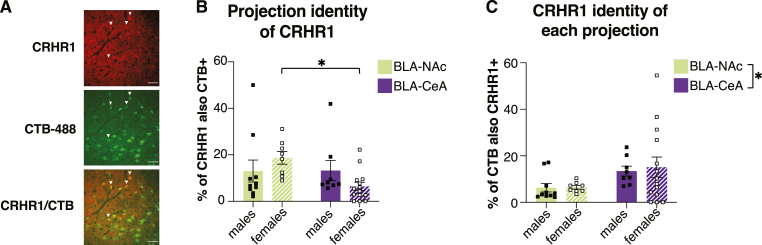
Although the basolateral amygdala (BLA) and corticotropin releasing hormone receptor type I (CRHR1) signaling are both central to the stress response, the spatial and circuit-specific distribution of CRHR1 have not been identified in the BLA at a high resolution. We used transgenic male and female CRHR1-Cre-tdTomato rats to topographically map the distribution of BLACRHR1 neurons and identify whether they are activated by acute stress. Additionally, we used the BLA circuits projecting to the central amygdala (CeA) and nucleus accumbens (NAc) as a model to test circuit-specific expression of CRHR1 in the BLA. We established several key findings. First, CRHR1 had the strongest expression in the lateral amygdala and in caudal portions of the BLA. Second, acute restraint stress increased FOS expression of CRHR1 neurons, and stress-induced activation was particularly strong in medial subregions of the BLA. Third, stress significantly increased FOS expression on BLA-NAc, but not BLA-CeA projectors, and BLA-NAc activation was more robust in males than females. Finally, CRHR1 was expressed on a subset of BLA-CeA and BLA-NAc projection neurons. Collectively, this expands our understanding of BLA molecular- and circuit-specific activation patterns following acute stress.


Conflict of interest statement

Authors have no conflicts of interests to report.

Figures

Fig. 1
Fig. 1
Topographical distribution of CRHR1 neurons in the basolateral amygdala. (A) Representative image of CRHR1-tdTomato expression following immunohistochemistry for RFP in transgenic CRHR1-tdtomato (left, middle) and wild type rats (right). Distance of coronal section from bregma; dashed lines delineate boundary of BLA. (B) Representative image of BLA depicting normalization procedure. Curved dashed line indicates boundary of BLA as determined by DAPI staining; ‘o’ indicates origin of reference frame; x1 indicates most lateral point of BLA; x2 indicates most medial point of the BLA; y indicates most ventral point of the BLA; white arrows indicate measured width and height of the BLA; (C) BLA subdivisions at AP -3.30 following normalization procedure: lateral amygdala (LA), lateral basal amygdala (LBA), and medial basal amygdala (mBA). (D) Heatmaps representing density of normalized CRHR1+ expression in 25um x 25um bins at AP -3.30. Darker colour represents higher density. (E) There were no significant differences in BLACRHR1 expression between males and females (t(8) = 0.08763, p = 0.9323; n = 5 per sex). (F) There was significantly greater CRHR1+ density in caudal sections of the BLA (t(8) = 5.164, p = 0.0009). Data includes both sexes (n = 4 males; n = 4 females). Rostral sections include AP -2.12, −2.30, −2.56; caudal sections include AP -3.14, −3.30, −3.60. (G) There was significantly greater CRHR1 density in the LA than other BLA subregions (F(1.642,14.78 = 16.19, p = 0.0003; Tukey's post-hoc comparisons indicate LA vs. LBA: p = 0.0158; LA vs. mBA: p = 0.0008). Data include both sexes (n = 5 males; n = 5 females). (H) There was a significantly greater proportion of total CRHR1+ cells in the LA than other subregions (F(1.777, 16) = 76.01, p < 0.0001; Tukey's post-hoc comparisons indicate LA vs. LBA: p < 0.0001; LA vs. mBA: p < 0.0001). Data include both sexes (n = 5 males; n = 5 females). Data in 1E were analyzed using an unpaired t-test; data in 1F were analyzed using a paired t-test; data in 1G-H were analyzed using a RM one-way ANOVA. CRHR1-tdTomato+ neurons were quantified across the entire BLA (AP -2.12 to AP -3.60) and normalized according to average BLA dimensions at each AP position and number of images. Error bands represent mean+/-SEM. ∗p < 0.05, ∗∗∗p < 0.001; ∗∗∗∗p < 0.0001. (For interpretation of the references to colour in this figure legend, the reader is referred to the Web version of this article.)
Fig. 2
Fig. 2
Stress robustly activates BLA neurons in the medial basal amygdala expressing CRHR1 (A) Experimental overview. Male and female CRHR1-tdTomato rats were injected with CTB-488 into either the nucleus accumbens (top) or central amygdala (bottom). 7–10 days later animals were exposed to 30min restraint stress (or home cage control) and perfused 90min later for imaging. Representative images depict area of maximal CTB-488 expression at the injection site. (B) Representative regions-of-interest where images were collected, according to the Swanson atlas (third edition; 2004); M = medial region; L = lateral region.
Fig. 3
Fig. 3
Stress robustly activates medial basal amygdala neurons expressing CRHR1 (A) There were no significant differences in density of CRHR1+ cells between sex (F(1,38) = 0.0015, p = 0.9698), BLA subregion (F(1,38) = 2.410, p = 0.1288), or an interaction of the two (F(1,38) = 0.0003, p = 0.9852). (B) There was significantly greater BLA FOS in animals exposed to stress (F(1,36) = 31.98, p < 0.0001) and in the medial region (F(1,36) = 48.40, p < 0.0001), but no main effect of sex (F(1,36) = 0.1075, p = 0.7449). There was also a significant interaction between condition and BLA subregion (F(1,36) = 14.55, p = 0.0005), with significantly greater FOS expression in the stress condition in the medial region in both males (p < 0.0001) and females (p = 0.0017) compared to the lateral region. (C) Representative mBA image of CRHR1-tdTomato fluorescence (top), FOS (middle), or colocalization of tdTomato and FOS (bottom). White arrows indicate colocalized cells. Scale bar, 50um. (D) Stress significantly increased the percentage of CRHR1+ cells expressing FOS (F(1,36) = 6.980, p = 0.0121). There was also a significantly greater percentage of CRHR1+/FOS+ in the medial region (F(1,36) = 1.822, p = 0.0069). There was no main effect of sex (F(1,36) = 0.3155, p = 0.5778) and no significant interactions. Data in 2A were analyzed using a 2Way RM ANOVA; data in 2B and D were analyzed using a three-way ANOVA with data matched by subregion (naive: n = 8 males, 13 females; stress: n = 10 males, 9 females). Error bands represent mean+/-SEM. ∗p < 0.05, ∗∗p < 0.01, ∗∗∗p < 0.001, ∗∗∗∗p < 0.0001.
Fig. 4
Fig. 4
BLA projection populations are anatomically distinct and differentially activated by stress (A) Representative image of CTB-488 (top), FOS (middle), or colocalization of CTB-488 and FOS (bottom) following CTB injection into the CeA. White arrows indicate colocalized cells. Scale bar, 50um. (B) There were significantly more CeA projectors in the lateral than the medial region (F(1,20) = 34.28, p < 0.0001). There were no significant differences between sex (F(1,20) = 0.8446, p = 0.3690) and no interaction (F(1,20) = 1.142, p = 0.2980). (C) There were no significant differences between stress condition (F(1,18) = 2.629, p = 0.1223) or sex (F(1,18) = 0.0035, p = 0.9536) in percentage of BLA-CeA projectors also expressing FOS, and no interaction (F(1,18) = 0.04602, p = 0.8325). Data were analyzed from both lateral and medial BLA subregions. (D) Representative mBA image of CTB-488 (top), FOS (middle), or colocalization of CTB-488 and FOS (bottom) following CTB injection into the NAc. White arrows indicate colocalized cells. Scale bar, 50um. (E) There were significantly more NAc projectors in the medial than the lateral region (F(1,15) = 78.59, p < 0.0001) and in females compared to males (F(1,15) = 4.648, p = 0.0477). There was no significant interaction between sex and region (F(1,15) = 3.041, p = 0.1016) (F) There were significantly more BLA-NAc projectors that also expressed FOS in the stress condition (F(1,14) = 20.54, p = 0.0005). There was no significant effect of sex (F(1,14) = 3.332, p = 0.0894). There was a trending interaction between sex and region (F(1,14) = 3.749, p = 0.0733), and Fisher's LSD revealed significantly greater colocalization in males vs females in the stress condition (p = 0.0145). Data were analyzed from both the lateral and medial BLA subregions. Cells were quantified from images collected in the right hemisphere only. Data were analyzed using a 2Way ANOVA for both BLA-CeA (naïve: n = 4 males, 9 females; stress: n = 4 males, 5 females) and BLA-NAc (naïve: n = 4 males, 4 females; stress: n = 5 males, 4 females). Error bands represent mean+/-SEM. ∗p < 0.05, ∗∗p < 0.01, ∗∗∗p < 0.001, ∗∗∗∗p < 0.0001.
Fig. 5
Fig. 5
CRHR1 is expressed proportionally more on CeA projectors than NAc projectors (A) Representative mBA image of CRHR1 (top), CTB-488 (middle), or colocalization of CTB-488 and CRHR1 (bottom). White arrows indicate colocalized cells. Scale bar, 50um. (B) There were no main effects on proportion of CRHR1+ cells also expressing CTB by sex (F(1,36) = 0.0272, p = 0.8699) or projection (F(1,36) = 3.056, p = 0.0890), although there was a trending between the two (F(1,36) = 3.308, p = 0.0773). Fisher's LSD revealed that there were significantly more CRHR1 cells that projected to the NAc than the CeA in females only (p = 0.0130). (C) There was a significantly greater percentage of BLA-CeA projectors that expressed CRHR1 than BLA-NAc projectors (F(1,36) = 5.197, p = 0.0287). There were no main effects of sex (F(1,36) = 0.0739, p = 0.7872) or an interaction between the two (F(1,36) = 0.0466, p = 0.8302). Data were analyzed using a 2Way ANOVA for both BLA-NAc (n = 10 males, 8 females) and BLA-CeA (n = 8 males, 14 females). Error bands represent mean+/-SEM. ∗p < 0.05, ∗∗p < 0.01, ∗∗∗p < 0.001, ∗∗∗∗p < 0.0001.

Similar articles

References

    1. Agoglia A.E., Zhu M., Ying R., Sidhu H., Natividad L.A., Wolfe S.A., Buczynski M.W., Contet C., Parsons L.H., Roberto M., Herman M.A. Corticotropin-releasing factor receptor-1 neurons in the lateral amygdala display selective sensitivity to acute and chronic ethanol exposure. Eneuro. 2020;7(2) doi: 10.1523/ENEURO.0420-19.2020. ENEURO.0420-19.2020. - DOI - PMC - PubMed
    1. Albrechet-Souza L., Schratz C.L., Gilpin N.W. Sex differences in traumatic stress reactivity in rats with and without a history of alcohol drinking. Biol. Sex Differ. 2020;11(1):27. doi: 10.1186/s13293-020-00303-w. - DOI - PMC - PubMed
    1. Allen H.N., Bobnar H.J., Kolber B.J. Left and right hemispheric lateralization of the amygdala in pain. Prog. Neurobiol. 2021;196 doi: 10.1016/j.pneurobio.2020.101891. - DOI - PMC - PubMed
    1. Atsak P., Hauer D., Campolongo P., Schelling G., Fornari R.V., Roozendaal B. Endocannabinoid signaling within the basolateral amygdala integrates multiple stress hormone effects on memory consolidation. Neuropsychopharmacology: Off. Publ. Am. Coll. Neuropsychopharmacol. 2015;40(6):1485–1494. doi: 10.1038/npp.2014.334. - DOI - PMC - PubMed
    1. Aukema R.J., Petrie G.N., Matarasso A.K., Baglot S.L., Molina L.A., Füzesi T., Kadhim S., Nastase A.S., Rodriguez Reyes I., Bains J.S., Morena M., Bruchas M.R., Hill M.N. Identification of a stress-responsive subregion of the basolateral amygdala in male rats. Neuropsychopharmacology: Off. Publ. Am. Coll. Neuropsychopharmacol. 2024 doi: 10.1038/s41386-024-01927-x. - DOI - PMC - PubMed

LinkOut - more resources