. 2024 Nov 8;27(12):111352.
doi: 10.1016/j.isci.2024.111352. eCollection 2024 Dec 20.

Evidences from gut microbiome and habitat landscape indicate continued threat of extinction for the Hainan gibbon

Affiliations

Evidences from gut microbiome and habitat landscape indicate continued threat of extinction for the Hainan gibbon

Guangping Huang et al. iScience. .

Abstract

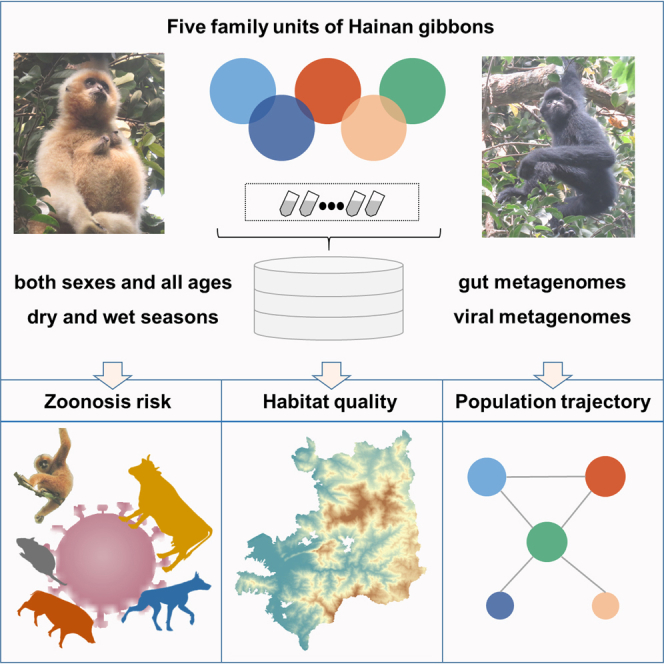
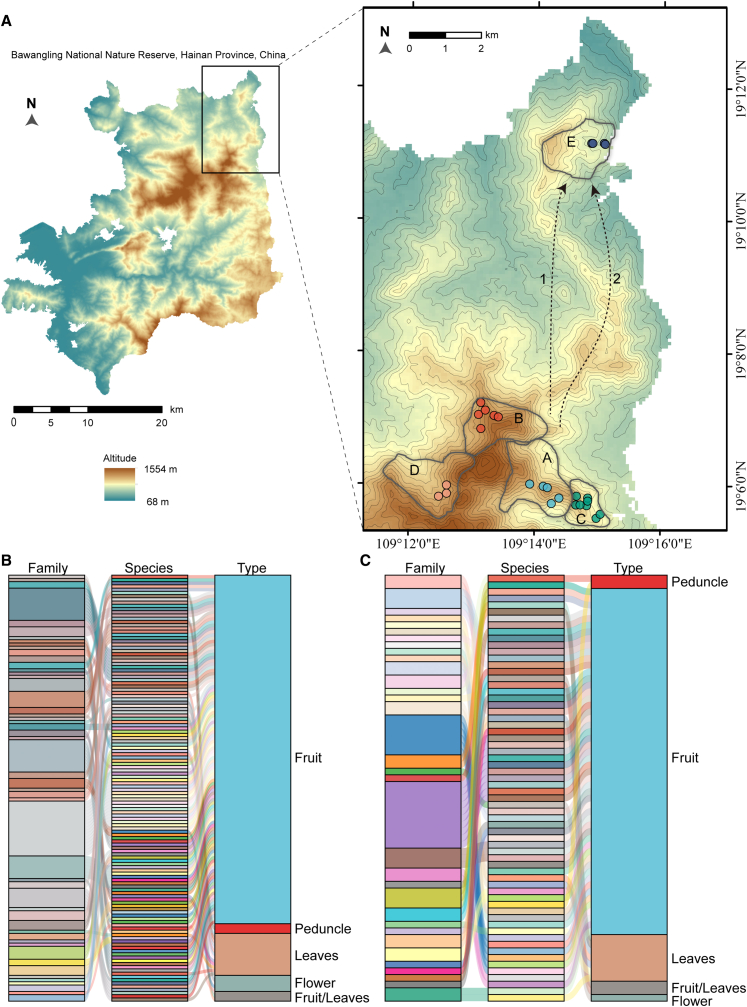
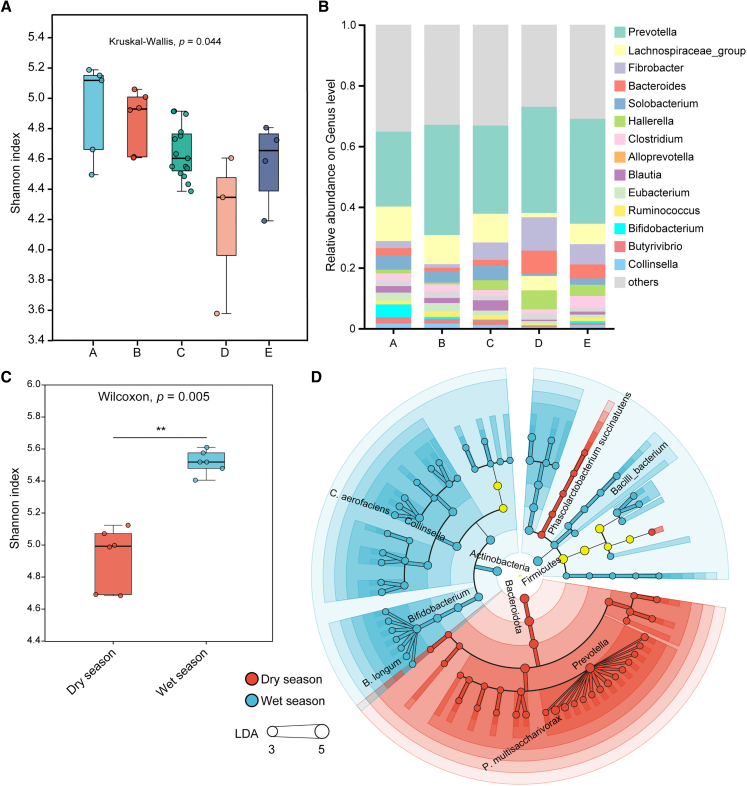
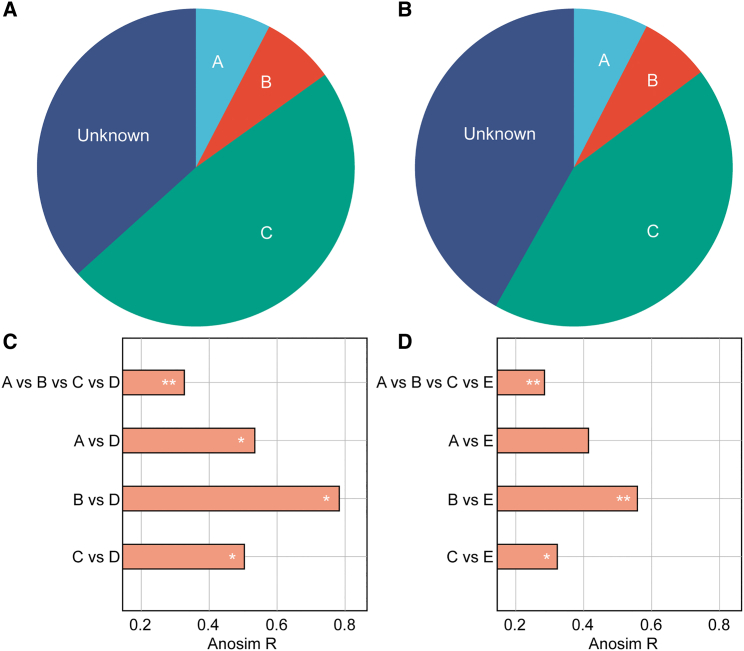
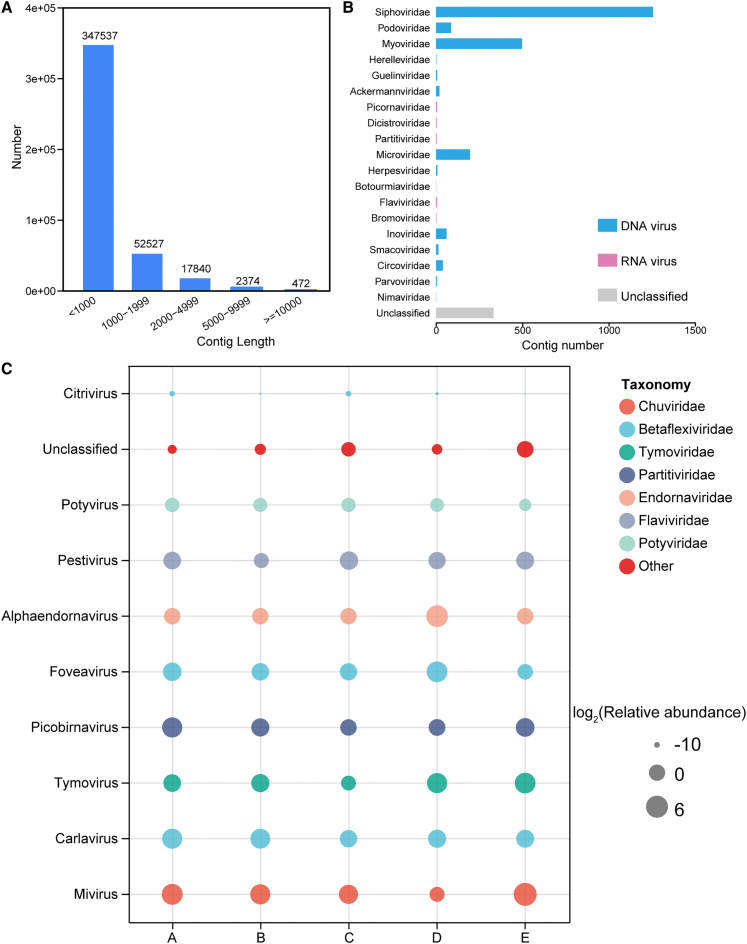
Little is known about the population health status of the world's rarest primate, the Hainan gibbon. Here, the largest gut microbiome dataset yet constructed was generated from all five extant breeding groups of the Hainan gibbons, with 42 samples from individuals spanning all ages and sexes, in addition to dry and wet seasons. Groups A and B exhibited higher diversity of gut microbiota and food resources, in contrast to the subsequently established Groups C, D, and E. Significantly, Group C demonstrated the lowest gut microbial diversity and higher abundance of vector-related Pestivirus, which may be attributed to their proximity to the primary forest edge and the village. We also inferred the origin and possible dispersal paths of the newly established Group E. These findings indicate that Hainan gibbons are still facing viral zoonosis and the threat of extinction, as illuminated by an understanding of the gut microbiome and habitat landscape ecology.

Keywords: Ecology; Nature conservation; Zoology.


Conflict of interest statement

The authors declare no competing interests.

Figures

None
Graphical abstract
Figure 1
Figure 1
Spatial location and food source composition of Hainan gibbon (A) Locations of the five groups. The home range of each group is indicated by a solid black line, while the two dispersal paths of Group E are represented by black dotted lines. Composition analysis of food resources for all Hainan gibbons (B) and just the C group (C). Data in B and C are represented as mean.
Figure 2
Figure 2
Variation and seasonal shifts in gut microbiome diversity and compositions among the five extant breeding groups of Hainan gibbons (A) Species richness of gut microbiota. (B) Bar plot showing Hainan gibbon gut microbiota compositional assemblage at the genus level. Data are represented as mean. (C) Shannon index values for gut microbial communities from both seasons. Data in A and C boxplots show the first (lower) quartile, median, and third (upper) quartile, and whiskers indicate the error range which is 1.5 times the interquartile range. FDR corrected Kruskal–Wallis test (A) and Wilcoxon rank-sum test (C) were determined significant. ∗∗p < 0.001. (D) LDA Effect Size analysis cladogram shows the seasonal variation of Hainan gibbon gut microbiomes. The red and green nodes indicate dominant gut bacterial taxa in the dry and wet seasons, respectively.
Figure 3
Figure 3
Source tracking and inter-group differences of gut microbiomes among the five groups The proportional estimates of the microbial communities from other cohorts in the D (A) and E (B) breeding groups. Inter-group analyses are also shown for the D (C) and E (D) groups compared with the original groups, respectively.
Figure 4
Figure 4
Virome composition of Hainan gibbon microbiomes (A) Histograms showing the average assembled contig lengths for viral populations. (B) Numbers of contigs identified for each known viral family. Data are represented as mean. (C) The 10 most abundant genera of RNA viruses. Viral abundance was represented by calculating RPKM.

Similar articles

References

    1. Hu Y., Wang X., Xu Y., Yang H., Tong Z., Tian R., Xu S., Yu L., Guo Y., Shi P., et al. Molecular mechanisms of adaptive evolution in wild animals and plants. Sci. China Life Sci. 2023;66:453–495. doi: 10.1007/s11427-022-2233-x. - DOI - PMC - PubMed
    1. Liu H., Ma H., Cheyne S.M., Turvey S.T. Recovery hopes for the world’s rarest primate. Science. 2020;368:1074. doi: 10.1126/science.abc1402. - DOI - PubMed
    1. Soulé M.E. Oxford University Press; 1986. Conservation Biology: The Science of Scarcity and Diversity. Incorporated.
    1. Fagan W.F., Holmes E.E. Quantifying the extinction vortex. Ecol. Lett. 2006;9:51–60. doi: 10.1111/j.1461-0248.2005.00845.x. - DOI - PubMed
    1. Nabutanyi P., Wittmann M.J. Models for eco-evolutionary extinction vortices under balancing selection. Am. Nat. 2021;197:336–350. doi: 10.1086/712805. - DOI - PubMed

LinkOut - more resources