. 2024 Oct 24;27(12):111246.
doi: 10.1016/j.isci.2024.111246. eCollection 2024 Dec 20.

Mesenchymal GDNF promotes intestinal enterochromaffin cell differentiation

Affiliations

Mesenchymal GDNF promotes intestinal enterochromaffin cell differentiation

Toni T Lemmetyinen et al. iScience. .

Abstract

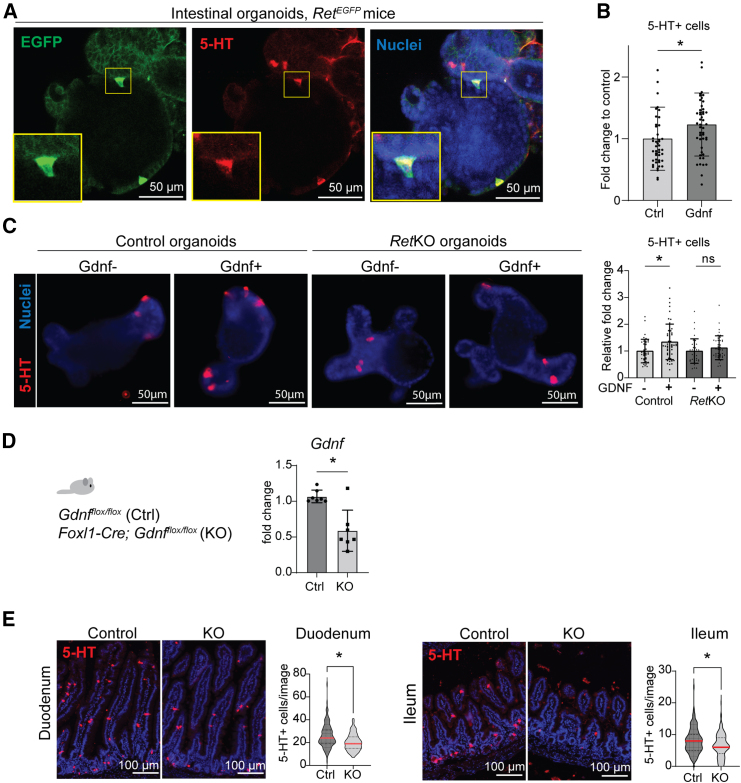
Enteroendocrine cells (EECs) differentiate and mature to form functionally distinct populations upon migration along the intestinal crypt-villus axis, but how niche signals affect this process is poorly understood. Here, we identify expression of Glial cell line-derived neurotrophic factor (GDNF) in the intestinal subepithelial myofibroblasts (SEMFs), while the GDNF receptor RET was expressed in a subset of EECs, suggesting GDNF-mediated regulation. Indeed, GDNF-RET signaling induced increased expression of EEC genes including Tph1, encoding for the rate-limiting enzyme for 5-hydroxytryptamine (5-HT, serotonin) biosynthesis, and increased the frequency of 5-HT+ enterochromaffin cells (ECs) in mouse organoid culture experiments and in vivo. Moreover, expression of the 5-HT receptor Htr4 was enriched in Lgr5+ intestinal stem cells (ISCs) and 5-HT reduced the ISC clonogenicity. In summary, our results show that GDNF-RET signaling regulate EEC differentiation, and suggest 5-HT as a potential niche factor regulating Lgr5+ ISC activity, with potential implications in intestinal regeneration.

Keywords: Biological sciences; Molecular network; Molecular physiology.


Conflict of interest statement

The authors declare no competing interests.

Figures

None
Graphical abstract
Figure 1
Figure 1
GDNF is expressed in the Pdgfrahigh subepithelial myofibroblasts (A) Uniform manifold approximation and projection (UMAP) plots of Pdgfra+ intestinal fibroblast subsets (GEO: GSE130681). Expression patterns of indicated genes are shown. SEMF, subepithelial myofibroblasts. (B) UMAP (left) and dot plots (right) of a scRNA-seq dataset of colon mesenchymal cells (GEO: GSE142431). Markers used to identify fibroblast subpopulations (top dot plot) and mesenchyme cells subsets (bottom dot plot) are shown. Lymph.End, lymphatic endothelial cells; Vasc.End., vascular endothelial cells; Myof/SMC, myofibroblasts/smooth muscle cells; SEMF, subepithelial myofibroblast. (C) Lineage tracing of Gdnf-CreERT2;Rosa26R-tdTomato mice 10 days after tamoxifen delivery showing tdTomato (GDNF, red) and PDGFRA (green) expression in mouse jejunum. Yellow arrowheads mark the colocalization of tdTomato and PDGFRA. Scale bar: 100 µm and 50 μm for zoom-in images.
Figure 2
Figure 2
GDNF receptor RET is expressed in intestinal EECs (A) Immunofluorescence staining of EGFP (RET, green) and E-cadherin (magenta) in mouse jejunum. Scale bar: 50 μm. (B) UMAP plot of intestinal epithelial cell types (GEO: GSE92332). EC, enterochromaffin cells; EEC, enteroendocrine cells; SecrProg, secretory progenitors; EcProg, enterocyte progenitors; TA, transit-amplifying cells. (C) Expression patterns of indicated genes in the intestinal epithelial cell clusters. (D) Outline of the experiment (upper panel) and Principal component analysis (PCA) plot (bottom panel) of sorted Ret-EGFP+ cells (red dots) and non-EGFP cells (blue dots), n = 5 + 5 from 3 male mice. (E) Volcano plot of the differentially expressed genes in Ret-EGFP+ vs. non-EGFP cells. Blue and red dots represent significantly (p < 0.05) underrepresented (Log2FoldChange<−1) and enriched (Log2FoldChange>1) genes, respectively. EEC marker genes are highlighted. (F) Gene set enrichment analysis (GSEA) of the ranked gene list of Ret-EGFP+ cells compared to non-EGFP cells against intestinal epithelial cell type signatures. NES, normalized enrichment score. (G) Immunofluorescence staining of EGFP (RET, green) and Chromogranin-A (CHGA, red) in mouse jejunum. Scale bar: 50 μm for the left image and 10 µm for zoom-in images. (H) mRNA expression of Ret and Gfra1 expression in sorted Ret-EGFP+ vs. non-EGFP IECs (this study). Fold change to non-EGFP cells is shown. (I) mRNA expression of Ret and Gfra1 expression in sorted Chga-EGFP+ vs. non-EGFP IECs (GEO: GSE98794). FPKM, fragments per kilobase of transcript per million mapped reads. (J) GSEA analysis of sorted Ret-EGFP+ cell transcriptome against signatures identified in different phases of EEC maturation (GEO: GSE113561).
Figure 3
Figure 3
GDNF promotes EEC identity in intestinal organoids via RET (A) Outline of the RNA-seq experiment. (B) GSEA of the GDNF-induced transcriptome against the EEC signature gene set. (C) Schematic illustration of EEC lineage differentiation, including markers for each subtype. (D) Relative expression levels of indicated EEC markers in GDNF-treated organoids compared to control. Colored bars indicate adjusted p value <0.1; bar color refers to a representation of the EEC lineages as in C. (E) Relative expression levels of indicated EEC markers in sorted Ret-EGFP+ cells compared to non-EGFP intestinal epithelial cells, bar colors as in D indicate adjusted p value <0.1. (F) Relative expression level of indicated genes in control and Ret knock-out (KO) organoids with or without GDNF treatment. N = 3 repeats per treatment (∗p < 0.05, one-way ANOVA with Tukey’s post hoc test). Mean and standard deviation are shown.
Figure 4
Figure 4
GDNF mRNA levels correlate with EEC signatures in the human colon (A) Left image: Dot plot depicting Spearman correlation coefficient between GDNF RNA expression and enrichment score for indicated intestinal epithelial cell types from healthy colon samples (n = 51) from the Cancer Genome Atlas. Red dots: significant positive correlation; blue dots: significant negative correlation (p < 0.01). Right image: close-up of enterochromaffin cell (TAC1+) enrichment score between GDNF RNA expression from 51 healthy colon samples. (B) UMAP and feature plots of PDGFRA, FOXL1, and GDNF in human colon mesenchyme scRNA-seq dataset (GEO: GSE114374). (C) UMAP and dot plots of indicated genes in human IECs (GEO: GSE146799).
Figure 5
Figure 5
GDNF regulates the frequency of enterochromaffin cells in vitro and in vivo (A) Immunofluorescence staining of EGFP (RET) and 5-HT in RetEGFP mouse intestinal organoids. Zoom-in represents an example of co-localization. Scale bar: 50 μm. (B) Quantification of 5-HT+ cells in GDNF-treated organoids derived from WT male mice as compared to control organoids (Day 4). Relative fold change normalized to organoid size is shown, n = 46 control organoids and n = 48 GDNF-treated organoids were counted from 3 independent organoid cultures. Mean and standard deviation are shown. Asterisks indicate statistical significance (∗p < 0.05, two-tailed unpaired t test). (C) Representative images and quantification of 5HT + cells on control and RetKO organoids with or without GDNF treatment. Control n = 40, Control+GDNF n = 53, RetKO control n = 38, RetKO+GDNF n = 43. (∗p < 0.05, one-way ANOVA with Tukey’s post hoc test). Mean and standard deviation are shown. Scale bar: 50 μm. (D) Gdnf mRNA expression in intestinal tissues of Gdnfflox/flox (Ctrl, n = 7) and Foxl1-Cre;Gdnfflox/flox (KO, n = 7) mice. Mean and standard deviation are shown. Asterisks indicate statistical significance (∗p < 0.05, two-tailed unpaired t test). (E) Representative images and quantification of 5-HT positive cells in duodenum and ileum of control and KO mice. 5-HT positive cells in duodenum counted from at least 111 20× images derived from at least six individual mice. Duodenum: control, n = 148 images from n = 7 mice; KO, n = 111 images from n = 6 mice, p value=<0.0001. Ileum: 5-HT positive cells in ileum counted from at least 147 30× images control, n = 147 images; KO, n = 172 images from n = 7 mice, p value=<0.0001. Red line in the graph indicates the mean value and dashed lines indicate standard deviation. Asterisks indicate statistical significance (∗p < 0.05, two-tailed unpaired t test).
Figure 6
Figure 6
5-HT reduces Lgr5+ ISC clonogenicity via HTR4 (A) Expression levels of all 5-HT receptors in RNA-seq data from Lgr5+ and Lgr5- IECs (GEO: GSE99457). FPKM; Fragments Per Kilobase of transcript per Million mapped reads. (B) Relative expression of Lgr5 and Htr4 mRNAs in sorted Lgr5-EGFP+ and Lgr5-EGFP- IECs measured using qPCR. Each dot represents an individual mouse (n = 3), (∗p < 0.05, two-tailed unpaired t test). Mean and standard deviation are shown. (C) Outline of the experiment (left), representative images (middle), and quantification of control and 5-HT-treated organoids (right). A representative of n = 4 experiments is shown; at least 3 technical replicates were analyzed per experiment. Asterisks indicate statistical significance (∗p < 0.05, one-way ANOVA with Tukey’s post hoc test). Mean and standard deviation are shown. Scale bars: 200 μm. (D) Outline of the experiment (left), representative images (middle), and quantification of Tegaserod-treated (1 μM) organoid formation compared to control organoids (∗p < 0.05, two-tailed unpaired t-test), n = 3 experiments with 3 replicate wells. Mean and standard deviation are shown. Scale bars: 200 μm. (E) Representative images of single Lgr5+ cells grown for 6 days in indicated conditions. GR, GR113808 (1 μM), 5-HT (2 μM). Quantification of the organoid formation was done using the organoid classifier tool Tellu.n = 3 experiments with 3 replicate wells, except GR+5HT 1μM condition with n = 2 independent experiments. Asterisks indicate statistical significance (∗p < 0.05, one-way ANOVA with Tukey’s post hoc test). Mean and standard deviation are shown. Scale bars: 200 μm.

Similar articles

References

    1. Gehart H., Clevers H. Tales from the crypt: new insights into intestinal stem cells. Nat. Rev. Gastroenterol. Hepatol. 2019;16:19–34. doi: 10.1038/s41575-018-0081-y. - DOI - PubMed
    1. Sato T., Vries R.G., Snippert H.J., van de Wetering M., Barker N., Stange D.E., van Es J.H., Abo A., Kujala P., Peters P.J., Clevers H. Single Lgr5 stem cells build crypt-villus structures in vitro without a mesenchymal niche. Nature. 2009;459:262–265. doi: 10.1038/nature07935. - DOI - PubMed
    1. Barker N., van Es J.H., Kuipers J., Kujala P., van den Born M., Cozijnsen M., Haegebarth A., Korving J., Begthel H., Peters P.J., Clevers H. Identification of stem cells in small intestine and colon by marker gene Lgr5. Nature. 2007;449:1003–1007. doi: 10.1038/nature06196. - DOI - PubMed
    1. Janssen S., Depoortere I. Nutrient sensing in the gut: new roads to therapeutics? Trends Endocrinol. Metabol. 2013;24:92–100. doi: 10.1016/j.tem.2012.11.006. - DOI - PubMed
    1. Osinski C., Moret D., Clément K., Serradas P., Ribeiro A. Enteroendocrine System and Gut Barrier in Metabolic Disorders. Int. J. Mol. Sci. 2022;23 doi: 10.3390/ijms23073732. - DOI - PMC - PubMed