. 2024 Nov 1;27(12):111296.
doi: 10.1016/j.isci.2024.111296. eCollection 2024 Dec 20.

Clustering of TP53 variants into functional classes correlates with cancer risk and identifies different phenotypes of Li-Fraumeni syndrome

Affiliations

Clustering of TP53 variants into functional classes correlates with cancer risk and identifies different phenotypes of Li-Fraumeni syndrome

Emilie Montellier et al. iScience. .

Abstract

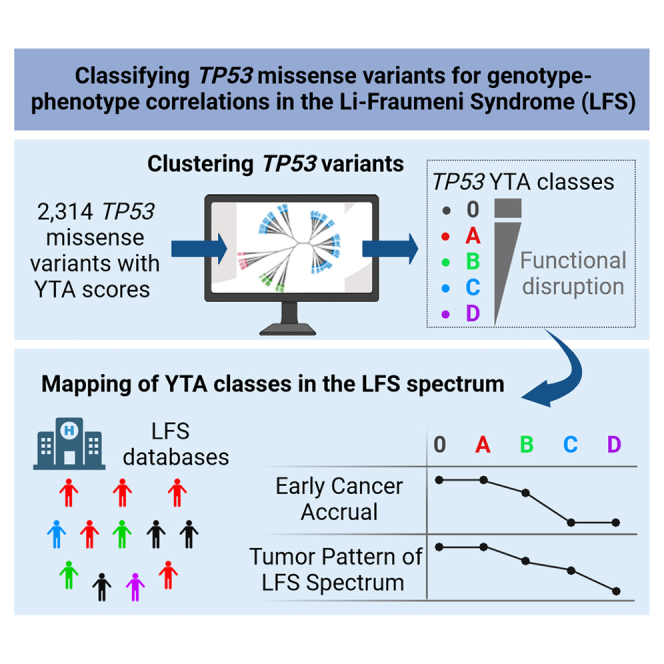
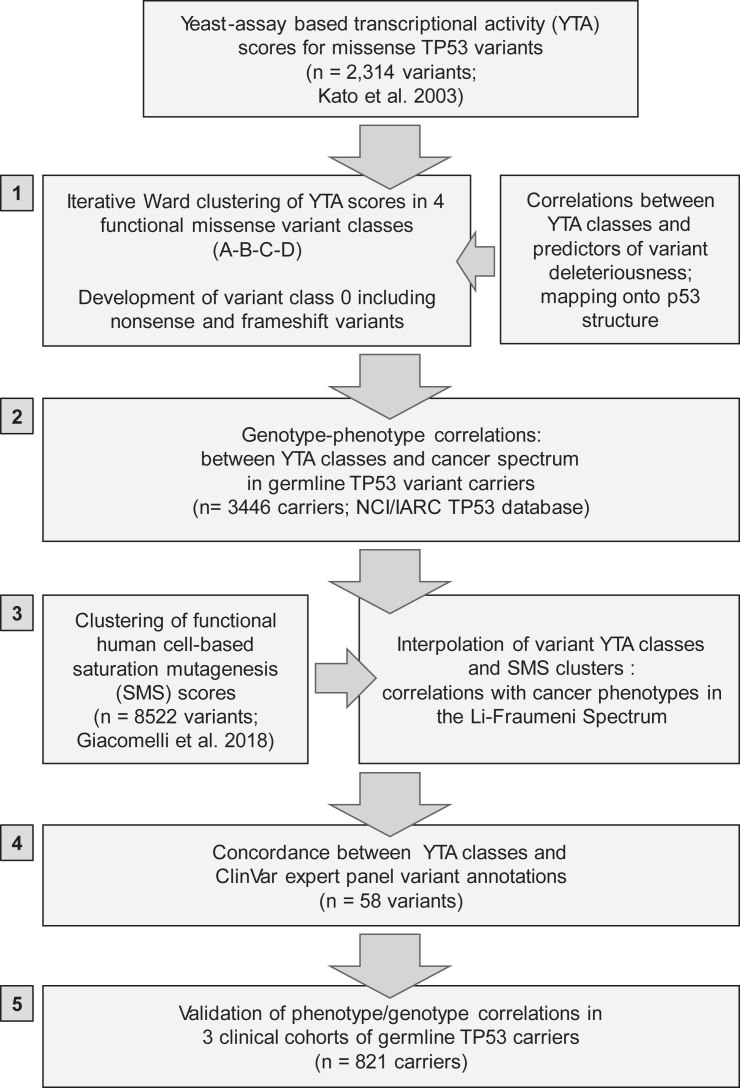
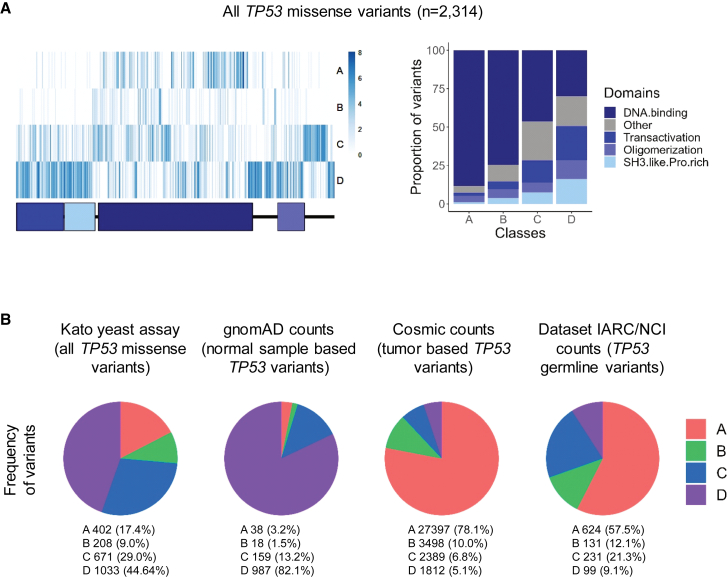
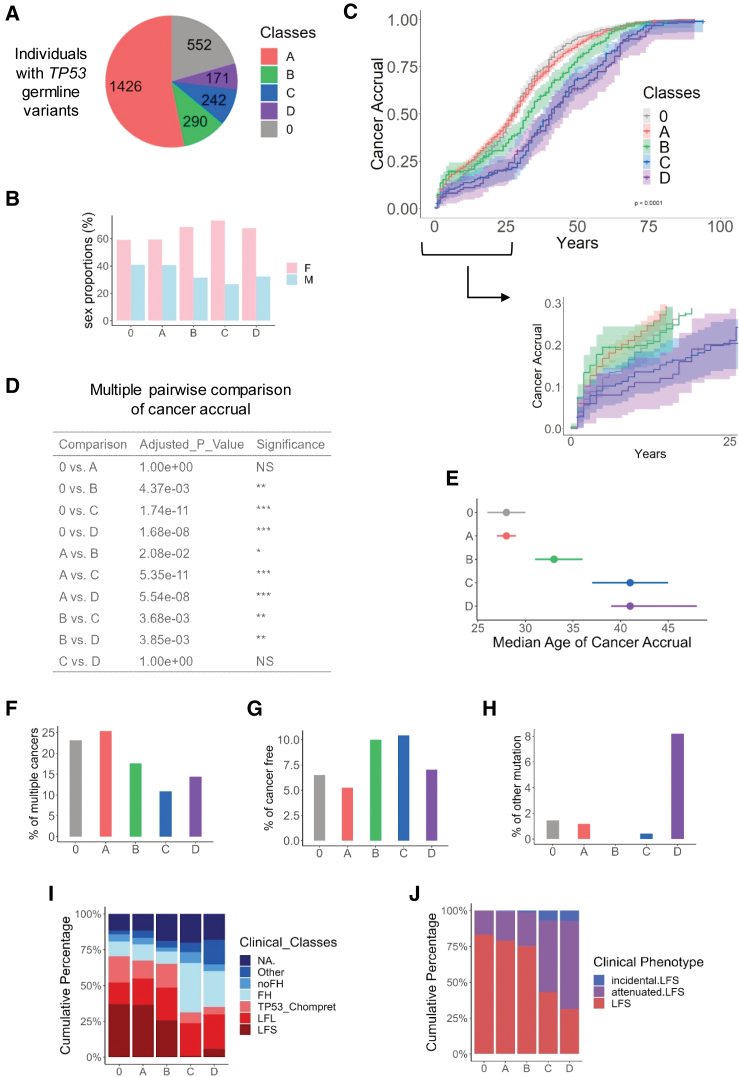
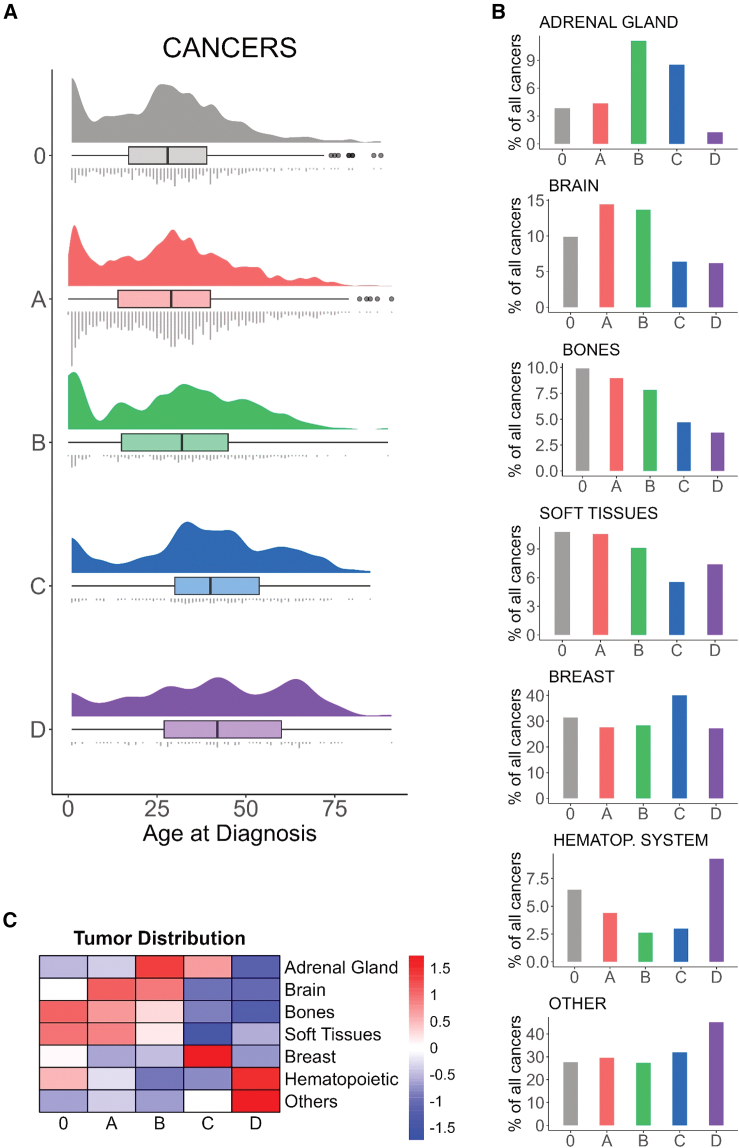
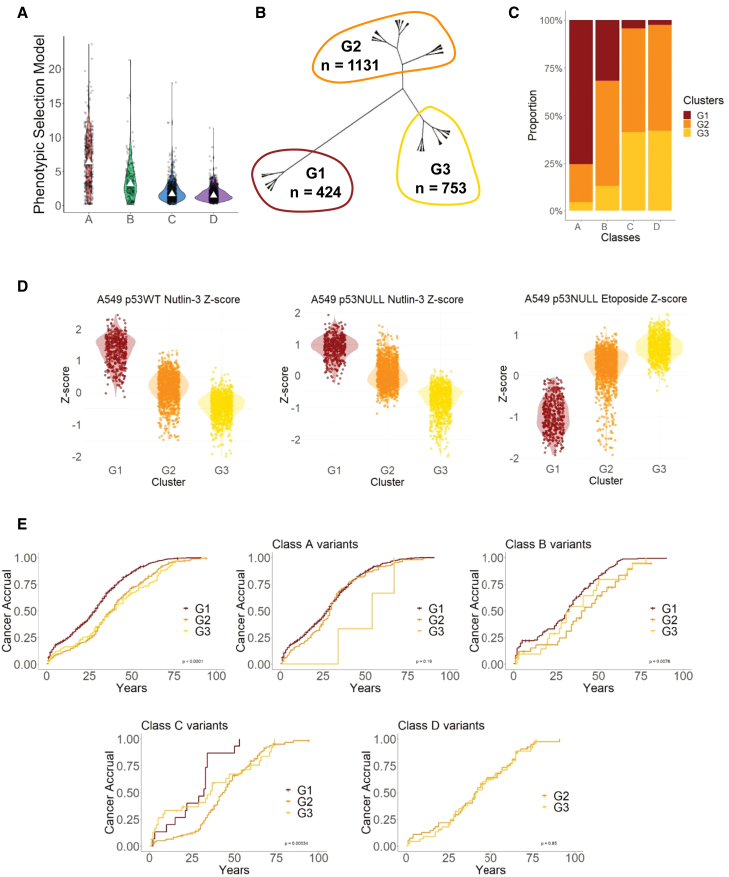
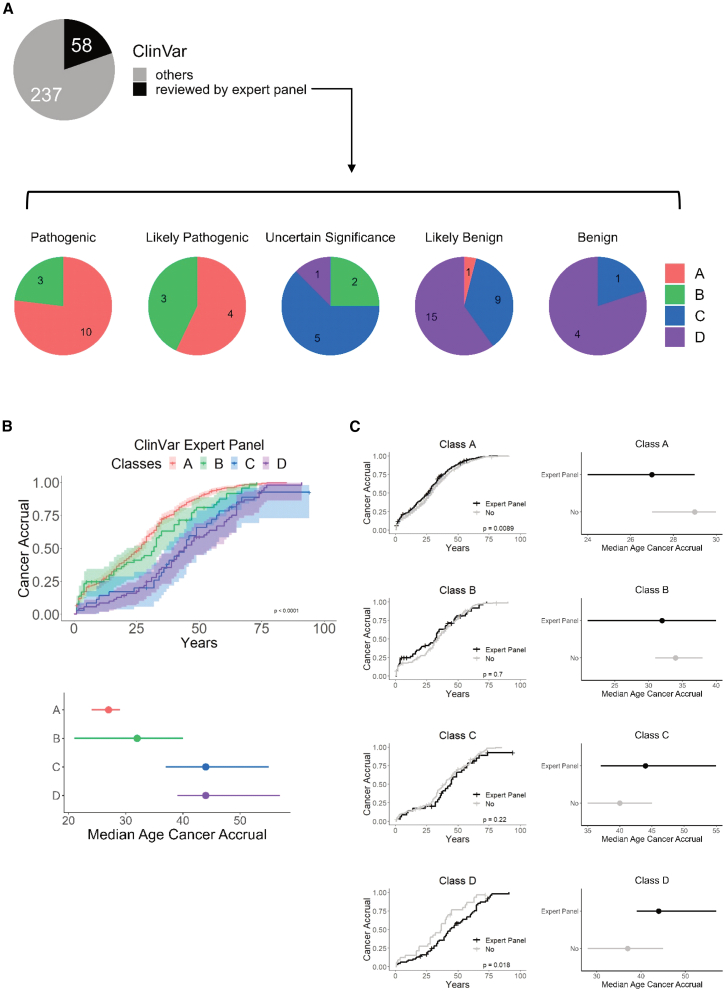
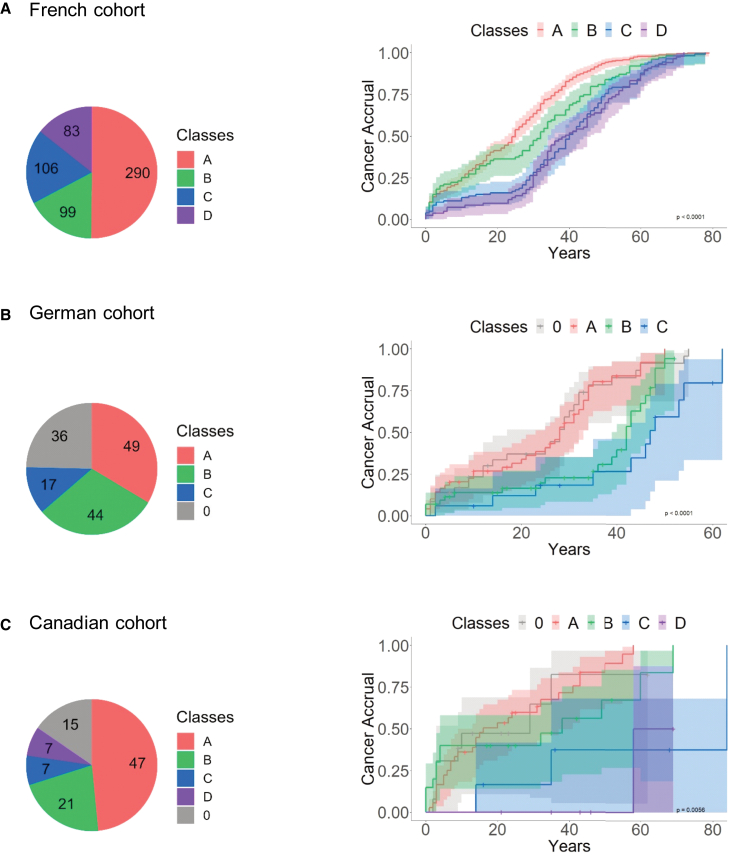
Li-Fraumeni syndrome (LFS) is a heterogeneous predisposition to an individually variable spectrum of cancers caused by pathogenic TP53 germline variants. We used a clustering method to assign TP53 missense variants to classes based on their functional activities in experimental assays assessing biological p53 functions. Correlations with LFS phenotypes were analyzed using the public germline TP53 mutation database and validated in three LFS clinical cohorts. Class A carriers recapitulated all phenotypic traits of fully penetrant LFS, whereas class B carriers showed a slightly less penetrant form dominated by specific cancers, consistent with the notion that these classes identify variants with distinct functional properties. Class C displayed a lower lifetime cancer risk associated with attenuated LFS features, consistent with the notion that these variants have hypomorphic features. Class D carriers showed low lifetime cancer risks inconsistent with LFS definitions. This classification of TP53 variants provides insights into structural/functional features causing pathogenicity.

Keywords: Genomics; Phenotyping.


Conflict of interest statement

The authors declare no competing interests.

Figures

None
Graphical abstract
Figure 1
Figure 1
Strategy for classifying TP53 variants into functional classes and evaluating their correlations with cancer phenotypes in TP53 mutation carriers First, we used hierarchical Ward’s clustering to interrogate the yeast-based transcriptional activity dataset (2,314 variants, YTA dataset). This approach identified four YTA classes (A to D) consistent with predictors of deleteriousness and reflecting a gradient of transcriptional activity from A (lowest activity) to D (quasi-identical to wild-type). We also created class 0, including nonsense and frameshift variants (p53 null genotype). Next, we analyzed lifetime cancer accrual and tumor patterns associated with each class using familial and individual data from the NCI germline TP53 mutation database (https://tp53.cancer.gov/). Third, we interpolated each class with clusters of functional scores from the human cell suppression saturation mutagenesis screens dataset (8,252 variants, SMS dataset) developed by Hahn and collaborators. Fourth, we assessed the significance and limitations of YTA classes by examining their concordance with ClinVar expert panel annotations (https://clinicalgenome.org/affiliation/50013/). Finally, we validated the proposed variant classification in three cohorts of carriers recruited in high-risk cancer predisposition clinics in Germany, France, and Canada (n = 821). See also Figures S1 and S2, and Table S1.
Figure 2
Figure 2
Distribution of TP53 variants from YTA classes across TP53 structure and datasets (A) Localization of TP53 missense variants along the TP53 sequence (left). Heatmap showing the number of variants found at each amino acid position, for each YTA classes. The TP53 domains are indicated below the heatmap to visualize the localization of TP53 variants within TP53 secondary structure. Proportion of residues within each TP53 domain for the four YTA classes (right). (B) Distribution of the variants from the YTA classes within different databases: transactivation yeast assay, gnomAD database, COSMIC database, and IARC/NCI LFS dataset. Pie charts represent the number of samples with TP53 missense variants belonging to the four YTA classes. See also Figures S3 and S4.
Figure 3
Figure 3
Relationship between YTA classes and clinical phenotype in Li-Fraumeni syndrome (A) Distribution of TP53 germline carriers in the IARC/NCI database into classes. Class 0 includes non-missense variants (stop and frameshift). (B) Sex distribution of individuals (F, females; M, males) for each class. (C) Cancer accrual of individuals according to classes. The inverted Kaplan-Meier presentation corresponds to the age of onset of the first cancer in each individual. The confidence intervals at 95% are displayed on the curves, and the p value of the log rank test is indicated. (D) Pairwise comparison of cancer accrual for each class. A multiple pairwise comparison (with Bonferroni correction) shows the significance of differences in cancer accrual between the classes (adjusted p value). (E) Median age of cancer accrual according to the classes. The median age is indicated as a dot, and the confidence intervals at 95% are indicated by bars aside the dot. (F) Proportion of individuals developing more than one cancer during lifetime. For each class, the barplot displays the percentage of individuals with more than one cancer. (G) Proportion of cancer-free individuals. For each class, the barplot shows the percentage of individuals who did not develop any cancer. (H) Proportion of individuals with a germline variant in an established cancer predisposing gene (CPG). For each class, the barplot shows the percentage of individuals who carry a variant for a CPG other than TP53. (I) Distribution of clinical classes within TP53 classes. The proportion of individuals belonging to the following categories are displayed: Li-Fraumeni syndrome (LFS), Li-Fraumeni-like syndrome (LFL), Chompret criteria (TP53_Chompret), familial history of cancer (FH), no familial history of cancer (noFH), other, and not applicable (NA). (J) Distribution of clinical phenotypes of the LFS spectrum definition within TP53 classes. The proportion of individuals belonging to the categories LFS, attenuated LFS, and incidental LFS are displayed. All TP53 variants are included, regardeless of their ClinVar annotations. See also Figure S5.
Figure 4
Figure 4
Association of YTA classes with tumor spectrum in LFS (A) Age-specific distribution of cancers (all topologies combined) for TP53 classes. The rain-cloud plots display (1) a density plot showing distribution of age of onset for cancers, (2) a box plot showing median age of onset as well as quartile and outlier values, and (3) a dot plot showing every cancer analyzed. (B) Distribution of cancers by topology. The most frequent LFS topologies are displayed (adrenal gland, brain, bones, soft tissues, hematopoietic system, and breast); all other topologies are referred as “other.” Multiple pairwise comparisons of proportion of topologies within classes are performed using logistic model based on Khi2 statistic to extract risk ratio, confidence intervals at 95%, and an adjusted p value (correction for multiple comparisons using Benjamini-Hochberg method). Statistical comparisons are found in Table S2. (C) Variation of cancer topology within classes. Heatmap synthetizes cancer topology distribution from Figure 4B (normalized in row by cancer topologies), and color scale represents enrichement scores. See also Figures S6 and S7.
Figure 5
Figure 5
Dissecting YTA variant classes with scores derived from human cells (A) Distribution of functional scorings from human cell-based assays (phenotypic selection model11) for the 2,314 TP53 missense variants, subdivided by YTA classes. Violin plots with dot plots display the distribution of scores, and the median scores are indicated as white triangles. (B) Clustering of TP53 missense variants based on scores derived from human cell dataset. The three Z scores were used to separate the TP53 variants into 3 clusters named G1, G2, and G3. (C) Distribution of TP53 variants according to clusters G1, G2, and G3 within the YTA classes A, B, C, and D. The histogram represents the proportion of G1, G2, and G3 variants within each YTA class. (D) Distribution of the three Z scores in the clusters G1, G2, and G3. This clustering results in a gradient of functionality with G1 containing the most disrupted variants and G3 the most functional ones. (E) Cancer accrual of the G1, G2, and G3 clusters interpolated with the classes A, B, C, and D. Age of first cancer is reported for each individual. Top left: all TP53 variants mixed. Other panels represent variants separated into classes A, B, C, and D. p value of the log rank test is indicated to assess the significance of differences between groups. See also Figures S8 and S9.
Figure 6
Figure 6
Concordance between YTA classes and ClinVar annotations (A) Distribution of expert panel-reviewed and non-expert-panel reviewed TP53 variants in the ClinVar classification. Variants from the IARC/NCI TP53 germline database are indicated in the pie chart. The second row of pie charts represents the breakdown of expert panel-reviewed variants in ClinVar categories (pathogenic, likely pathogenic, uncertain significance, likely benign, and benign). Mapping of the YTA classes within each ClinVar category is displayed. The number of variants for each ClinVar category is indicated within each pie chart. (B) Cancer accrual of each YTA class for the subcategory of expert panel-reviewed TP53 variants (top). The first cancer of the NCI/IARC TP53 germline database is used to monitor cancer accrual. Confidence intervals at 95% and log rank test p value are indicated. Median age of cancer accrual according to the classes (bottom). The median age is indicated as a dot, and the confidence intervals at 95% are indicated by bars aside the dot. (C) Comparison of cancer accrual for variants annotated by expert panel versus variants not annotated by expert panel (No). Left: cancer accrual within each YTA class. Right: the median and confidence intervals.
Figure 7
Figure 7
Matching YTA classes to Li-Fraumeni clinical validation cohorts For each cohort, the patients’ distribution into TP53 classes are shown in the pie charts (left), as well as the cancer accrual using the age of onset for the first cancer, confidence intervals at 95% and l rank p values (right). (A) Cohort 1 (France) analysis. (B) Cohort 2 (Germany) analysis. (C) Cohort 3 (Canada) analysis. See also Figure S10.

References

    1. Bougeard G., Renaux-Petel M., Flaman J.-M., Charbonnier C., Fermey P., Belotti M., Gauthier-Villars M., Stoppa-Lyonnet D., Consolino E., Brugières L., et al. Revisiting Li-Fraumeni Syndrome From TP53 Mutation Carriers. J. Clin. Oncol. 2015;33:2345–2352. doi: 10.1200/JCO.2014.59.5728. - DOI - PubMed
    1. Amadou A., Achatz M.I.W., Hainaut P. Revisiting tumor patterns and penetrance in germline TP53 mutation carriers: temporal phases of Li-Fraumeni syndrome. Curr. Opin. Oncol. 2018;30:23–29. doi: 10.1097/CCO.0000000000000423. - DOI - PubMed
    1. Li F.P., Fraumeni J.F., Mulvihill J.J., Blattner W.A., Dreyfus M.G., Tucker M.A., Miller R.W. A cancer family syndrome in twenty-four kindreds. Cancer Res. 1988;48:5358–5362. - PubMed
    1. Frebourg T., Bajalica Lagercrantz S., Oliveira C., Magenheim R., Evans D.G., European Reference Network GENTURIS Guidelines for the Li-Fraumeni and heritable TP53-related cancer syndromes. Eur. J. Hum. Genet. 2020;28:1379–1386. doi: 10.1038/s41431-020-0638-4. - DOI - PMC - PubMed
    1. Kratz C.P., Freycon C., Maxwell K.N., Nichols K.E., Schiffman J.D., Evans D.G., Achatz M.I., Savage S.A., Weitzel J.N., Garber J.E., et al. Analysis of the Li-Fraumeni Spectrum Based on an International Germline TP53 Variant Data Set: An International Agency for Research on Cancer TP53 Database Analysis. JAMA Oncol. 2021;7:1800–1805. doi: 10.1001/jamaoncol.2021.4398. - DOI - PMC - PubMed

LinkOut - more resources