. 2024 Nov 1;27(12):111298.
doi: 10.1016/j.isci.2024.111298. eCollection 2024 Dec 20.

Evaluating chemical effects on human neural cells through calcium imaging and deep learning

Affiliations

Evaluating chemical effects on human neural cells through calcium imaging and deep learning

Ray Yueh Ku et al. iScience. .

Abstract

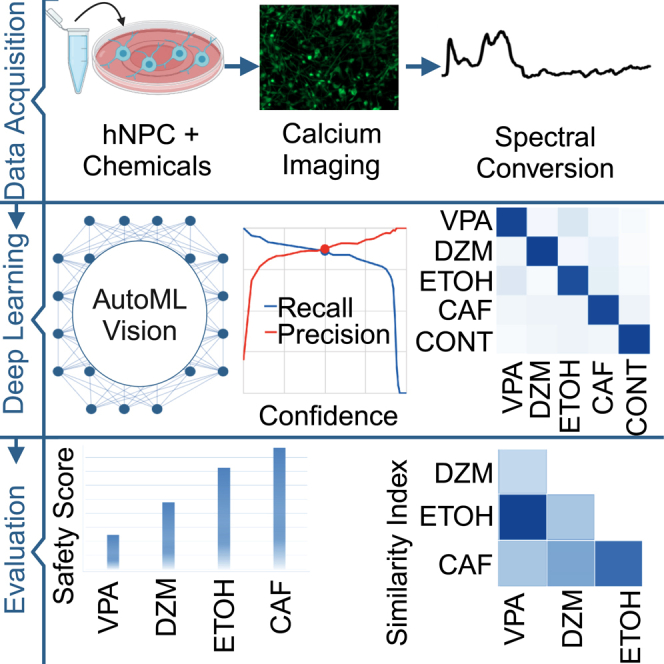
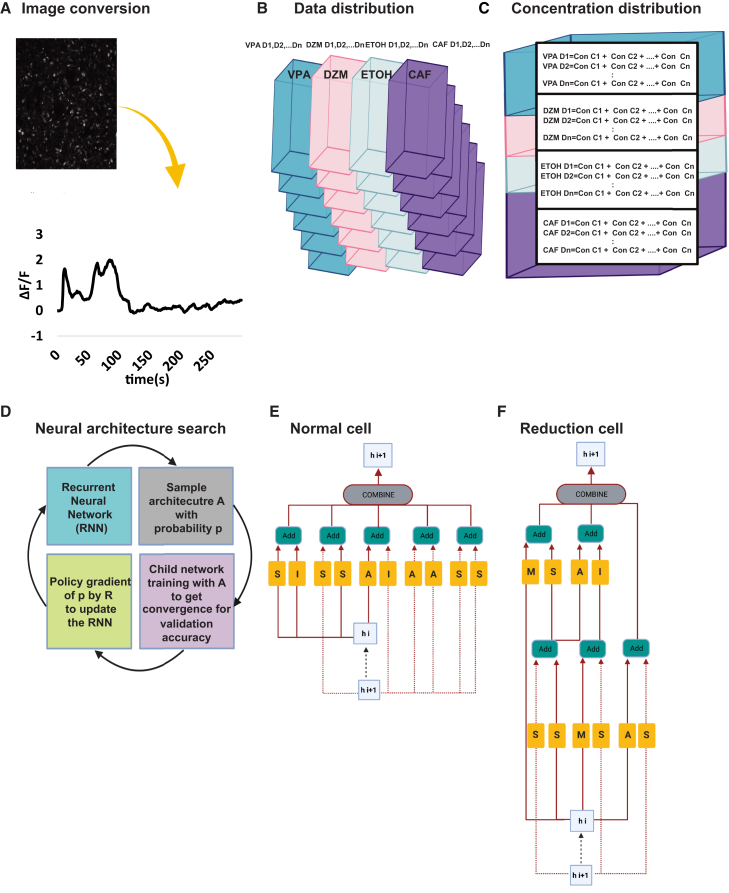
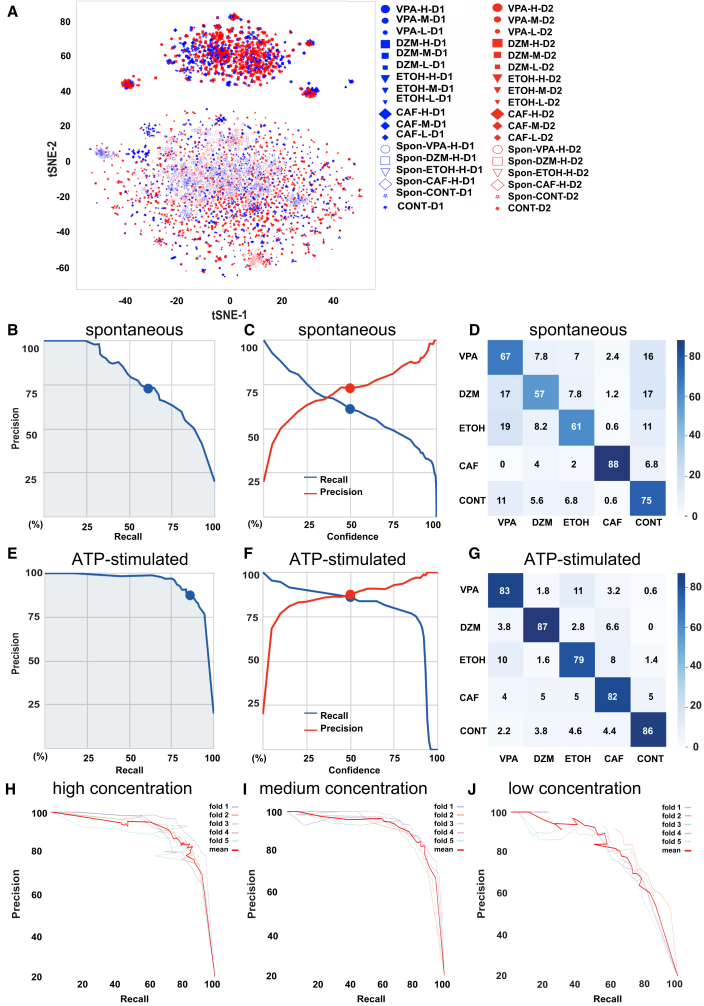
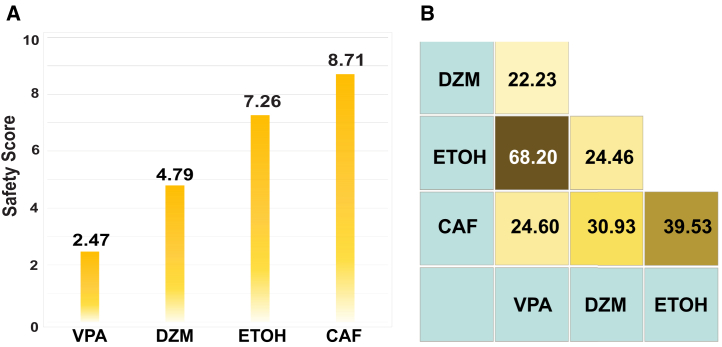
New substances intended for human consumption must undergo extensive preclinical safety pharmacology testing prior to approval. These tests encompass the evaluation of effects on the central nervous system, which is highly sensitive to chemical substances. With the growing understanding of the species-specific characteristics of human neural cells and advancements in machine learning technology, the development of effective and efficient methods for the initial screening of chemical effects on human neural function using machine learning platforms is anticipated. In this study, we employed a deep learning model to analyze calcium dynamics in human-induced pluripotent stem cell-derived neural progenitor cells, which were exposed to various concentrations of four representative chemicals. We report that this approach offers a reliable and concise method for quantitatively classifying the effects of chemical exposures and predicting potential harm to human neural cells.

Keywords: Biological sciences; Machine learning; Neuroscience.


Conflict of interest statement

K.H.-T. has received research funding from Suntory MONOZUKURI Expert Limited. T.U. is an employee of Suntory MONOZUKURI Expert Limited.

Figures

None
Graphical abstract
Figure 1
Figure 1
Characterization of human iPSC-derived NPCs used for calcium imaging (A) Immunostaining for an NPC marker Nestin shows its expression in the majority of D1 (A) and D2 (A′) NPCs. Scale bar, 50 μm. (B) The percentage of Nestin-positive cells were not significantly different between the two NPC lines (p = 0.4513 two-tailed t test). Data were presented as mean ± SD from three independent experiments. (C) RRHO analysis between transcriptomes of D1 NPCs at passage 31 (x axis) and D2 at passage 14 (y axis). The colors denote log-transformed hypergeometric p values comparing the ranks of expressed genes, indicating a high similarity in gene expression ranks between the two datasets. (D) GO analysis of the transcriptome of D1 NPCs based on molecular functions (kappa score 0.4) shows the expression of genes relevant to neuronal functions, neurotransmitter receptors, neuropeptide receptor binding, and ion channel activities. (D′) Analysis of the D2 NPCs transcriptome similarly shows GO terms relevant to neuropeptide receptors. (E) GO analysis of the transcriptomes of D1 (E) and D2 (E′) NPCs based on biological functions show the expression of genes involved in neuronal fate specification and commitment.
Figure 2
Figure 2
Molecular heterogeneity of NPCs in culture (A) The scatterplot shows the percentage of UMIs assigned to mitochondrial genes in each cell (each dot represents a single cell). The X axis shows the total number of UMIs per cell. Cells with more than 5% of UMIs assigned to mitochondrial genes were excluded from further analyses. (B) The scatterplot visualizes the number of genes detected in each cell. The strong correlation between total UMI counts (x axis) and detected gene numbers (y axis) affirmed the quality of data. (C) The violin plot shows the distribution of the number of genes detected per cell. Outlier cells with fewer than 200 or more than 7,500 genes were excluded from downstream analyses. (D) The violin plot shows the distribution of total UMI counts per cell. The median UMIs per cell was 9,969. (E) The violin plot shows the distribution of the percentage of UMI counts from mitochondrial genes in total UMI counts per cell. (F) UMAP visualization of the 6 clusters from 19,759 cells. (G) Violin plots show high expression of an NPC marker, vimentin, in all cell clusters. (H) The expression of each of the five genes most differentially expressed in each cluster compared to the other clusters is shown on the gene expression heatmap. Genes and cell cluster numbers are shown in rows and columns, respectively.
Figure 3
Figure 3
Kinetics of stimulated calcium transients are affected by exposure to chemicals (A) Workflow of our analysis of calcium dynamics in human NPCs. (B–G) Characterization of ATP-stimulated calcium transients in NPCs exposed to indicated chemicals at the high (H), medium (M), and low (L) concentrations, based on the number (B), duration (C), amplitude (D), max rise slope (E), max decay slope (F), and area under the plotted curve (relative to the value for CONT) (G). Non-parametric one-way ANOVA showed significant effects of chemicals (p < 0.05) in all measures. ∗, ∗∗, ∗∗∗, and ∗∗∗∗ represent p < 0.05, 0.01, 0.001, and 0.0001, respectively, in comparison to CONT by post-hoc Dunn’s test (mean ± SEM). (H) Heatmap of negative log10-transformed p values from the Dunn’s test performed in (B–G). (I–N) Heatmaps of negative log10-transformed p values obtained by Dunn’s test for pairwise comparisons of chemical’s effects on each measure of calcium transients. Sample numbers are provided in Table S1.
Figure 4
Figure 4
Workflow of Google Automatic Machine Learning (AutoML) Vision analysis (A) The data assortment section includes multiple layers. 1 Hz image series for 300 s after stimulation are converted to a trace of relative fluorescence intensity change. (B and C) Approximately 1,200 traces are generated per culture dish. Trace image data are assorted into 4 groups of different chemicals (B) that include 3 concentrations and 1 experimental control (C). Two biological replicates are included for each concentration. (D) Google AutoML Vision uses neural architecture search (NAS) algorithm (adapted from the study by Zoph et al., see details in STAR Methods) by identifying architecture A using recurrent neural network (RNN) with the probability p. Child network with the given A is set for training to achieve the accuracy R. (E and F) Structures of normal (E) and reduction (F) cells (adapted from the study by Zoph et al. Each white box (labeled h i) shows a hidden state from the previous activation and the gray oval shows the output of combining different operations for pooling using softmax function: separate (S), identity (I), and average (A). In the reduction cell, maximum (M) operator is also used for pooling. Each block results in convolutional cells by primitive operators shown in yellow and combination operations shown in green.
Figure 5
Figure 5
Machine learning of temporal traces of calcium activity (A) t-SNE analysis of 4,275 images of temporal trances of calcium activity from indicated groups. Some high concentration samples form clusters that are unrelated to the type of chemical. Using different settings (e.g., perplexity value: 5–500, iteration: 1000–5000) provided similar output maps. (B–G) Precision-recall curves of the best model (B, C, E, and F) and averaged confusion matrices shown as percentages (D and G) from 5-fold cross-validation. These were generated using AutoML Vision trained with images of temporal traces of spontaneous (B–D) and ATP-stimulated (E–G) calcium transients in NPCs exposed to each chemical at the high (or control) concentration. The numbers of image datasets of spontaneous and ATP-stimulated activities were 1,457 and 1,244, respectively. (H–J) 5-fold cross-validation of the models trained with ATP-stimulated datasets of the high, medium, and low concentrations.
Figure 6
Figure 6
Safety and similarity of chemical effects on NPCs predicted by machine learning (A) Safety scores predict the order of safety levels for the four tested chemicals. (B) The similarity matrix predicts the similarities between the effects of the four tested chemicals on neural functions.

Similar articles

References

    1. Curran C.P., Marczinski C.A. Taurine, caffeine, and energy drinks: Reviewing the risks to the adolescent brain. Birth Defects Res. 2017;109:1640–1648. doi: 10.1002/bdr2.1177. - DOI - PMC - PubMed
    1. Harry G.J., Tiffany-Castiglioni E. Evaluation of neurotoxic potential by use of in vitro systems. Expert Opin. Drug Metab. Toxicol. 2005;1:701–713. doi: 10.1517/17425255.1.4.701. - DOI - PubMed
    1. Accardi M.V., Pugsley M.K., Forster R., Troncy E., Huang H., Authier S. The emerging role of in vitro electrophysiological methods in CNS safety pharmacology. J. Pharmacol. Toxicol. Methods. 2016;81:47–59. doi: 10.1016/j.vascn.2016.03.008. - DOI - PubMed
    1. Farrell K., Joshi P., Roth A., Kothapalli C., Lee M.Y. 2016. High-throughput Screening of Toxic Chemicals on Neural Stem Cells. - DOI
    1. Matsuda N., Odawara A., Kinoshita K., Okamura A., Shirakawa T., Suzuki I. Raster plots machine learning to predict the seizure liability of drugs and to identify drugs. Sci. Rep. 2022;12:2281. doi: 10.1038/s41598-022-05697-8. - DOI - PMC - PubMed