. 2024 Sep 13;27(10):110939.
doi: 10.1016/j.isci.2024.110939. eCollection 2024 Oct 18.

PI3K-dependent reprogramming of hexokinase isoforms controls glucose metabolism and functional responses of B lymphocytes

Affiliations

PI3K-dependent reprogramming of hexokinase isoforms controls glucose metabolism and functional responses of B lymphocytes

Brandon T Paradoski et al. iScience. .

Abstract

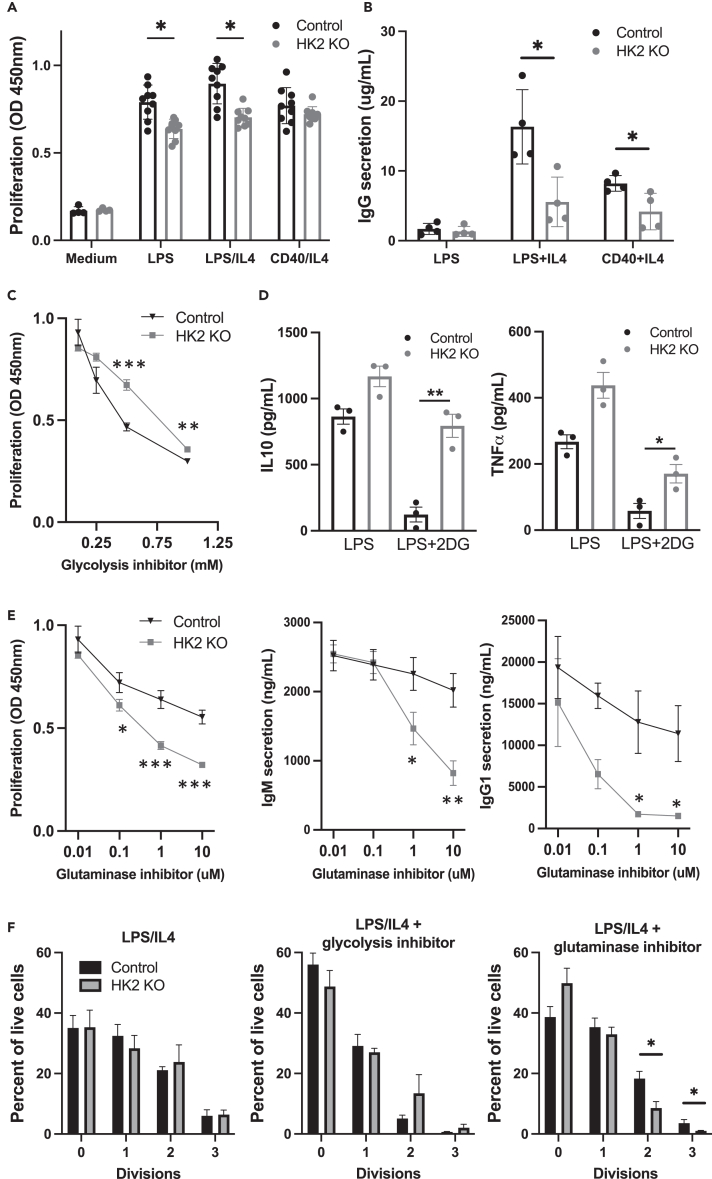
B lymphocyte activation triggers metabolic reprogramming essential for B cell differentiation and mounting a healthy immune response. Here, we investigate the regulation and function of glucose-phosphorylating enzyme hexokinase 2 (HK2) in B cells. We report that both activation-dependent expression and mitochondrial localization of HK2 are regulated by the phosphatidylinositol 3-kinase (PI3K) signaling pathway. B cell-specific deletion of HK2 in mice caused mild perturbations in B cell development. HK2-deficient B cells show impaired functional responses in vitro and adapt to become less dependent on glucose and more dependent on glutamine. HK2 deficiency impairs glycolysis, alters metabolite profiles, and alters flux of labeled glucose carbons into downstream pathways. Upon immunization, HK2-deficient mice exhibit impaired germinal center, plasmablast, and antibody responses. HK2 expression in primary human chronic lymphocytic leukemia (CLL) cells was associated with recent proliferation and could be reduced by PI3K inhibition. Our study implicates PI3K-dependent modulation of HK2 in B cell metabolic reprogramming.

Keywords: Cell biology; Cellular physiology; Immunology.


Conflict of interest statement

The authors declare no competing interests.

Figures

None
Graphical abstract
Figure 1
Figure 1
PI3K-dependent reprogramming of hexokinases during B cell activation (A) Splenic B cells from C57BL/6 mice were stimulated overnight with anti-CD40+IL-4+anti-IgM with or without PI3Kδ inhibitor idelalisib (PI3Kδi), and extracellular acidification rate (ECAR) profile was assessed by Seahorse metabolic flux assay. The graph shows the mean and SEM of 5 technical replicates from one representative experiment (four performed). (B) Splenic B cells isolated from mice with a B cell-specific PI3Kδ gain-of-function mutation (PI3Kδ GOF), or littermate control mice, were stimulated overnight with anti-CD40+IL-4+anti-IgM and ECAR profile was assessed. The graph shows the mean and SEM of 5 technical replicates from one representative experiment (three performed). (C) Protein extracts were collected from resting or activated B cells, and the expression of HK1 or HK2 was detected by western blot. Impact of PI3K, Akt, and mTOR inhibitors on activation-induced HK1/2 expression was determined by the addition of inhibitors: PI3Kδi = 10 μM idelalisib; pan-PI3Ki = 1 μM pictilisib; Akti-1 = 1 μM MK-2206; Akti-2 = 1 μM iapatasertib; Rapa, rapamycin; mTORC1/2i = 50 nM sapanisertib; mTORC2i = 50 nM JR-AB2-011. Data are representative of two similar experiments with all inhibitors, and five others with PI3K inhibitors only. Numbers below each lane indicate the relative HK2/actin ratios. (D) PI3Kδ GOF splenic B cells were stimulated overnight with anti-CD40+IL-4+anti-IgM prior to western blot analysis to detect HK2 expression levels. Data are representative of two similar experiments. (E) Flow cytometry detection of HK2 upregulation in human B cells was validated by comparing BJAB human B lymphoma cells and BJAB cells where the HK2 gene was deleted by CRISPR. Data are representative of two similar experiments. (F) Peripheral blood mononuclear cells (PBMCs) were stimulated overnight with CD40L + IL-4+anti-IgM with or without 1 μM pictilisib and then surface stained for CD19 and intracellularly stained for HK2. HK2 staining mean fluorescence intensity (MFI) among live CD19+ cells is shown for cultures from 3 healthy donor PBMC samples. Results are pooled from two independent experiments.
Figure 2
Figure 2
Unique subcellular localization and non-redundant function of HK2 in B cells (A) Mitochondrial and cytoplasmic protein extracts were prepared from parental BJAB B lymphoma cells or HK2-deficient BJAB cells generated by Crispr gene inactivation. Extract were western blotted for HK1, 2, and 3; GAPDH was used as a positive control for cytoplasmic fraction enrichment while Bcl2 was used as a positive control for mitochondrial fraction enrichment. Data are representative of three similar experiments. (B) Mitochondrial localization of HK2 in BJAB cells under various conditions was assessed by immunofluorescence staining of HK2, labeling of mitochondria with MitoTracker dye, and confocal microscopy analysis. HK2 KO BJAB cells re-expressing HK2 lacking the N-terminal mitochondrial localization sequence (ΔN-term) were used as a control. Left: representative images of cells expressing wild-type HK2 or ΔN-term, with green and red fluorescence intensity plots along the white arrows illustrating stronger colocalization for control versus mutant. Right: cells were assessed under low glucose conditions (Control), after treatment with anti-CD40+IL-4+anti-IgM (Stim) or pre-treatment with pictilisib prior to stimulation (Stim+PI3Ki). Graph depicts Pearson’s correlation coefficients of HK2 and mitotracker staining signals for individual cells; results shown are pooled from two experiments showing similar results. (C) Parental and HK2-deficient BJAB cells were assessed by metabolic flux assays and show significantly reduced ECAR. The graph shows the mean and SEM of 5 technical replicates from one representative experiment (two performed). (D) Metabolic flux assay results indicating that HK2-deficient BJAB cells have significantly reduced glycolytic ATP production rate. The graph shows the mean and SEM of 5 technical replicates from one representative experiment (four performed). (E and F) Splenic B cells were isolated from HK2-deficient or littermate control mice and cultured overnight in medium or anti-CD40, IL-4 and anti-IgM (Stim). Glycolysis was assessed by metabolic flux assays to measure ECAR in stimulated cells (E) or glycolytic/mitochondrial ATP production rates (F). ECAR and ATP assay results are each representative of two independent experiments.
Figure 3
Figure 3
Roles of HK2 in B cell development (A) Validation of HK2 intracellular staining specificity using activated HK2 KO B cells. Also see Figure S1. (B–D) Single-cell suspensions from the indicated mouse tissues were surface stained to identify B cell sub-populations and intracellularly stained to assess HK2 expression. Background-subtracted HK2 MFIs were determined for each cell population. T1/T2, transitional 1/2; FO, follicular; ABC, age-associated B cell; MZ, marginal zone. Population gating is described in Figure S2. See Figure S3 for additional HK2 expression data. Graphs show mean and standard error of 5 mice per group and are representative of 2–3 experiments per tissue. (E) Frequencies of CD19+ B cells in the spleen and bone marrow. (F) Representative flow cytometry plots illustrating gating in the bone marrow. (G) Frequencies of B cell and precursor subsets in the bone marrow. (H) Representative flow cytometry plots illustrating gating of CD19+ B cell subsets in the spleen. (I) Frequencies of immature and mature B cell subsets in the spleen. Results in (E–I) are pooled from two experiments, totaling 8 mice per genotype.
Figure 4
Figure 4
HK2 deficiency impacts in vitro B cell functional responses Splenic B cells were isolated from HK2-deficient or littermate control mice and cultured in the presence of the indicated activation stimuli. (A) Proliferation was assessed at day 4 of culture by CCK-8 assay. Results are pooled from two experiments, totaling 8 mice per genotype. (B) After 6 days of culture, supernatants were collected to measure secreted IgG1 antibodies by ELISA assay. The experiment shown (4 mice per genotype) is representative of 3 experiments with similar results. (C) Cells were stimulated with LPS+IL-4 in the presence of the indicated concentrations of glycolysis inhibitor 2-deoxyglucose (2DG) and proliferation assessed. Results are representative of 3 independant experiments. (D) Cells were stimulated with LPS alone or in the presence of 0.5 mM 2DG, and the indicated cytokines were assessed by Mesoscale assay. Results are from a single experiment (3 mice per genotype). (E) Cells stimulated with LPS+IL-4 in the presence of the indicated concentrations glutaminase inhibitor CB-839 and proliferation or antibody secretion were assessed. (F) Cells were labeled with cell division dye CFSE, stimulated with LPS+IL-4 with medium alone or in the presence of 0.5 mM 2DG or 1 μM CB-839, and analyzed by flow cytometry to gate cells based on CFSE dilution. Graphs show the percent of cells in the indicated cell division gates and represent data pooled from 4 mice per genotype. See Figure S4 for additional functional characterization of HK2-deficient mice.
Figure 5
Figure 5
Impact of HK2 deficiency on metabolite profiles Splenic B cells were cultured overnight in RPMI media only or with F(ab’)2 anti-IgM, CD40L, and IL-4 (Stim), and then snap frozen. Metabolites were extracted, measured by mass spectrometry and normalized to total protein content in each sample. (A) Heatmap illustrating relative differences in metabolite levels. Full metabolite profiling data is provided in Table S1. (B) Calculated ratios of glucose-6-P, fructose-6-P, 6-phosphogluconate, or glucose-1-P to glucose under resting or activated conditions. Results in (A) and (B) are from a single experiment using 2 mice per genotype. (C and D) Cells were stimulated overnight, washed in glucose-free medium, and incubated for 1 h (C) or 4 h (D) with 13C-glucose to allow incorporation of 13C into downstream metabolites. 13C-labeled and unlabeled metabolites were measured by mass spectrometry and percent labeling of each metabolite is shown. F1,6BP, fructose-1,6-bisphosphate; DHAP, dihydroxyacetone phosphate; 2-PG, 2-phosphoglycerate; PEP, phosphoenolpyruvate. Results are pooled from 4 mice per genotype.
Figure 6
Figure 6
Effect of B cell-specific HK2 deficiency on responses to immunization HK2-deficient or littermate control mice were immunized with sheep red blood cells (SRBCs) and assessed by flow cytometry. (A) HK2 expression in activated B cell populations generated at the indicated time points after SRBC immunization. (B) Representative flow cytometry plots illustrating gating of germinal center B cell populations in spleen and graphs showing frequencies of germinal center B cells and CD86+ B cells pooled from 2 to 3 experiments. (C) Representative flow cytometry plots illustrating gating of plasma cell populations in the spleen and bone marrow and graph showing cell frequencies pooled from 5 experiments. (D) Generation of SRBC-binding IgM and IgG antibodies. SRBC were incubated with serum from the indicated days post immunization, and bound antibodies were detected by immunofluorescence staining and flow cytometry. Results are representative of 4 similar experiments. Significance was determined by t test (∗p < 0.05; ∗∗p < 0.005).
Figure 7
Figure 7
Expression of HK2 in B cell leukemia Peripheral blood mononuclear cell samples from patients with chronic lymphocytic leukemia or healthy controls were assessed for HK2 expression by flow cytometry. (A) HK2 MFI within gated CD19+ cells. Each dot represents an individual patient or healthy control. (B) Spearman’s correlation of HK2 MFI with percent ZAP70 expression among CLL cells (determined by clinical lab testing). (C) Proliferative versus quiescent CLL cell populations were gated based on CXCR4 and CD5 expression (left). HK2 expression in each individual patient’s proliferative and quiescent cell fractions are connected by lines (right). Significance was determined by Wilcoxon test. (D) Pearson’s correlation of HK2 MFI with CXCR4 expression among CLL cells. See Table S2 for CLL patient demographics and clinical parameters and Figure S5 for the association of HK2 expression with other CLL clinical parameters. (E) CLL cells were cultured overnight with CD40L+IL-4+anti-IgM (Stim) alone or with pan-PI3K inhibitor (1 μM pictilisib) prior to assessment of HK2 expression. Significance was determined by Wilcoxon test.

References

    1. Warburg O. On the Origin of Cancer Cells. Am. Assoc. Adv. Sci. 1956;123:309–314. - PubMed
    1. Boothby M.R., Brookens S.K., Raybuck A.L., Cho S.H. Supplying the trip to antibody production—nutrients, signaling, and the programming of cellular metabolism in the mature B lineage. Cell. Mol. Immunol. 2022;19:352–369. doi: 10.1038/s41423-021-00782-w. - DOI - PMC - PubMed
    1. Jellusova J. Metabolic control of B cell immune responses. Curr. Opin. Immunol. 2020;63:21–28. doi: 10.1016/j.coi.2019.11.002. - DOI - PubMed
    1. Khalsa J.K., Chawla A.S., Prabhu S.B., Vats M., Dhar A., Dev G., Das N., Mukherjee S., Tanwar S., Banerjee H., et al. Functionally significant metabolic differences between B and T lymphocyte lineages. Immunology. 2019;158:104–120. doi: 10.1111/imm.13098. - DOI - PMC - PubMed
    1. Jellusova J., Cato M.H., Apgar J.R., Ramezani-Rad P., Leung C.R., Chen C., Richardson A.D., Conner E.M., Benschop R.J., Woodgett J.R., Rickert R.C. Gsk3 is a metabolic checkpoint regulator in B cells. Nat. Immunol. 2017;18:303–312. doi: 10.1038/ni.3664. - DOI - PMC - PubMed

LinkOut - more resources