

Machine learning models can predict cancer-associated disseminated intravascular coagulation in critically ill colorectal cancer patients
- PMID: 39635429
- PMCID: PMC11614659
- DOI: 10.3389/fphar.2024.1478342
Machine learning models can predict cancer-associated disseminated intravascular coagulation in critically ill colorectal cancer patients
Abstract
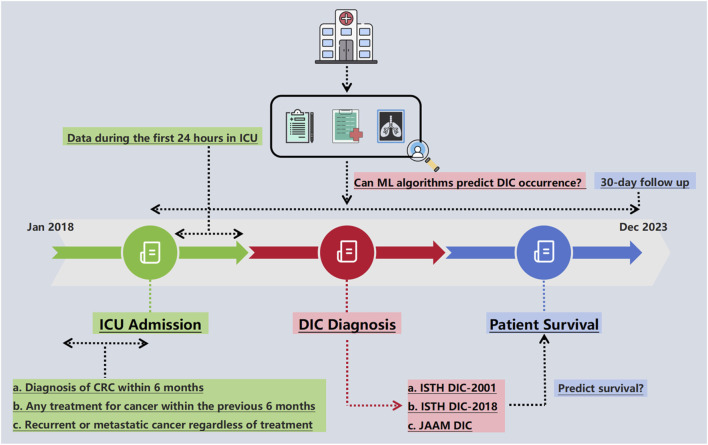
Background: Due to its complex pathogenesis, the assessment of cancer-associated disseminated intravascular coagulation (DIC) is challenging. We aimed to develop a machine learning (ML) model to predict overt DIC in critically ill colorectal cancer (CRC) patients using clinical features and laboratory indicators.
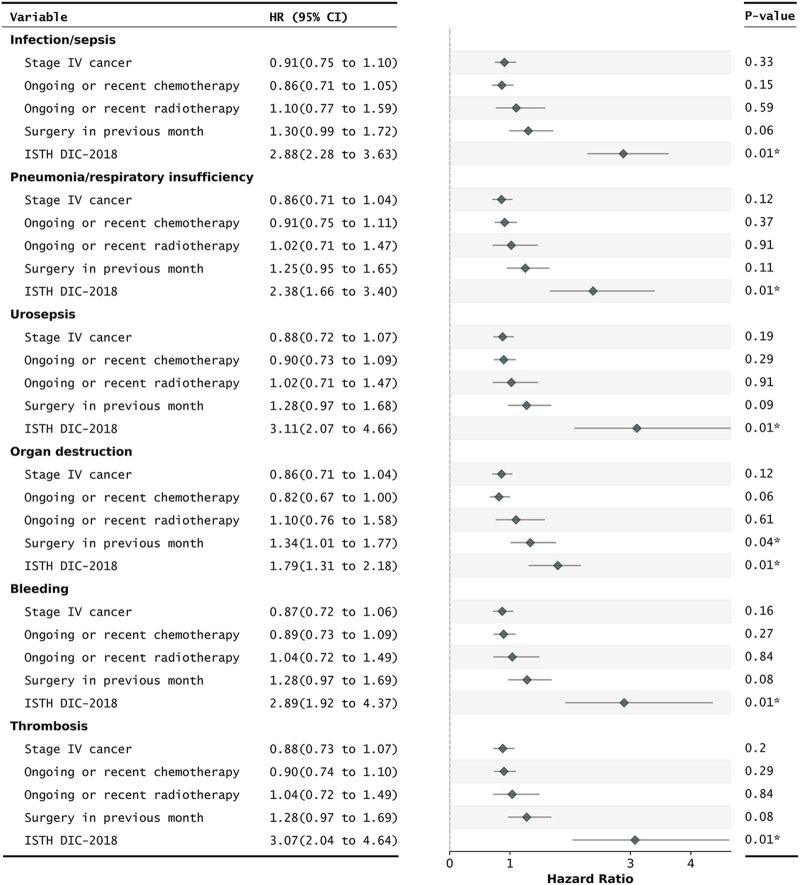
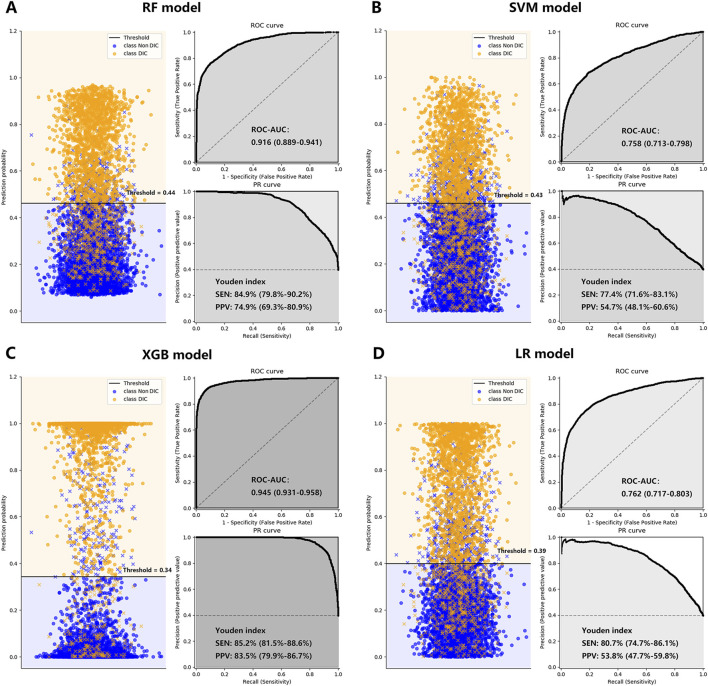
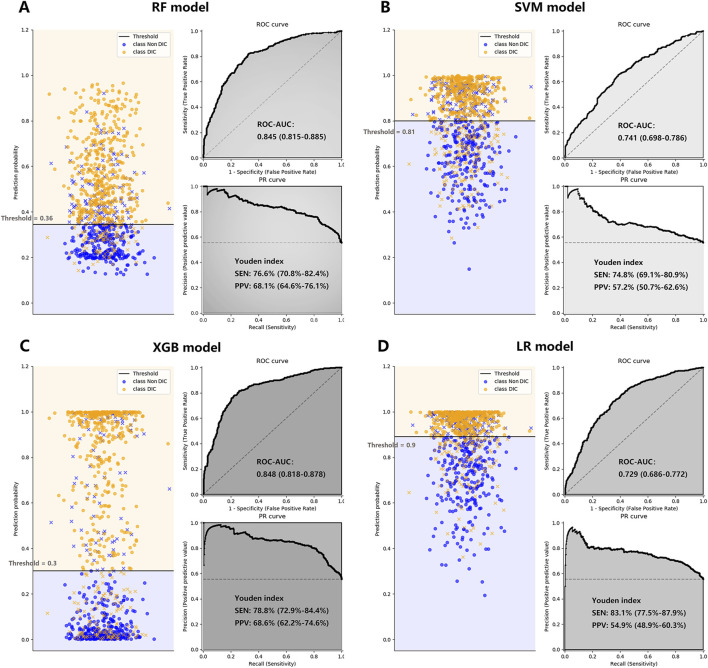
Methods: This retrospective study enrolled consecutive CRC patients admitted to the intensive care unit from January 2018 to December 2023. Four ML algorithms were used to construct predictive models using 5-fold cross-validation. The models' performance in predicting overt DIC and 30-day mortality was evaluated using the area under the receiver operating characteristic curve (ROC-AUC) and Cox regression analysis. The performance of three established scoring systems, ISTH DIC-2001, ISTH DIC-2018, and JAAM DIC, was also assessed for survival prediction and served as benchmarks for model comparison.
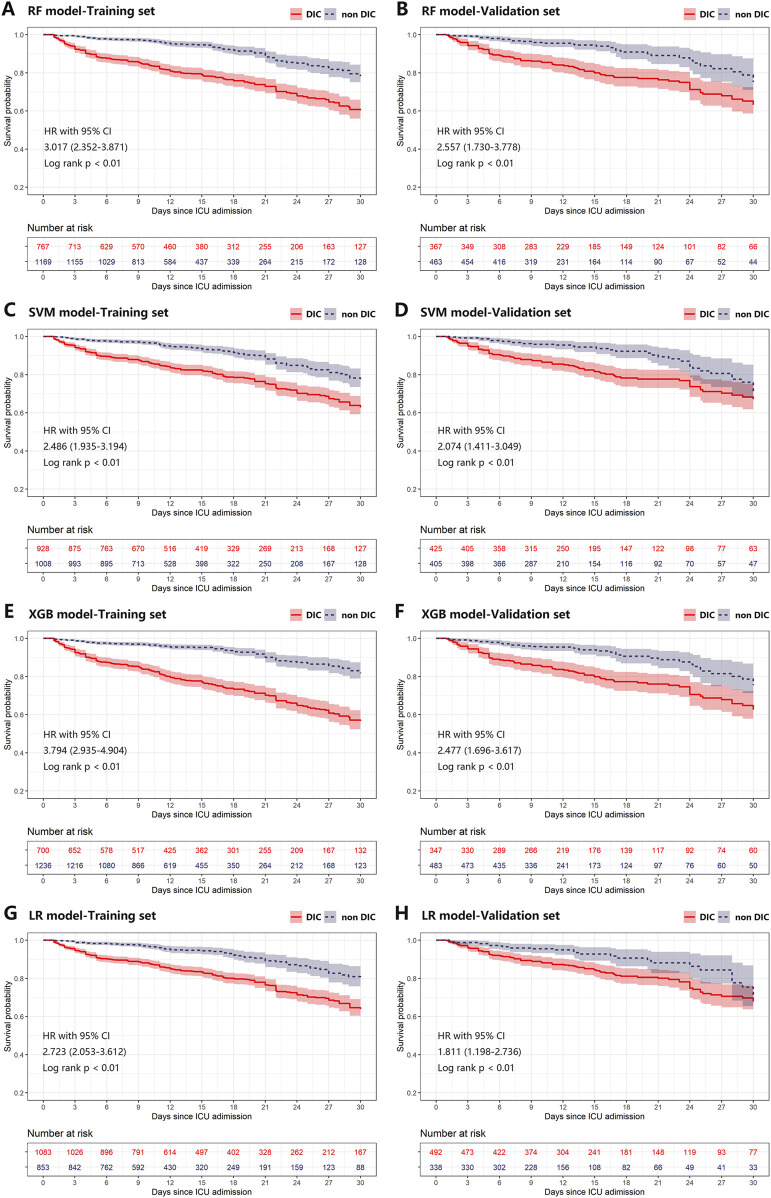
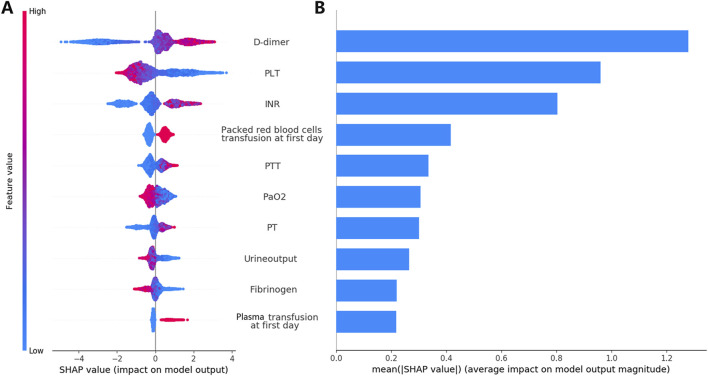
Results: A total of 2,766 patients were enrolled, with 699 (25.3%) diagnosed with overt DIC according to ISTH DIC-2001, 1,023 (36.9%) according to ISTH DIC-2018, and 662 (23.9%) according to JAAM DIC. The extreme gradient boosting (XGB) model outperformed others in DIC prediction (ROC-AUC: 0.848; 95% CI: 0.818-0.878; p < 0.01) and mortality prediction (ROC-AUC: 0.708; 95% CI: 0.646-0.768; p < 0.01). The three DIC scores predicted 30-day mortality with ROC-AUCs of 0.658 for ISTH DIC-2001, 0.692 for ISTH DIC-2018, and 0.673 for JAAM DIC.
Conclusion: The results indicate that ML models, particularly the XGB model, can serve as effective tools for predicting overt DIC in critically ill CRC patients. This offers a promising approach to improving clinical decision-making in this high-risk group.
Keywords: anticoagulation; colorectal cancer; disseminated intravascular coagulation; intensive care unit; machine learning model.
Copyright © 2024 Qin, Mao, Gao, Xie, Liang and Li.
Conflict of interest statement
The authors declare that the research was conducted in the absence of any commercial or financial relationships that could be construed as a potential conflict of interest.
Figures
Similar articles
-
Evaluation of Disseminated Intravascular Coagulation in Critically Ill Pediatric Hemato-oncology Patients with Septic Shock.Thromb Haemost. 2020 Nov;120(11):1505-1511. doi: 10.1055/s-0040-1714737. Epub 2020 Aug 9. Thromb Haemost. 2020. PMID: 32772349
-
Performances of disseminated intravascular coagulation scoring systems in septic shock patients.Ann Intensive Care. 2020 Jul 10;10(1):92. doi: 10.1186/s13613-020-00704-5. Ann Intensive Care. 2020. PMID: 32651674 Free PMC article.
-
A multicenter, prospective validation of disseminated intravascular coagulation diagnostic criteria for critically ill patients: comparing current criteria.Crit Care Med. 2006 Mar;34(3):625-31. doi: 10.1097/01.ccm.0000202209.42491.38. Crit Care Med. 2006. PMID: 16521260
-
Diagnosis of sepsis-induced disseminated intravascular coagulation and coagulopathy.Acute Med Surg. 2019 Apr 1;6(3):223-232. doi: 10.1002/ams2.411. eCollection 2019 Jul. Acute Med Surg. 2019. PMID: 31304023 Free PMC article. Review.
-
The transition of the criteria for disseminated intravascular coagulation and the targeted patients in randomized controlled trials over the decades: a scoping review.Thromb J. 2024 Dec 23;22(1):112. doi: 10.1186/s12959-024-00681-w. Thromb J. 2024. PMID: 39716150 Free PMC article.
Cited by
-
Disseminated intravascular coagulation: cause, molecular mechanism, diagnosis, and therapy.MedComm (2020). 2025 Jan 14;6(2):e70058. doi: 10.1002/mco2.70058. eCollection 2025 Feb. MedComm (2020). 2025. PMID: 39822757 Free PMC article. Review.
-
Interpretable machine learning model for early prediction of disseminated intravascular coagulation in critically ill children.Sci Rep. 2025 Apr 2;15(1):11217. doi: 10.1038/s41598-025-91434-w. Sci Rep. 2025. PMID: 40175405 Free PMC article.
References
-
- Choi U. E., Nicholson R. C., Frank S. M., Cha S., Aziz H., Lester L. C., et al. (2024). Perioperative plasma in addition to red blood cell transfusions is associated with increased venous thromboembolism risk postoperatively. Anesth. Analg. 139 (2), 254–261. 10.1213/ANE.0000000000006850 - DOI - PubMed
LinkOut - more resources
Full Text Sources