. 2024 Nov 20:15:1439971.
doi: 10.3389/fimmu.2024.1439971. eCollection 2024.

Hepatic and pulmonary macrophage activity in a mucosal challenge model of Ebola virus disease

Affiliations

Hepatic and pulmonary macrophage activity in a mucosal challenge model of Ebola virus disease

Timothy G Wanninger et al. Front Immunol. .

Abstract

Background: The inflammatory macrophage response contributes to severe Ebola virus disease, with liver and lung injury in humans.

Objective: We sought to further define the activation status of hepatic and pulmonary macrophage populations in Ebola virus disease.

Methods: We compared liver and lung tissue from terminal Ebola virus (EBOV)-infected and uninfected control cynomolgus macaques challenged via the conjunctival route. Gene and protein expression was quantified using the nCounter and GeoMx Digital Spatial Profiling platforms. Macrophage phenotypes were further quantified by digital pathology analysis.

Results: Hepatic macrophages in the EBOV-infected group demonstrated a mixed inflammatory/non-inflammatory profile, with upregulation of CD163 protein expression, associated with macrophage activation syndrome. Hepatic macrophages also showed differential expression of gene sets related to monocyte/macrophage differentiation, antigen presentation, and T cell activation, which were associated with decreased MHC-II allele expression. Moreover, hepatic macrophages had enriched expression of genes and proteins targetable with known immunomodulatory therapeutics, including S100A9, IDO1, and CTLA-4. No statistically significant differences in M1/M2 gene expression were observed in hepatic macrophages compared to controls. The significant changes that occurred in both the liver and lung were more pronounced in the liver.

Conclusion: These data demonstrate that hepatic macrophages in terminal conjunctivally challenged cynomolgus macaques may express a unique inflammatory profile compared to other macaque models and that macrophage-related pharmacologically druggable targets are expressed in both the liver and the lung in Ebola virus disease.

Keywords: CD163; Ebola; IDO1; MAC387; liver; lung; macaque; macrophage.


Conflict of interest statement

The authors declare that the research was conducted in the absence of any commercial or financial relationships that could be construed as a potential conflict of interest.

Figures

Figure 1
Figure 1
Liver injury in fatal cynomolgus macaque model of EBOV infection includes hepatocellular injury and mononuclear cell accumulation. (A) Representative low-magnification images of hematoxylin and eosin-stained liver from uninfected control and EBOV-infected cynomolgus macaques at the time of euthanasia. (B) Representative high-magnification images of hematoxylin and eosin-stained liver lobule and portal tract from uninfected control and EBOV-infected cynomolgus macaques at the time of euthanasia. n=5 macaques/group.
Figure 2
Figure 2
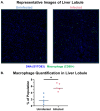
Macrophage accumulation is observed in the livers of EBOV-infected cynomolgus macaques. (A) Representative images of the lobular regions of interest analyzed using GeoMx DSP in uninfected and infected macaques. These images show macrophages (CD68+ cells, Green), and nuclei (Syto83, Blue). (B) Quantification of the percentage of macrophages (CD68+ cells) in the lobular region of interest populations. Mann-Whitney test with Benjamini, Krieger, and Yekutieli correction for multiple comparisons (False Discovery Rate 5%) was performed between the groups (EBOV-infected macaques (n=5), uninfected macaques (n=5) (*p<0.05).
Figure 3
Figure 3
Multiplex spectral imaging microscopy of macrophage populations in the liver. (A) Representative Images (20X) of multiplex panel in the liver of uninfected and infected macaques. (B) Between-groups comparison of macrophage and EBOV (VP35) markers by positive tissue area. Mann-Whitney Test with Benjamini, Krieger, and Yekutieli correction for multiple comparisons (False Discovery Rate: 5%) was performed (*p<0.05, ns, not significant). (C) Representative image (20X) of necrotic foci in EBOV-infected macaques. (D) Representative image (20X) of intravascular EBOV antigen-positive cells in EBOV-infected macaques (gray dashed line: intravascular (right), parenchyma (left), white arrows: VP35+ cells), n=5 macaques/group.
Figure 4
Figure 4
EBOV-infected and uninfected macaques show differential gene expression. (A) Workflow for the extraction of RNA from formalin-fixed, paraffin-embedded liver tissue for nCounter analysis. (B) Volcano plot of genes enriched in uninfected or infected macaques. Linear regression was performed with Benjamini-Yekutieli correction for multiple comparisons (p<0.05). (C) Top 20 genes enriched in uninfected macaques. (D) Top 20 genes enriched in infected macaques. Groups: EBOV-infected macaques (n=5), uninfected macaques (n=5). Created in Biorender.com.
Figure 5
Figure 5
In situ protein and whole transcriptome panel analysis of liver tissue, including macrophages, from uninfected and EBOV-infected cynomolgus macaques using GeoMx Digital Spatial profiling technology. (A) Outline of sample preparation, GeoMx DSP procedure, and data analysis. (B) Whole slide scan of tissue microarray showing the regions of interest selected for analysis on each tissue. (C) Representative images of region of interest segmentation for GeoMx DSP analysis. Created in Biorender.com.
Figure 6
Figure 6
Liver region of interest populations predicted by cell deconvolution in uninfected and infected macaques. Cell deconvolution of the whole transcriptome GeoMx data using a normal human liver cell library was performed for the (A) macrophage (CD68+) portion of the lobular regions of interest, (B) non-macrophage (CD68-) portion of the lobular regions of interest, and (C) portal tract regions of interest. Median plotted with data points. Mann-Whitney Test with Benjamini, Krieger, and Yekutieli correction for multiple comparisons (False Discovery Rate: 5%) was performed (no statistically significant differences identified, threshold of p<0.05). Groups: EBOV-infected (n=5) and uninfected macaques (n=5).
Figure 7
Figure 7
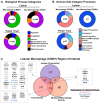
Differential expression of antigen presentation, monocyte/macrophage, and T cell gene sets in hepatic macrophage (CD68+) regions of interest in EBOV-infected macaques. (A) Differentially expressed gene set categories by region of interest type identified by Global Test analysis (the numbers in the center of each circle represent the total number of differentially expressed gene sets). (B) Differentially expressed gene set sub-categories within the Immune category. Results of Global Test analysis within the Immune category (the numbers in the center of each circle represent the total number of differentially expressed gene sets) (C) Differentially expressed genes within the antigen presentation, monocyte/macrophage differentiation, and T cell activity gene set categories in the lobular macrophage (CD68+) region of interest (No Data: not measured in GeoMx assay but present in Gene Ontology gene sets). Individual gene color coding was done according to the results of the GeoMx whole transcriptome analysis comparing EBOV-infected macaques (n=5) to uninfected macaques (n=5) (see Figure 8 ).
Figure 8
Figure 8
Identification of macrophage and T cell-related genes/proteins enriched in the liver of EBOV-infected cynomolgus macaques for which there are commercially available therapeutics. (A) Volcano plot of genes enriched in uninfected or infected macaques, with the three most enriched genes being labelled in each category, from the whole transcriptome analysis. (B) Volcano plot of proteins enriched in uninfected or infected macaques. Mann-Whitney test with Benjamini, Krieger, and Yekutieli correction for multiple comparisons (False Discovery Rate: 5%) (p<0.05) performed on the regions of interest from macaques in the uninfected and infected groups (for the whole transcriptome panel, only genes exceeding the relative expression thresholds were statistically analyzed). Groups: EBOV-infected macaques (n=5), uninfected macaques (n=5).

References

    1. Kuhn JH, Amarasinghe GK, Perry DL. Filoviridae. In: Howley PM, Knipe DM, editors. Fields virology: emerging viruses, 7th, vol. 1 . Lippincott Williams & Wilkins, Philadelphia: (2021). p. 449–503.
    1. Jacob ST, Crozier I, Fischer WA, Hewlett A, Kraft CS, Vega MA, et al. . Ebola virus disease. Nat Rev Dis Primers. (2020) 6:13. doi: 10.1038/s41572-020-0147-3 - DOI - PMC - PubMed
    1. Malvy D, McElroy AK, de Clerck H, Günther S, van Griensven J. Ebola virus disease. Lancet [Internet]. (2019) 393:936–48. doi: 10.1016/S0140-6736(18)33132-5 - DOI - PubMed
    1. Nicastri E, Kobinger G, Vairo F, Montaldo C, Mboera LEG, Ansunama R, et al. . Ebola virus disease: epidemiology, clinical features, management, and prevention. Infect Dis Clin North Am [Internet]. (2019) 33:953–76. doi: 10.1016/j.idc.2019.08.005 - DOI - PubMed
    1. Liu CH, Hu YT, Wong SH, Lin LT. Therapeutic strategies against ebola virus infection. Viruses. (2022) 14:579. doi: 10.3390/v14030579 - DOI - PMC - PubMed

MeSH terms