. 2024 Nov 20:18:1448161.
doi: 10.3389/fninf.2024.1448161. eCollection 2024.

Systems Neuroscience Computing in Python (SyNCoPy): a python package for large-scale analysis of electrophysiological data

Affiliations

Systems Neuroscience Computing in Python (SyNCoPy): a python package for large-scale analysis of electrophysiological data

Gregor Mönke et al. Front Neuroinform. .

Abstract

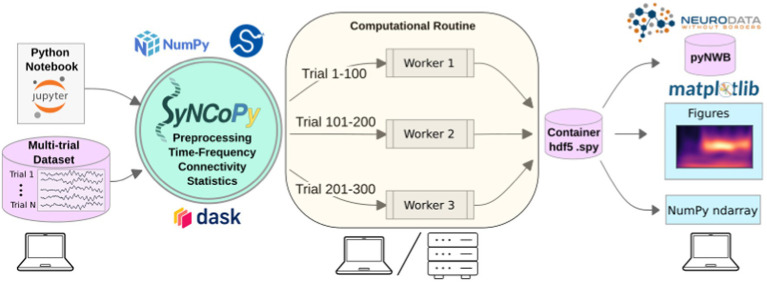
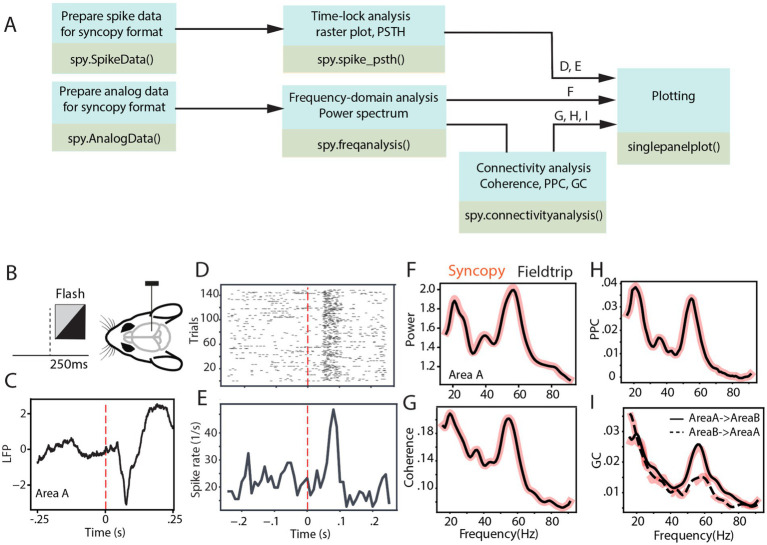
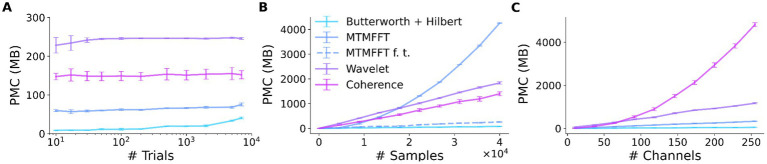
We introduce an open-source Python package for the analysis of large-scale electrophysiological data, named SyNCoPy, which stands for Systems Neuroscience Computing in Python. The package includes signal processing analyses across time (e.g., time-lock analysis), frequency (e.g., power spectrum), and connectivity (e.g., coherence) domains. It enables user-friendly data analysis on both laptop-based and high-performance computing systems. SyNCoPy is designed to facilitate trial-parallel workflows (parallel processing of trials), making it an ideal tool for large-scale analysis of electrophysiological data. Based on parallel processing of trials, the software can support very large-scale datasets via innovative out-of-core computation techniques. It also provides seamless interoperability with other standard software packages through a range of file format importers and exporters and open file formats. The naming of the user functions closely follows the well-established FieldTrip framework, which is an open-source MATLAB toolbox for advanced analysis of electrophysiological data.

Keywords: Granger causality spectra; big data; coherence spectra; electroencephalography (EEG); local field potential (LFP); magnetoencephalography (MEG); power spectra; spike train.


Conflict of interest statement

PF has a patent on thin-film electrodes and is a member of the Advisory Board of CorTec GmbH (Freiburg, Germany). The remaining authors declare that the research was conducted in the absence of any commercial or financial relationships that could be construed as a potential conflict of interest.

Figures

Figure 1
Figure 1
SyNCoPy architecture and a typical setup for parallel processing.
Figure 2
Figure 2
SyNCoPy analysis for an example of electrophysiological dataset. (A) Example analysis pipelines using SyNCoPy functions to process electrophysiological data. The different pipelines result in the plots shown in panels (D-I), as indicated above the arrows feeding into the final plotting routine. (B) During the presentation of the full-field flash stimulus lasting for 250 ms, LFP and spiking activity were recorded from different brain areas of awake mice. (C) The averaged LFP response over trials and channels of Area A, time-locked to stimulus onset. (D,E) Time-lock raster plot (D) and peristimulus time histogram (E) of spiking activity of 150 trials in a sample neuron. (F) Spectra of LFP power ratio between stimulus and baseline period in the frequency range of 1–95 Hz averaged over trials and channels of Area A. The black line reflects the FieldTrip result, and the red-shaded line corresponds to the SyNCoPy result. (G-I) Same as F but for coherence between LFPs of Area A and Area B (G), pairwise phase consistency between LFPs of Area A and Area B (H), Granger causality between the LFPs of Area A and Area B (I). Black lines are FieldTrip results, and red-shaded lines are SyNCoPy results. The solid line is feedforward, and the dashed line is feedback direction (I).
Figure 3
Figure 3
SyNCoPy memory efficiency. Peak memory consumption (PMC) as a function of input size for selected algorithms. The PMC measurements are based on synthetic data. The starting dataset size is 10 trials, 5,000 samples, and 50 channels. Each data point shows the PMC mean and standard deviation of 20 independent runs. (A) PMC is largely independent of the number of trials. The total size of the test dataset varied over almost three orders of magnitude (10 trials to 7,000 trials, ~10 MB to 7GB), while the size of a single trial was kept constant at 1 MB. (B) PMC depends on the number of samples per trial and the algorithm. The number of samples (length of the signals) varied from 10 to 40,000. (C) PMC depends on the number of channels and the algorithm. Channel numbers varied from 2 to 250.

Similar articles

References

    1. Dalal S. S., Zumer J. M., Guggisberg A. G., Trumpis M., Wong D. D. E., Sekihara K., et al. . (2011). MEG/EEG source reconstruction, statistical evaluation, and visualization with NUTMEG. Comput. Intell. Neurosci. 2011:758973. doi: 10.1155/2011/758973 - DOI - PMC - PubMed
    1. Delorme A., Makeig S. (2004). EEGLAB: an open source toolbox for analysis of single-trial EEG dynamics including independent component analysis. J. Neurosci. Methods 134, 9–21. doi: 10.1016/j.jneumeth.2003.10.009 - DOI - PubMed
    1. Delorme A., Mullen T., Kothe C., Akalin Acar Z., Bigdely-Shamlo N., Vankov A., et al. . (2011). EEGLAB, SIFT, NFT, BCILAB, and ERICA: new tools for advanced EEG processing. Comput. Intell. Neurosci. 2011:e130714. doi: 10.1155/2011/130714 - DOI - PMC - PubMed
    1. Denker M., Köhler C., Jurkus R., Kern M., Kurth A. C., Kleinjohann A., et al. . (2023). Elephant 0.13.0. Zenodo. doi: 10.5281/zenodo.8144467 - DOI
    1. Dhamala M., Rangarajan G., Ding M. (2008). Analyzing information flow in brain networks with nonparametric granger causality. NeuroImage 41, 354–362. doi: 10.1016/j.neuroimage.2008.02.020 - DOI - PMC - PubMed

LinkOut - more resources