. 2025 Jan 31;91(1):e0175924.
doi: 10.1128/aem.01759-24. Epub 2024 Dec 5.

Transcriptional delineation of polysaccharide utilization loci in the human gut commensal Segatella copri DSM18205 and co-culture with exemplar Bacteroides species on dietary plant glycans

Affiliations

Transcriptional delineation of polysaccharide utilization loci in the human gut commensal Segatella copri DSM18205 and co-culture with exemplar Bacteroides species on dietary plant glycans

Deepesh Panwar et al. Appl Environ Microbiol. .

Abstract

There is growing interest in members of the genus Segatella (family Prevotellaceae) as members of a well-balanced human gut microbiota (HGM). Segatella are particularly associated with the consumption of a diet rich in plant polysaccharides comprising dietary fiber. However, understanding of the molecular basis of complex carbohydrate utilization in Segatella species is currently incomplete. Here, we used RNA sequencing (RNA-seq) of the type strain Segatella copri DSM 18205 (previously Prevotella copri CB7) to define precisely individual polysaccharide utilization loci (PULs) and associated carbohydrate-active enzymes (CAZymes) that are implicated in the catabolism of common fruit, vegetable, and grain polysaccharides (viz. mixed-linkage β-glucans, xyloglucans, xylans, pectins, and inulin). Although many commonalities were observed, several of these systems exhibited significant compositional and organizational differences vis-à-vis homologs in the better-studied Bacteroides (sister family Bacteroidaceae), which predominate in post-industrial HGM. Growth on β-mannans, β(1, 3)-galactans, and microbial β(1, 3)-glucans was not observed, due to an apparent lack of cognate PULs. Most notably, S. copri is unable to grow on starch, due to an incomplete starch utilization system (Sus). Subsequent transcriptional profiling of bellwether Ton-B-dependent transporter-encoding genes revealed that PUL upregulation is rapid and general upon transfer from glucose to plant polysaccharides, reflective of de-repression enabling substrate sensing. Distinct from previous observations of Bacteroides species, we were unable to observe clearly delineated substrate prioritization on a polysaccharide mixture designed to mimic in vitro diverse plant cell wall digesta. Finally, co-culture experiments generally indicated stable co-existence and lack of exclusive competition between S. copri and representative HGM Bacteroides species (Bacteroides thetaiotaomicron and Bacteroides ovatus) on individual polysaccharides, except in cases where corresponding PULs were obviously lacking.

Importance: There is currently a great level of interest in improving the composition and function of the human gut microbiota (HGM) to improve health. The bacterium Segatella copri is prevalent in people who eat plant-rich diets and is therefore associated with a healthy lifestyle. On one hand, our study reveals the specific molecular systems that enable S. copri to proliferate on individual plant polysaccharides. On the other, a growing body of data suggests that the inability of S. copri to grow on starch and animal glycans, which dominate in post-industrial diets, as well as host mucin, contributes strongly to its displacement from the HGM by Bacteroides species, in the absence of direct antagonism.

Keywords: Bacteroidaceae; Bacteroides; Prevotella; Prevotellaceae; Segatella; carbohydrate-active enzymes; dietary fiber; human gut microbiota; plant cell wall; polysaccharide utilization locus.


Conflict of interest statement

The authors declare no conflict of interest.

Figures

Fig 1
Fig 1
Hemicellulose-associated polysaccharide utilization loci and CAZyme clusters in ScDSM18205. Per-nucleotide base coverage by RNAseq for cultures grown on the indicated carbohydrates is indicated below each gene locus. Genes are colored according to the key, based on predicted protein annotations. Predicted signal peptides are denoted on individual genes as follows: •, signal peptidase I cleavage; ••, signal peptidase II cleavage (N-terminal Cys, lipidated).
Fig 2
Fig 2
Pectin-associated polysaccharide utilization loci and CAZyme clusters in ScDSM18205. Per-nucleotide base coverage by RNA-seq for cultures grown on the indicated carbohydrates is indicated below each gene locus. Genes are colored according to the key, based on predicted protein annotations. Predicted signal peptides are denoted on individual genes as follows: •, signal peptidase I cleavage; ••, signal peptidase II cleavage (N-terminal Cys, lipidated).
Fig 3
Fig 3
Storage polysaccharide-associated polysaccharide utilization loci in ScDSM18205. (A) Inulin PUL. Per-nucleotide base coverage by RNA-seq for cultures grown on the indicated carbohydrates is indicated below each gene locus. Genes are colored according to the key, based on predicted protein annotations. (B) Predicted starch utilization system (Sus) genes in S. copri DSM18205 versus B. thetaiotaomicron sus homologs. Predicted signal peptides are denoted on individual genes as follows: •, signal peptidase I cleavage; ••, signal peptidase II cleavage (N-terminal Cys, lipidated).
Fig 4
Fig 4
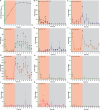
Growth kinetics and temporal expression of ScDSM18205 tbdt genes in mixed-linkage β-glucan and xyloglucan as sole polysaccharide sources. (A) Growth on mixed-linkage β-glucan (2.5 g/L). (B and C) Transcript levels of cognate mixed-linkage β-glucan (NQ544_01015) and xyloglucan (NQ544_02170) tbdt genes in response to mixed-linkage β-glucan. (D) Growth on xyloglucan (2.5 g/L). (E and F) Transcript levels of cognate xyloglucan (NQ544_02170) and mixed-linkage β-glucan (NQ544_01015) tbdt genes in response to xyloglucan. All transcript level changes are relative to levels prior to exposure to the polysaccharide ( = 0). Error bars represent the SEM of three technical replicates from a single biological sample. Asterisks indicate data points with upregulation significantly greater than a basal level (set at 10-fold), as determined by an unpaired t test. Background colors delineate lag (yellow), early exponential (green), and exponential (salmon) growth phases. For extended-duration growth profiles, see Figure S4.
Fig 5
Fig 5
Growth kinetics and temporal expression of ScDSM18205 tbdt genes in mYCFA supplemented with a mixture of dietary plant polysaccharides. The medium contains equal concentrations of barley mixed-linkage β-glucan, tamarind xyloglucan, corn xylan oligosaccharides, citrus homogalacturonan, potato rhamnogalacturonan I, sugar beet arabinan, chicory inulin, and soluble starch (0.625 g/L each, total concentration 5 g/L). (A) Growth kinetics. Individual data are means of two biological replicates. (B-L) Temporal expression of individual polysaccharide-associated tbdt genes. All transcript level changes are relative to time zero, that is, prior to transfer to the mixture. Error bars represent the SEM of three technical replicates from a single biological sample. Asterisks indicate data points with upregulation significantly greater than a basal level (set at 10-fold), as determined by an unpaired t test. Background colors delineate early exponential (green), exponential (salmon), and stationary (grey) growth phases.
Fig 6
Fig 6
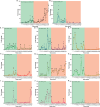
Temporal expression of tbdt transcripts of ScDSM18205 in mYCFA supplemented with polysaccharide mixture (PM). (A-K) Temporal expression of individual tbdt was measured by RT-qPCR during growth on a mixture of eight polysaccharides that represent common complex plant-based dietary carbohydrates. All transcript level changes are relative to time zero prior to exposure to the PM. Error bars represent the SEM of two biological and two technical replicates. Asterisks indicate data points with upregulation significantly greater than a basal level (set at 10-fold), as determined by an unpaired t test. Background colors delineate early exponential (green) and exponential (salmon) growth phases.
Fig 7
Fig 7
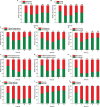
Relative abundance of ScDSM18205 (Sc) and B. ovatus (Bo) co-cultured on defined carbohydrate sources in mYCFA. Abundances of each species on different polysaccharides were calculated using RT-qPCR with species-specific 16 s rRNA gene primers. Error bars represent the SD of the means of two biological replicates. Statistically significant differences were calculated using a two-tailed unpaired Student’s t test. *, P < 0.05; **, P < 0.01; ns, not significant (P > 0.05).
Fig 8
Fig 8
Relative abundance of ScDSM18205 (Sc) and B. thetaiotaomicron (Bt) co-cultured on defined carbohydrate sources in mYCFA. Abundances of each species on different polysaccharides were calculated using RT-qPCR with species-specific 16 s rRNA gene primers. Error bars represent the SD of the means of two biological replicates. Statistically significant differences were calculated using a two-tailed unpaired Student’s t test. *, P < 0.05; **, P < 0.01; ns, not significant (P > 0.05).

References

    1. van de Guchte M, Blottière HM, Doré J. 2018. Humans as holobionts: implications for prevention and therapy. Microbiome 6:81. doi:10.1186/s40168-018-0466-8 - DOI - PMC - PubMed
    1. Flint HJ, Scott KP, Louis P, Duncan SH. 2012. The role of the gut microbiota in nutrition and health. Nat Rev Gastroenterol Hepatol 9:577–589. doi:10.1038/nrgastro.2012.156 - DOI - PubMed
    1. Sonnenburg JL, Bäckhed F. 2016. Diet-microbiota interactions as moderators of human metabolism. Nature New Biol 535:56–64. doi:10.1038/nature18846 - DOI - PMC - PubMed
    1. Makki K, Deehan EC, Walter J, Bäckhed F. 2018. The impact of dietary fiber on gut microbiota in host health and disease. Cell Host Microbe 23:705–715. doi:10.1016/j.chom.2018.05.012 - DOI - PubMed
    1. Rinninella E, Raoul P, Cintoni M, Franceschi F, Miggiano GAD, Gasbarrini A, Mele MC. 2019. What is the healthy gut microbiota composition? A changing ecosystem across age, environment, diet, and diseases. Microorganisms 7:22. doi:10.3390/microorganisms7010014 - DOI - PMC - PubMed

Substances

Supplementary concepts

LinkOut - more resources