. 2024 Dec 5:13:RP100569.
doi: 10.7554/eLife.100569.

β-1,6-Glucan plays a central role in the structure and remodeling of the bilaminate fungal cell wall

Affiliations

β-1,6-Glucan plays a central role in the structure and remodeling of the bilaminate fungal cell wall

Clara Bekirian et al. Elife. .

Abstract

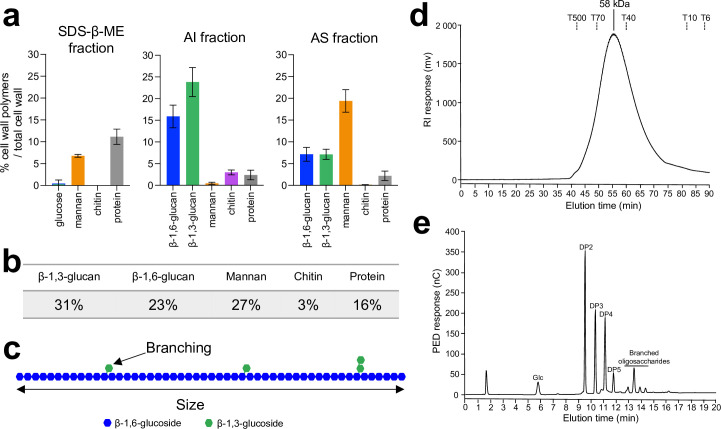
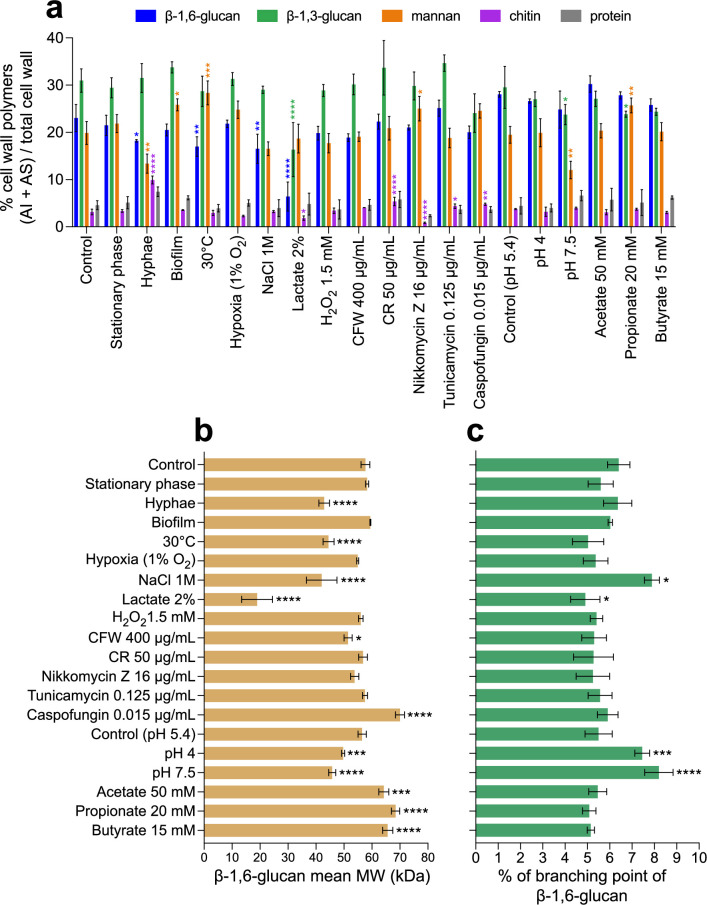
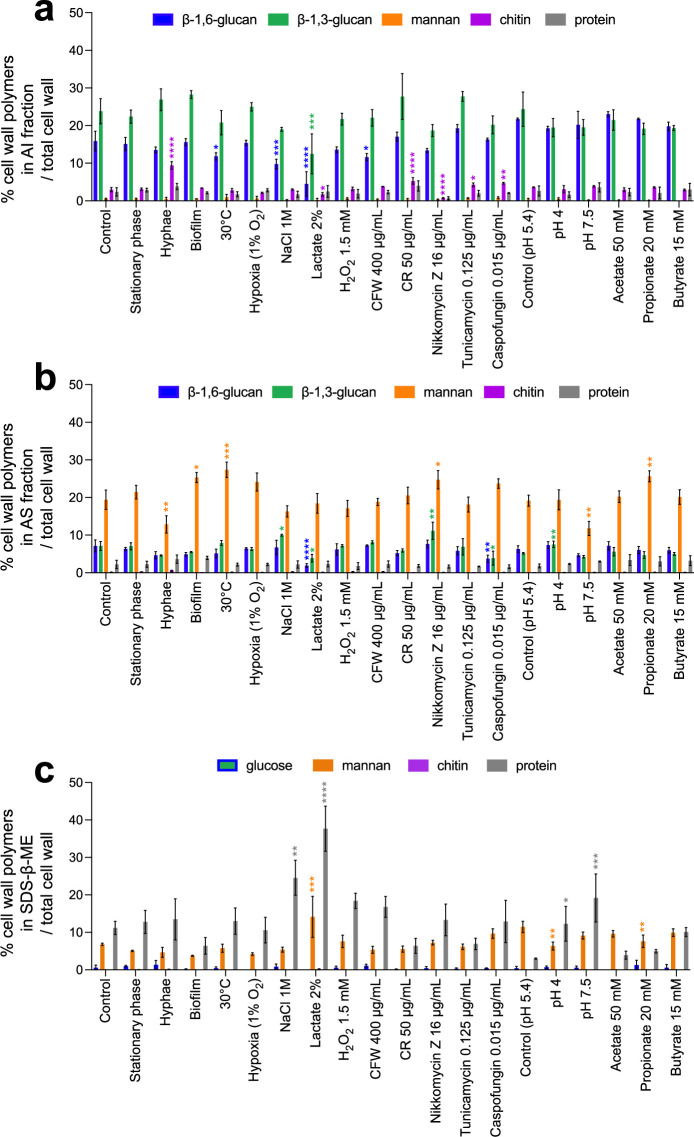
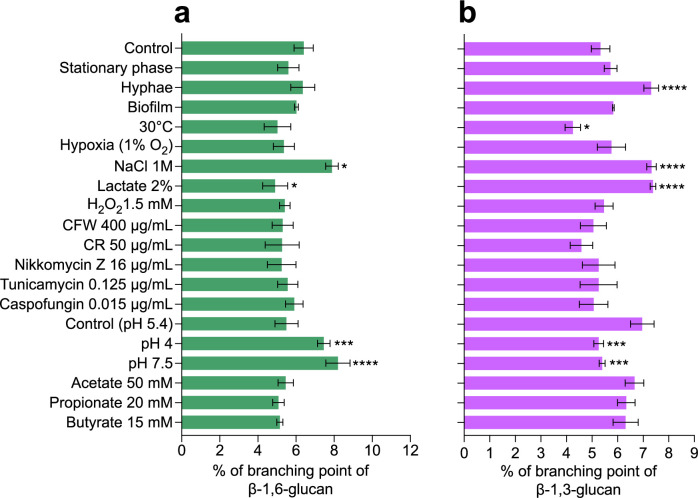
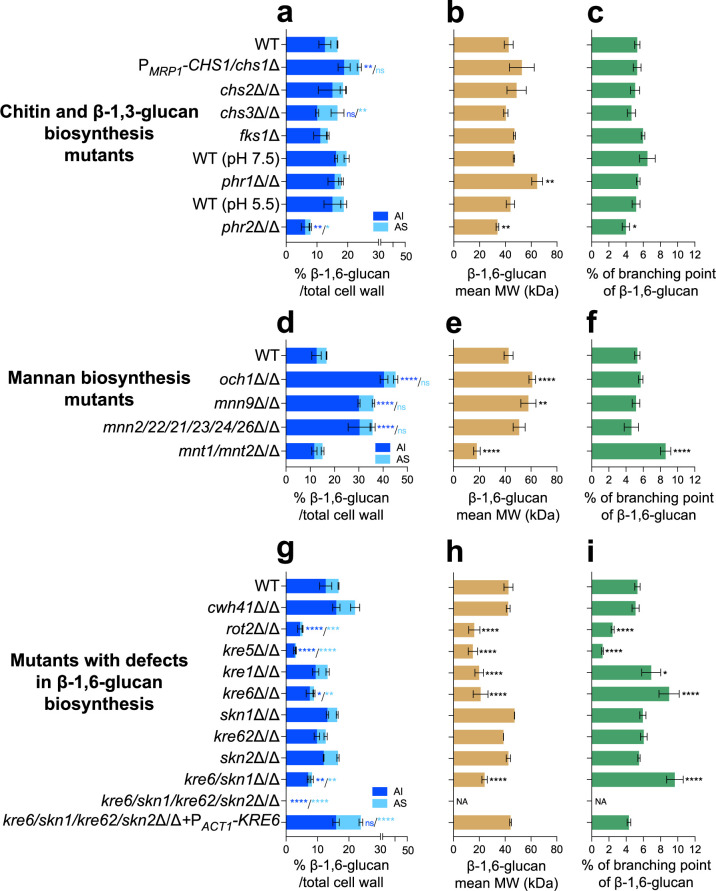
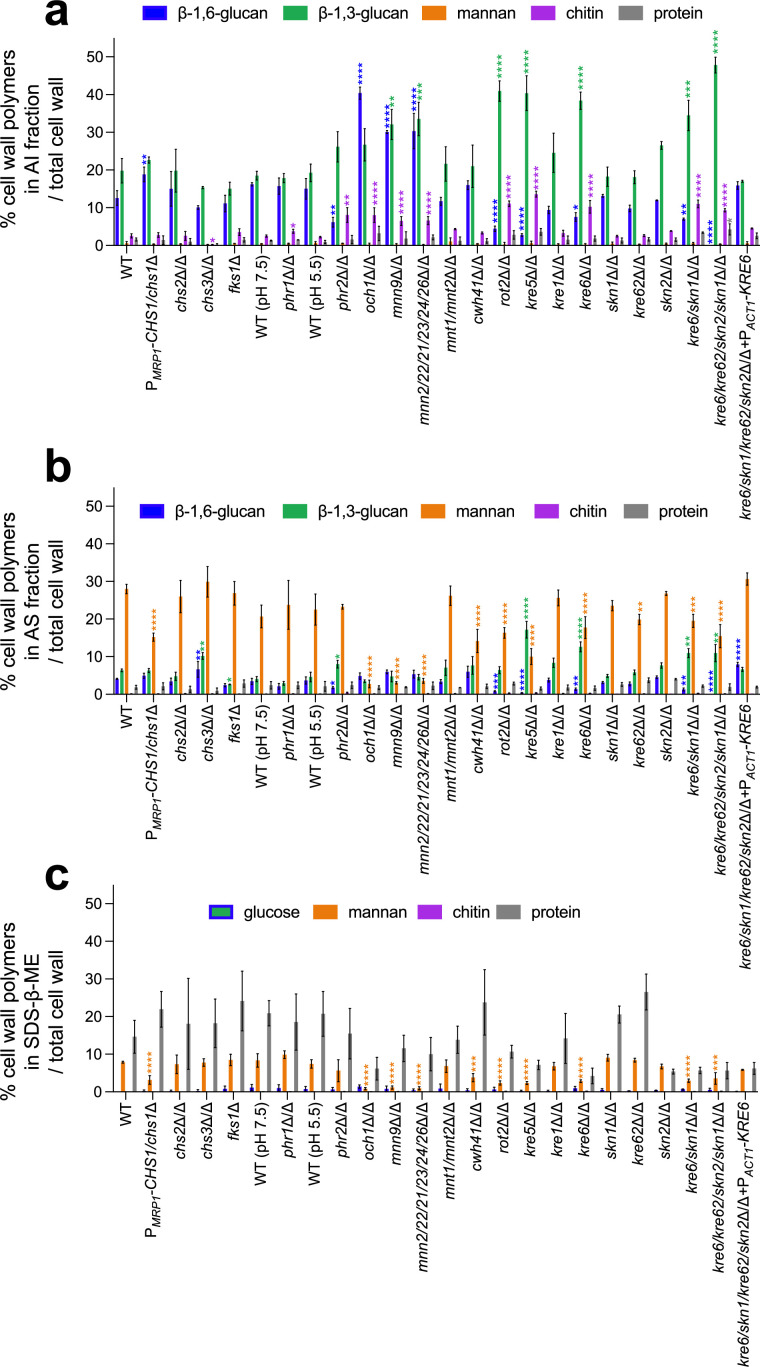
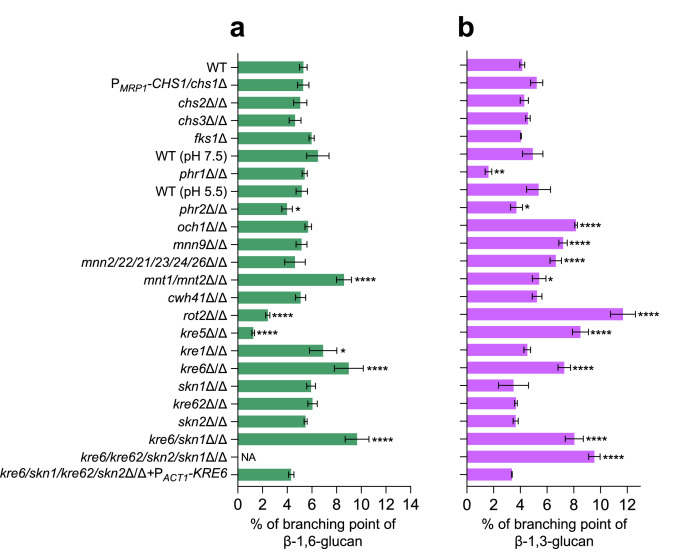
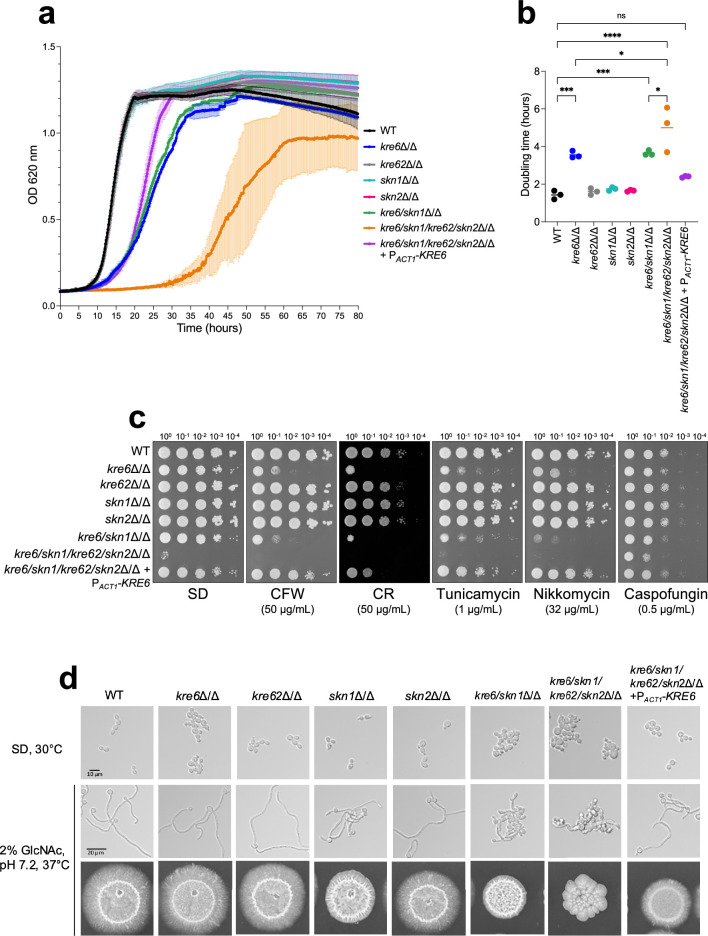
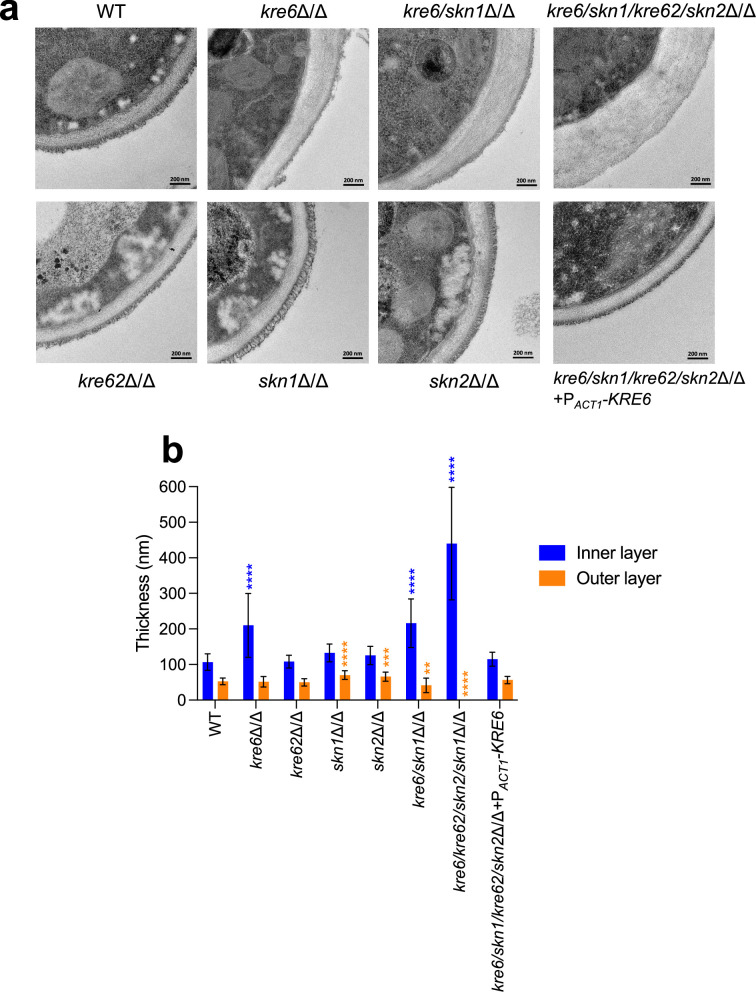
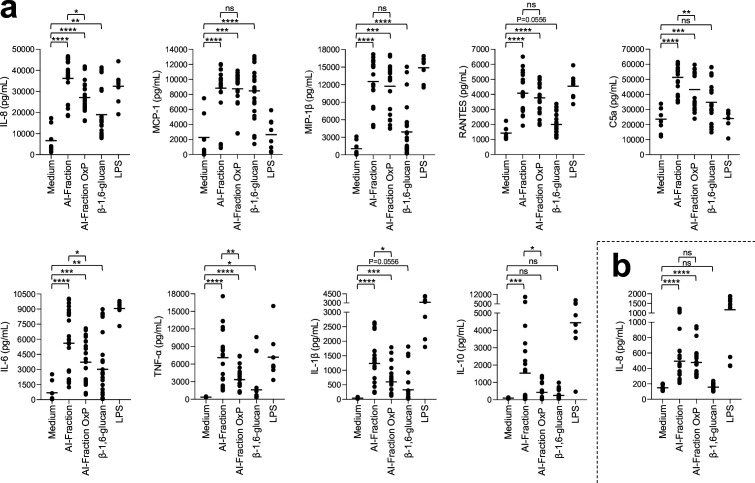
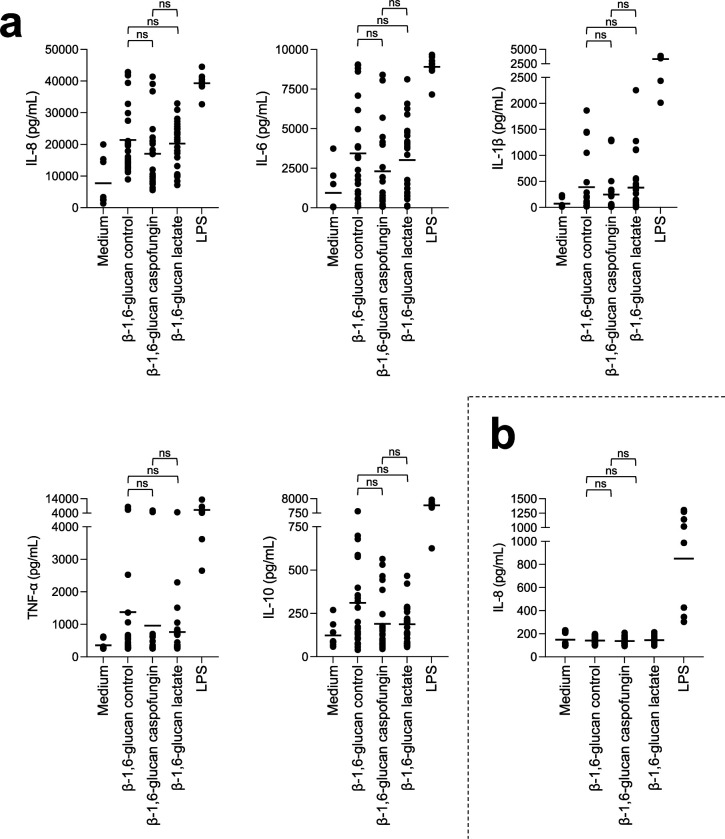
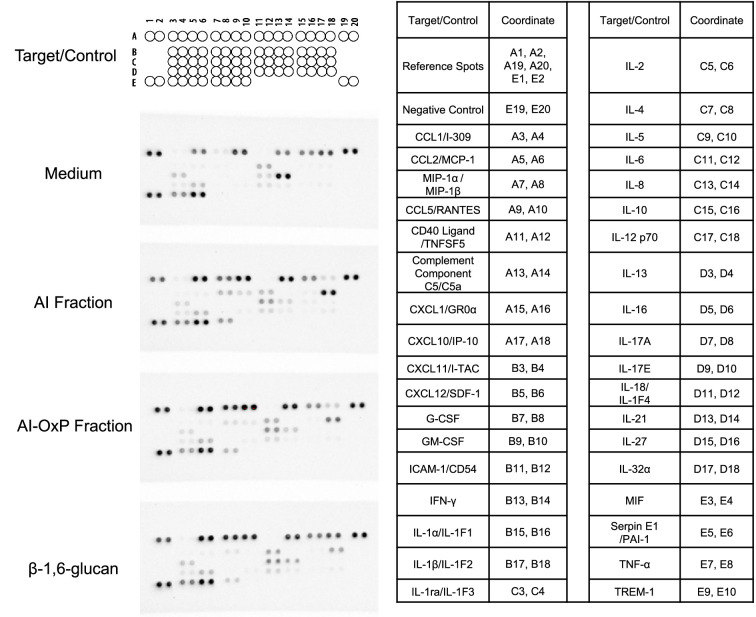
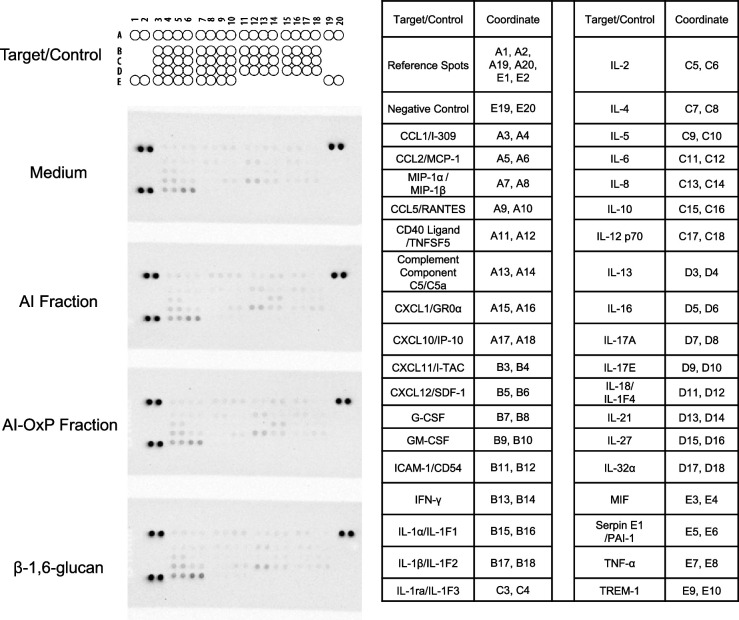
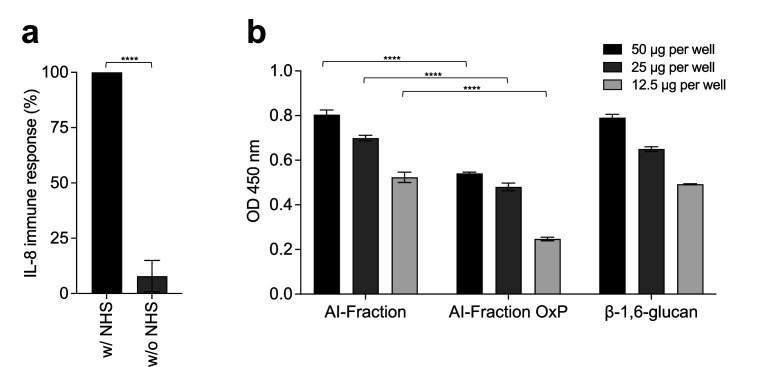
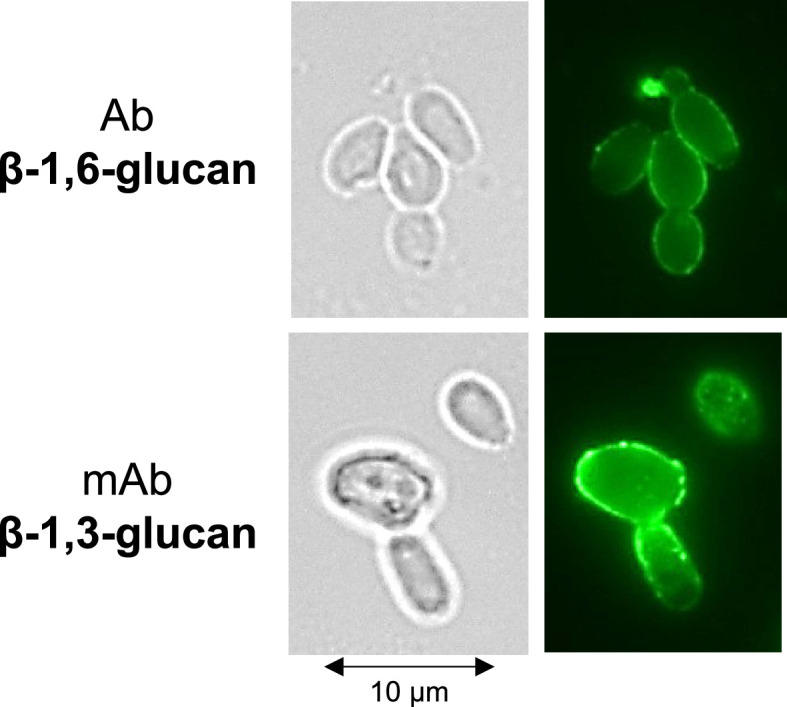
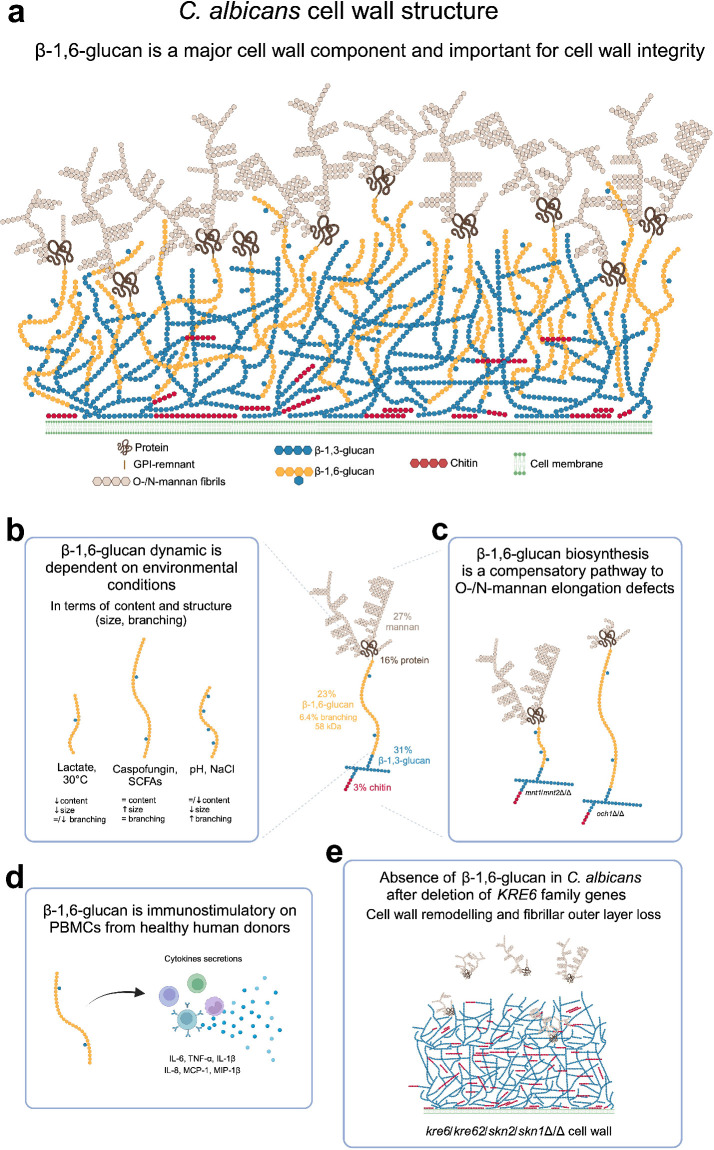
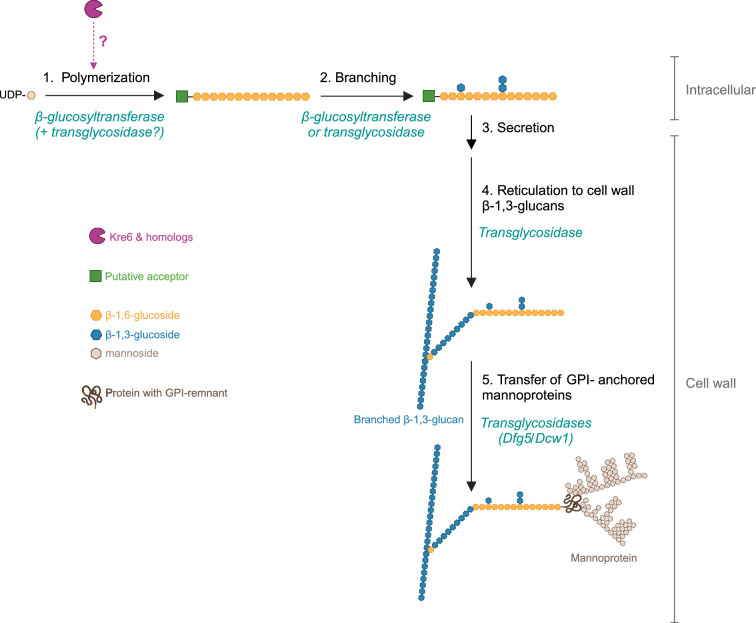
The cell wall of human fungal pathogens plays critical roles as an architectural scaffold and as a target and modulator of the host immune response. Although the cell wall of the pathogenic yeast Candida albicans is intensively studied, one of the major fibrillar components in its cell wall, β-1,6-glucan, has been largely neglected. Here, we show that β-1,6-glucan is essential for bilayered cell wall organization, cell wall integrity, and filamentous growth. For the first time, we show that β-1,6-glucan production compensates the defect in mannan elongation in the outer layer of the cell wall. In addition, β-1,6-glucan dynamics are also coordinated by host environmental stimuli and stresses with wall remodeling, where the regulation of β-1,6-glucan structure and chain length is a crucial process. As we point out that β-1,6-glucan is exposed at the yeast surface and modulate immune response, β-1,6-glucan must be considered a key factor in host-pathogen interactions.

Keywords: Candida albicans; KRE6; biochemistry; cell wall; chemical biology; immune response; infectious disease; microbiology; β-1,6-Glucan.


Conflict of interest statement

CB, IV, SB, CS, JG, MC, TM, NG, VA, Cd, TF No competing interests declared

Figures

Figure 1.
Figure 1.. Analysis of C. albicans cell wall β-1,6-glucans.
(a) Percentages of cell wall polymers on total cell wall, distributed by fractions: sodium-dodecyl-sulfate-β-mercaptoethanol (SDS-β-ME), alkali-insoluble (AI), and alkali-soluble (AS). Cells were grown in synthetic dextrose (SD) medium at 37°C. Means and standard deviations were calculated from three independent experiments. (b) Table of the mean percentages of each polymer in the cell wall from three independent experiments. (c) Diagram of β-1,6-glucan structure. In blue are represented glucose residues linked in β-1,6 and in green glucose residues linked in β-1,3. According to nuclear magnetic resonance (NMR) analysis and high-performance anion exchange chromatography (HPAEC) after endo-β-1,6-glucanase digestion (Figure 1—figure supplement 1), based on three independent experiments, an average of 6.4% (± 0.5%) of glucose units of the main chain are substituted by a single glucose residue (88–90%) or a laminaribiose (10–12%). (d) Gel filtration analysis on a Superdex 200 column of β-1,6-glucan released by endo-β-1,3-glucanase digestion. The column was calibrated with dextrans (Tx: × kDa). (e) HPAEC analysis of the digestion products of the AI fraction treated with an endo-β-1,6-glucanase. Chromatographs in (d) and (e) are representative of three independent experiments. PED, pulsed electrochemical detector; nC, nanocoulombs; RI, refractive index; mV, millivolt; DP, degree of polymerization; Glc, glucose.
Figure 1—figure supplement 1.
Figure 1—figure supplement 1.. 1H and 13C NMR resonance assignments, 3JH1/H2 and 1JH1/C1 coupling constants of the monosaccharide residues of cell wall β-1,6-glucan purified from the alkali-insoluble (AI) fraction.
Chemical shifts are expressed in ppm and coupling constants in Hz.
Figure 1—figure supplement 2.
Figure 1—figure supplement 2.. Cell disruption is essential to eliminate glycogen in alkali-insoluble (AI) and alkali-soluble (AS) fractions.
High-performance anion exchange chromatography (HPAEC) analysis of oligosaccharides released by α-amylase enzymatic digestion of AI and AS fractions. (a) Control: glycogen, (b) AI fraction obtained after biomass cell disruption, (c) AI fraction from biomass with no cell disruption, (d) AS fraction obtained after biomass cell disruption, and (e) AS fraction from biomass with no cell disruption. PED, pulsed electrochemical detector; nC, nanocoulomb.
Figure 1—figure supplement 3.
Figure 1—figure supplement 3.. Quantification methods of β-1,6-glucans in alkali-insoluble (AI) fractions.
(a) The specific oxidation of β-1,6-glucans of the AI fraction by periodate was used for quantification. Briefly, IO4Na splits bonds between vivinal carbons bearing hydroxyl groups (only present in β-1,6-glucoside), which leads to the formation of aldehydes, which can react with 4-hydroxybenzhydrazide (PAHBAH) to form a yellow compound measurable by absorbance at OD = 405 nm. (b) Specificity of the periodate oxidation method for β-1,6-glucans (pustulan). The method is specific for β-1,6-glucans (pustulan and AI fraction) and inactive on β-1,3-glucans (curdlan). (c) Linearity of β-1,6-glucan assay after periodate oxidation. We showed that the response of the method described in (a) is proportional from 0 to 20 µg of pustulan.
Figure 2.
Figure 2.. Comparative analyses of cell wall β-1,6-glucans produced in various environmental conditions.
(a) Percentages of cell wall polymers (alkali-insoluble [AI] + alkali-soluble [AS] fractions) on total cell wall. Cells were grown in liquid synthetic medium at 37°C under different conditions, as specified in ‘Materials and methods’. (b) β-1,6-Glucan mean molecular weight (MW). Average molecular weight was estimated by gel filtration chromatography on a Superdex 200 column. (c) Branching rate of β-1,6-glucans. Branching rate was determined by high-performance anion exchange chromatography (HPAEC) after digestion of the AI fraction by an endo-β-1,6-glucanase (% expressed as number of glucose units of the main chain that are substituted by a side chain). For (a–c), means and standard deviations from three independent replicate experiments are shown. All data were compared to the control conditions and were analyzed by one-way ANOVA with Dunnett’s multiple comparisons test: *p<0.05; **p<0.01; ***p<0.001; ****p<0.0001.
Figure 2—figure supplement 1.
Figure 2—figure supplement 1.. Global cell wall composition produced by C. albicans in different environmental conditions.
Results are represented as the percentage of each polymer on total cell wall in alkali-insoluble (AI) fraction (a), alkali-soluble (AS) fraction (b), and sodium-dodecyl-sulfate-β-mercaptoethanol (SDS-β-ME) fraction (c). Means and standard deviations were obtained from three independent replicate experiments. All data were compared to the control conditions and were analyzed using one-way ANOVA with Dunnett’s multiple comparisons test: *p<0.05; **p<0.01; ***p<0.001; ****p<0.0001.
Figure 2—figure supplement 2.
Figure 2—figure supplement 2.. Branching rates of β-1,6-glucans and β-1,3-glucans produced by C. albicans under various environmental conditions.
(a) Branching rate of β-1,6-glucans from alkali-insoluble (AI) fraction. The branching rate was estimated by high-performance anion exchange chromatography (HPAEC) after digestion by an endo-β-1,6-glucanase. (b) Branching rate of β-1,3-glucans from AI fraction, The branching rate was estimated by HPAEC after digestion by an endo-β-1,3-glucanase. Means and standard deviations from three independent replicate experiments are shown. All data were compared to the control conditions and were analyzed using one-way ANOVA with Dunnett’s multiple comparisons test: *p<0.05; **p<0.01; ***p<0.001; ****p<0.0001.
Figure 3.
Figure 3.. Comparative analysis of β-1,6-glucan content and structure produced by cell wall mutants.
(a, d, g) Percentages of cell wall β-1,6-glucans (alkali-insoluble [AI] and alkali-soluble [AS] fractions) on total cell wall. (b, e, h) β-1,6-Glucans mean molecular weight (MW). (c, f, i) Branching rate of β-1,6-glucans. Cells were grown in liquid synthetic dextrose (SD) medium at 30°C. Means and standard deviations from three independent replicate experiments are shown. All data were compared to the control conditions and were analyzed by one-way ANOVA with Dunnett’s multiple comparisons test: *p<0.05; **p<0.01; ***p<0.001; ****p<0.0001; ns, nonsignificant; NA, nonapplicable.
Figure 3—figure supplement 1.
Figure 3—figure supplement 1.. Cell wall composition of C. albicans mutants.
Results are represented as the percentage of each polymer on total cell wall in alkali-insoluble (AI) fraction (a), alkali-soluble (AS) fraction (b), and sodium-dodecyl-sulfate-β-mercaptoethanol (SDS-β-ME) fraction (c). Means and standard deviations were obtained from three independent replicate experiments. All data were compared to the parental strain SC5314 and were analyzed using one-way ANOVA with Dunnett’s multiple comparisons test: *p<0.05; **p<0.01; ***p<0.001; ****p<0.0001.
Figure 3—figure supplement 2.
Figure 3—figure supplement 2.. Branching rates of β-1,6-glucans and β-1,3-glucans produced by different cell wall mutants of C. albicans.
(a) Branching rate of β-1,6-glucans from alkali-insoluble (AI) fraction. The branching rate was estimated by high-performance anion exchange chromatography (HPAEC) after digestion by an endo-β-1,6-glucanase. (b) Branching rate of β-1,3-glucans from AI fraction. The branching rate was estimated by HPAEC after digestion by an endo-β-1,3-glucanase. Means and standard deviations from three independent replicate experiments are shown. All data were compared to the control conditions and were analyzed using one-way ANOVA with Dunnett’s multiple comparisons test: *p<0.05; **p<0.01; ***p<0.001; ****p<0.0001; NA, nonapplicable.
Figure 3—figure supplement 3.
Figure 3—figure supplement 3.. Absence of β-1,6-glucans in the cell wall of the quadruple kre6/kre62/skn2/skn1Δ/Δ mutant.
High-performance anion exchange chromatography (HPAEC) analysis of oligosaccharides released by the endo-β-(1,6)-glucanase digestions of alkali-insoluble (AI) fraction of WT (a), AI fraction of kre6/kre62/skn2/skn1Δ/Δ (b), alkali-soluble (AS) fraction of WT (c), AS fraction of kre6/kre62/skn2/skn1Δ/Δ (d), and water (e). Experiments were performed in triplicates. PED, pulsed electrochemical detector; nC, nanocoulomb.
Figure 4.
Figure 4.. Phenotypic characterization of KRE6 family mutants: growth kinetics, drug susceptibility, and filamentation.
(a) Kinetic curve of all strains grown in liquid synthetic dextrose (SD) medium, 30°C. Optical density at 620 nm was measured every 10 min during 80 hr by TECAN SUNRISE. Means and standard deviations were calculated from three independent experiments. (b) Doubling time of each strain was determined from three independent replicates. Statistical analyses were performed with one-way ANOVA with Tukey’s multiple comparisons test: *p<0.05; **p<0.01; ***p<0.001; ****p<0.0001; ns, nonsignificant. (c) Spotting test of tenfold serial dilution of yeast cells of all strains on SD medium, 30°C, 48 hr, with cell wall disturbing agents (CR, Congo Red; CFW, Calcofluor White) or drugs (nikkomycin, tunicamycin, caspofungin). These results are representative of three independent experiments. Pictures were taken with a Phenobooth (Singer Instruments). (d) Filamentation assay of all strains. Top row: growth in liquid SD medium at 30°C; middle panels: growth in liquid YNB medium + 2% GlcNAc, buffered at pH 7.2 at 37°C during 6 hr. Pictures were taken using an Olympus IX 83 microscope, ×40 objective. Bottom row: cells were grown on agar YNB + 2% GlcNAc, buffered at pH 7.2, at 37°C for 6 days.
Figure 4—figure supplement 1.
Figure 4—figure supplement 1.. Control PCR control of mutants obtained in this study.
(a) Principle of PCR check done in (b) and (c). P1 and P2 are PCR diagnostic primers. ORF = KRE6, KRE62, SKN2, or SKN1. Repair Templates contain either HygB or a SAT1-Flipper cassette for selection. FRT correspond to the scar after SAT1-Flipper cassette excision. (b) Table of expected PCR bands according to mutant. (c) PCR bands obtained.
Figure 4—figure supplement 2.
Figure 4—figure supplement 2.. Control PCR of the quadruple mutant complemented for KRE6 (kre6/kre62/skn2/skn1Δ/Δ+PACT-KRE6).
KRE6 was reintegrated at the RPS1 locus under the control of ACT1 promoter, using SAT1 as a selection marker.
Figure 5.
Figure 5.. Cell wall electron microscopy observations of KRE6 simple and multiple mutants.
(a) Representative transmission electron microscopy images of the cell wall of each strains. After culture, cells were fixed and high-pressure frozen and freeze substituted with Spurr resin. Sections were cut and stained and then pictures were taken with a Tecnai Spirit 120Kv TEM microscope. Scale bar = 200 nm. (b) Measurement of the inner and outer cell wall layers of the mutants. Means and standard deviations are represented. 37–40 measurements were performed randomly on 7–13 cells. Statistical analyses were performed with one-way ANOVA with Tukey’s multiple comparisons test: *p<0.05; **p<0.01; ***p<0.001; ****p<0.0001.
Figure 6.
Figure 6.. Stimulation of peripheral blood mononuclear cells (PBMCs) and neutrophils in vitro by cell wall fractions and purified β-1,6-glucans from C. albicans.
Cytokines, chemokines, or acute-phase proteins (IL-8, MCP-1, IL-6, MIP-1β, IL-1β, TNF-α, RANTES, C5a, IL-10) concentrations in culture supernatants of PBMCs (a) and neutrophils (b) stimulated by cell wall fractions of C. albicans (AI-Fraction, AI-Fraction OxP, and β-1,6-glucan) at 25 µg/mL or LPS (positive control, 0.1 µg/mL). PBMCs and neutrophils were isolated from healthy human donors (n = 8). Three independent batches of each fractions were used. Means are represented and data were analyzed using nonparametric Friedman test with Dunn’s multiple comparisons: *p<0.05; **p<0.01; ***p<0.001; ****p<0.0001; ns, nonsignificant.
Figure 6—figure supplement 1.
Figure 6—figure supplement 1.. Stimulation of peripheral blood mononuclear cells (PBMCs) and neutrophils in vitro by β-1,6-glucan with different size from C. albicans.
Cytokines, chemokines, or acute-phase proteins (IL-8, MCP-1, IL-6, MIP-1β, IL-1β, TNF-α, RANTES, C5a, IL-10) concentrations in culture supernatants of PBMCs (a) or neutrophils (b) stimulated by different β-1,6-glucans from C. albicans at 25 µg/mL or LPS (positive control, 0.1 µg/mL). β-1,6-Glucans were isolated from cell wall alkali-insoluble (AI) fraction of C. albicans grown either at 37°C in synthetic dextrose (SD) medium (control, β-1,6-glucan size = 58 kDa), or in the presence of caspofungin at sublethal concentration 0.015 µg/mL (β-1,6-glucan size = 70 kDa) or in the presence of 2% lactate as sole carbon source (β-1,6-glucan size = 19 kDa). PBMCs and neutrophils were isolated from healthy human donors (n = 8). Three independent batches of the different fractions were used. Means are represented and data were analyzed using nonparametric Friedman test with Dunn’s multiple comparisons: ns, nonsignificant.
Figure 6—figure supplement 2.
Figure 6—figure supplement 2.. Human proteome profiler done with culture supernatant from peripheral blood mononuclear cells (PBMCs) stimulated with C. albicans cell wall fractions.
Left: membrane blots obtained after incubation with supernatants from PBMCs cultures stimulated by different C. albicans cell wall fractions: AI, AI-OxP, or β-1,6-glucans. Incubation with the culture medium was used as a control (top). Right: coordinate of each protein (cytokines, chemokines, acute-phase proteins) detected on the membranes. The experiment was performed once using a pool of 24 supernatants from the stimulation of PBMCs isolated from eight healthy donors, each stimulated with three independent batches of fractions.
Figure 6—figure supplement 3.
Figure 6—figure supplement 3.. Human proteome profiler done with culture supernatant from neutrophils stimulated with C. albicans cell wall fractions.
Left: membrane blots obtained after incubation with supernatants from neutrophils cultures stimulated by different C. albicans cell wall fractions: AI, AI-OxP, or β-1,6-glucans; incubation with the culture medium was used as a control (top). Right: coordinate of each protein (cytokines, chemokines, acute-phase proteins) detected on the membranes. The experiment was performed once using a pool of 24 supernatants from the stimulation of neutrophils isolated from eight healthy donors, each stimulated with three independent batches of fractions.
Figure 6—figure supplement 4.
Figure 6—figure supplement 4.. β-1,6-Glucan from C. albicans activates complement system.
(a) Normal human serum (NHS) enhances the immunostimulatory capacity of β-1,6-glucan from C. albicans. Peripheral blood mononuclear cells (PBMCs) isolated from healthy human donors (n = 2) were stimulated with three independent batches of β-1,6-glucan at 25 µg/mL with (w/) or without (w/o) NHS (10%). Immune response was analyzed by measuring IL-8 released into the culture medium. Means are represented and data were analyzed with an unpaired parametric t-test: ****p<0.0001. (b) Complement factor C3b binds to β-1,6-glucan purified from C. albicans cell wall. Three cell wall fractions (AI, AI-OxP, and β-1,6-glucan) from C. albicans were coated on microtiter plates at 50 µg, 25 µg, or 12.5 µg per well. Human normal serum, diluted in Gelatin-Veronal Buffer (GVB), was added to activate complement pathways. The amount of deposited C3b on each fraction (=level on complement activation) was determined by using anti-human C3b and peroxidase-conjugated anti-mouse IgG antibodies. 3,3’,5,5’-Tetramethylbenzidine (TMB) was used as the peroxidase substrate and the reaction was stopped with 4% H2SO4 and optical density (OD) was measured at 450 nm. The experiment was done with three independent batches of each cell wall fractions. Blank value was subtracted from the values presented. Statistical analyses were performed with one-way ANOVA with Tukey’s multiple comparisons test: ****p<0.0001.
Figure 6—figure supplement 5.
Figure 6—figure supplement 5.. Exposure of β-1,6-glucans and β-1,3-glucans at the cell surface of C. albicans SC5314.
Cells were cultured in synthetic dextrose (SD) at 37°C. β-Glucan exposure was detected by a polyclonal rabbit anti-β-1,6-glucan serum (top panel) and or monoclonal anti-β-1,3-glucan antibody (bottom panel).
Figure 7.
Figure 7.. β-1,6-Glucan in C. albicans is a major and dynamic cell wall polymer.
(a) Scheme of the cell wall of C. albicans. The proportion of each cell wall polymer was representative of the results obtained on C. albicans SC5314 grown in liquid synthetic dextrose (SD) medium at 37°C. (b) Scheme representing the dynamic of β-1,6-glucan under different environmental factors. (c) β-1,6-Glucan is a compensatory pathway for mannan elongation defect. (d) β-1,6-Glucan is a PAMP. (e) Scheme of the cell wall of KRE6 family deficient mutant. Created with BioRender.com.
Figure 7—figure supplement 1.
Figure 7—figure supplement 1.. A model for β-1,6-glucan biosynthetic pathway and putative role of Kre6 family members in this process in yeast.
The cellular location of β-1,6-glucan synthesis in yeast is still unknown. We assume that synthesis begins intracellularly with the polymerization of linear β-1,6-glucan chain (step 1), which requires a β-glucosyltransferase and UDP-glucose as a donor (Aimanianda et al., 2009; Vink et al., 2004) and a putative acceptor (sugar, protein, lipid). Our data (Figure 3g, Figure 3—figure supplement 3) suggest that Kre6 and its homologs (Kre62, Skn1, Skn2) act at this stage, but their function remains unknown. Two proposed hypotheses are (1) Kre6 family members are β-glucosyltransferases and (2) they have glycosylhydrolase and transglycosidase activity essential for polymerization. Step 2 is the branching of nascent β-1,6-glucan where glucosides and laminaribiosides are added to form side chains. The enzymes (β-glucosyltransferase or transglycosidase) involved in this branching remain unknown. According to our data, members of the Kre6 family are not involved in branching (Figure 3i). Next, the polysaccharide is secreted (step 3) and then cross-linked to β-1,3-glucans in the cell wall space by an unknown transglycosidase (step 4). The transfer of GPI-anchored proteins onto β-1,6-glucan (step 5), leading to the formation of the outer layer of the cell wall, appears to be driven by Dfg5/Dcw1 (Vogt et al., 2020). The chronology between these two cross-links (steps 4 and 5) has not been established. Created with BioRender.com.

Update of

References

    1. Aebi M, Bernasconi R, Clerc S, Molinari M. N-glycan structures: recognition and processing in the ER. Trends in Biochemical Sciences. 2010;35:74–82. doi: 10.1016/j.tibs.2009.10.001. - DOI - PubMed
    1. Aimanianda V, Clavaud C, Simenel C, Fontaine T, Delepierre M, Latgé J-P. Cell wall beta-(1,6)-glucan of Saccharomyces cerevisiae: structural characterization and in situ synthesis. The Journal of Biological Chemistry. 2009;284:13401–13412. doi: 10.1074/jbc.M807667200. - DOI - PMC - PubMed
    1. Aimanianda V, Simenel C, Garnaud C, Clavaud C, Tada R, Barbin L, Mouyna I, Heddergott C, Popolo L, Ohya Y, Delepierre M, Latge JP. The dual activity responsible for the elongation and branching of β-(1,3)-Glucan in the fungal cell wall. mBio. 2017;8:e00619. doi: 10.1128/mBio.00619-17. - DOI - PMC - PubMed
    1. Ancian B, Bourgeois I, Dauphin JF, Shaw AA. Artifact-free pure absorption PFG-Enhanced DQF-COSY spectra including a gradient pulse in the evolution period. Journal of Magnetic Resonance. 1997;125:348–354. doi: 10.1006/jmre.1997.1112. - DOI
    1. Ballou ER, Avelar GM, Childers DS, Mackie J, Bain JM, Wagener J, Kastora SL, Panea MD, Hardison SE, Walker LA, Erwig LP, Munro CA, Gow NAR, Brown GD, MacCallum DM, Brown AJP. Lactate signalling regulates fungal β-glucan masking and immune evasion. Nature Microbiology. 2016;2:16238. doi: 10.1038/nmicrobiol.2016.238. - DOI - PMC - PubMed