. 2024 Dec 5:13:RP93004.
doi: 10.7554/eLife.93004.

A conserved cell-pole determinant organizes proper polar flagellum formation

Affiliations

A conserved cell-pole determinant organizes proper polar flagellum formation

Erick E Arroyo-Pérez et al. Elife. .

Abstract

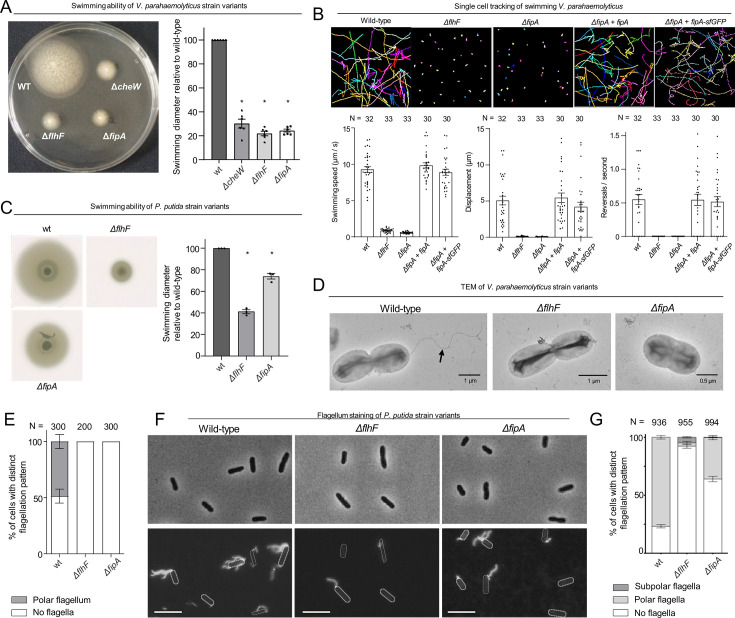
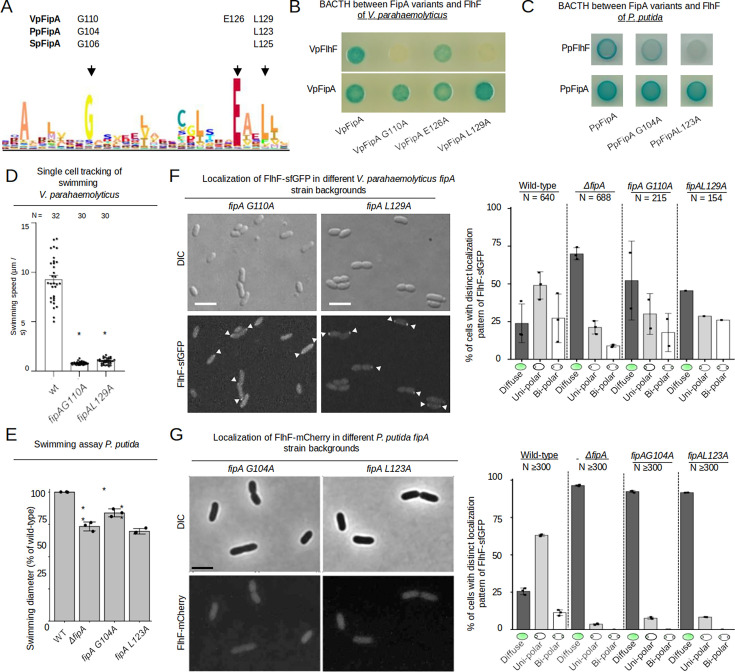
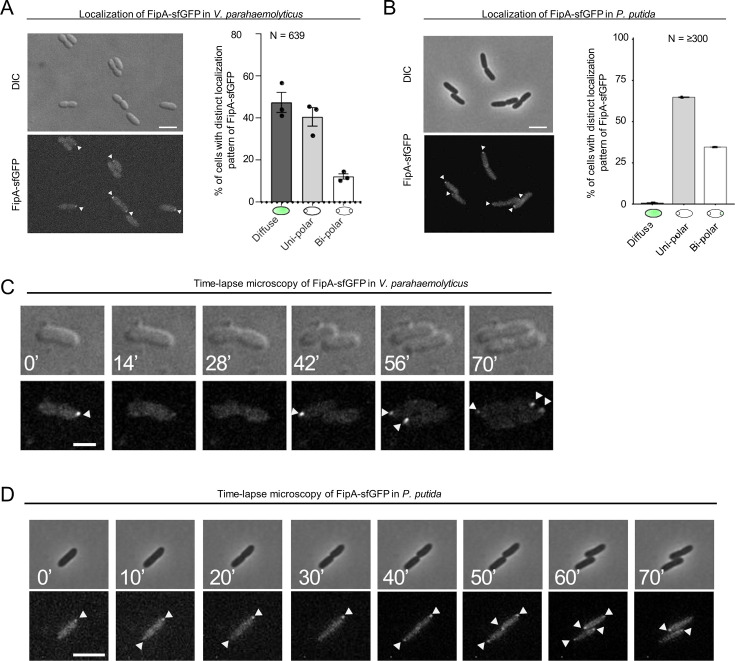
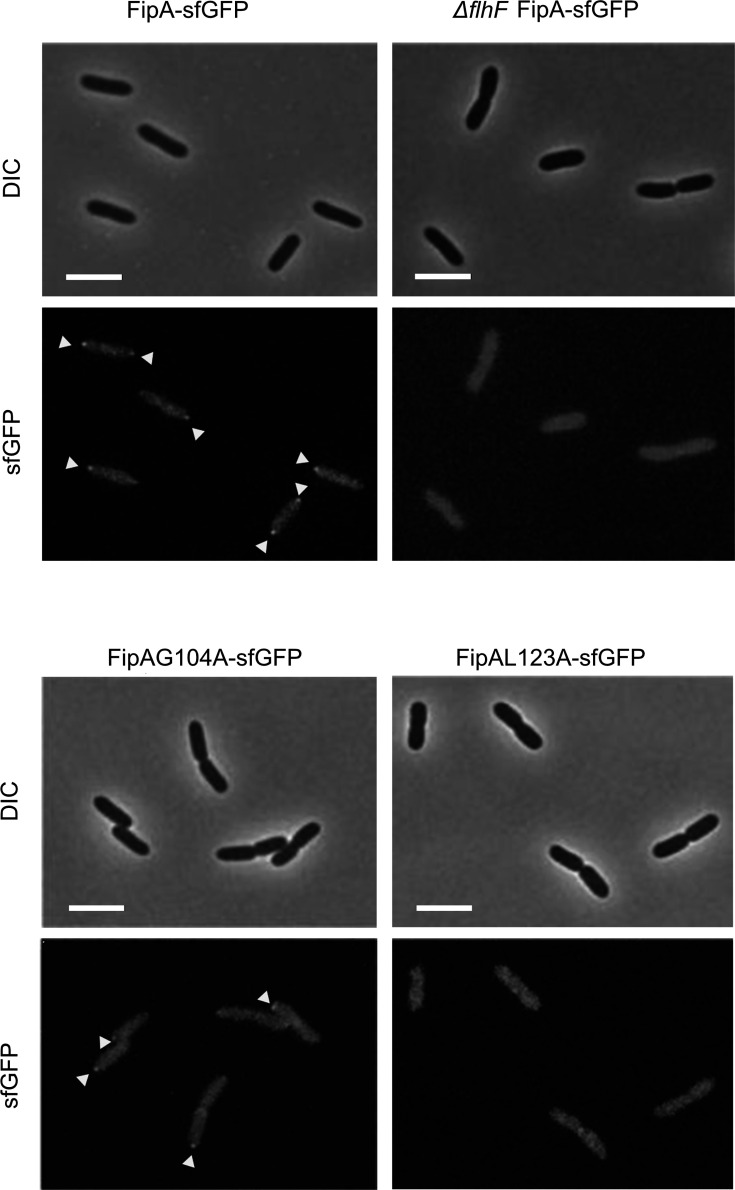
The coordination of cell cycle progression and flagellar synthesis is a complex process in motile bacteria. In γ-proteobacteria, the localization of the flagellum to the cell pole is mediated by the SRP-type GTPase FlhF. However, the mechanism of action of FlhF, and its relationship with the cell pole landmark protein HubP remain unclear. In this study, we discovered a novel protein called FipA that is required for normal FlhF activity and function in polar flagellar synthesis. We demonstrated that membrane-localized FipA interacts with FlhF and is required for normal flagellar synthesis in Vibrio parahaemolyticus, Pseudomonas putida, and Shewanella putrefaciens, and it does so independently of the polar localization mediated by HubP. FipA exhibits a dynamic localization pattern and is present at the designated pole before flagellar synthesis begins, suggesting its role in licensing flagellar formation. This discovery provides insight into a new pathway for regulating flagellum synthesis and coordinating cellular organization in bacteria that rely on polar flagellation and FlhF-dependent localization.

Keywords: Pseudomonas putida; cell biology; infectious disease; microbiology; shewanella putrefaciens; vibrio parahaemolyticus.


Conflict of interest statement

EA, JH, AA, SW, TG, KT, SR No competing interests declared

Figures

Figure 1.
Figure 1.. FipA constitutes a new family of FlhF interaction partners.
Volcanoplots representing Log-ratios versus significance values of proteins enriched in (A) FlhF-sfGFP or (B) FipA-sfGFP purifications using shotgun proteomics and liquid chromatography-mass spectrometry; sfGFP was used as control. The full list of pulled-down proteins can be found in the Supplementary file 1a. (C) Organization of the flagellar/chemotaxis gene region encoding FlhF and FipA in V. parahaemolyticus. (D) Domain organization of FipA (TM, transmembrane region; DUF, domain of unknown function). (E) Bacterial two-hybrid confirming the interaction between FipA and FlhF from V. parahaemolyticus. The indicated proteins (FipA, FlhF) were fused N- or C-terminally to the T18- or T25-fragment of the Bordetella pertussis adenylate cyclase. In vivo interaction of the fusion proteins in Escherichia coli is indicated by blue color. The corresponding assay in P. putida and S. putrefaciens is displayed in Figure 1—figure supplement 2. (F) Dendrogram of γ-proteobacteria, indicating the presence of FlhF or FipA homologues and the corresponding flagellation pattern. An extended version and sources are available in Supplementary file 1b.
Figure 1—figure supplement 1.
Figure 1—figure supplement 1.. Membrane topology of FipA.
(A) Topology analysis and (B) the corresponding model. A Pho/LacZα cassette was translationally fused to the N- or the C-terminus of FipA and the fusion is expressed in a suitable E. coli strain. Pho is only active in the periplasm, while LacZα can functionally complement β-galactosidase activity within the cytoplasm. The enzyme activities can then be tested using suitable color reactions. Expression of Pho-Lac-FipA resulted in blue colonies whereas expression of FipA-Pho-Lac resulted in red colonies, hence suggesting that the FipA N-terminus is positioned in the periplasm and the C-terminus in the cytoplasm (B). Deletion of the predicted membrane spanning domain in Pho-Lac-FipA (aa 6–28, Pho-Lac-FipAΔMD) resulted in red E. coli colonies (A). This suggests that in the absence of the membrane spanning domain the N-terminus of FipA resides in the cytoplasm, and thus further supports that FipA is a transmembrane protein anchored in the inner membrane via the 6–28 aa N-terminal membrane spanning domain and is oriented with the 1–5 aa N-terminal in the periplasm and the 29–163 aa C-terminal in the cytoplasm (B).
Figure 1—figure supplement 2.
Figure 1—figure supplement 2.. FlhF interacts with FipA in a bacterial two-hybrid analysis (BACTH) in P. putida and S. putrefaciens.
FlhF and FipA were produced as N-terminal or as C-terminal fusions to the T18 and T25 fragments of the B. pertussis adenylate cyclase in the given combinations within a single strain. In vivo protein-protein interactions result in active adenylate cyclase activity and high cAMP levels, indicated by blue coloring of the colonies on X-Gal-containing agar.
Figure 2.
Figure 2.. FipA is required for correct flagellum formation.
(A, C) Representative soft-agar swimming assay of V. parahaemolyticus (A) or P. putida (C) strains (left panels) and the corresponding quantification (right panels). For the latter, the halo diameter measurements were normalized to the halo of the wild type on each plate. Data presented are from six (A) or three (C) independent replicates, asterisks represent a p-value < 0.05 (according to ANOVA + Tukey tests). (B) Single-cell tracking of V. parahaemolyticus. Shown are representative swimming trajectories and quantification of swimming speed, total displacement and reversal rate. N indicates number of cells tracked among three biological replicates (ANOVA + Tukey test). (D) Representative electron micrographs of the indicated V. parahaemolyticus strains stained with uranyl acetate. (E) Quantification of flagellation pattern in the populations of the indicated V. parahaemolyticus strains. (F) Flagellum stain of indicated P. putida strains with Alexa Fluor 488-C5-maleimide and (G) quantification of the corresponding flagellation in the population. N indicates the number of cells counted among three biological replicates. For S. putrefaciens, see Figure 2—figure supplement 1.
Figure 2—figure supplement 1.
Figure 2—figure supplement 1.. Deletions of or in FipA and FlhF affect S. putrefaciens flagellation.
(A) Upper panel: Spreading of the indicated strains in soft agar. fipA ΔTM indicates that the transmembrane region of FipA was deleted. The images shown were compiled from a single plate. Lower panel: the corresponding quantification given as diameter; three independent experiments were conducted. The error bar marks the standard deviation. (B) Left: Shown are fluorescent micrographs where the flagellar filament(s) of the indicated strains were fluorescently labeled by maleimide dye. The position of the cell bodies was outlined in the figure. The scale bare equals 5 µm. Right: The corresponding quantification of flagellation. The number of cells (n) for each experiment was >300 from three indepenedent experiments. The error bar between the different populations shows the standard deviation.
Figure 3.
Figure 3.. Localization of FlhF depends on FipA and HubP.
(A) Representative micrographs of the indicated strains of V. parahaemoloyticus expressing FlhF-sfGFP from its native promoter. Upper panel shows the DIC image, the lower panel the corresponding fluorescence image. Fluorescent foci are highlighted by white arrows. Scale bar = 2 μm. For an enlargment see Figure 3—figure supplement 3. (B) Demographs displaying FlhF-sfGFP fluorescence intensity along the cell length within the experiments shown in (A). (C) Quantification of localization patterns and (D) foci fluorescence intensity of the fluorescence microscopy experiment presented in (A). The data was combined from the given number (N) of cells combined from three biological replicates. (E) Representative micrographs of the indicated P. putida strains expressing FlhF-sfGFP from its native promoter. The upper panels show the DIC and the lower panels the corresponding fluorescence images. Fluorescent foci are marked by small white arrows. The scale bar equals 5 µm. The low intensity of the foci did not allow a quantitative analysis of foci intensities or the generation of demographs. For an enlargement of the micrographs see Figure 3—figure supplement 4. (F) Quantification of FlhF-sfGFP localization patterns in the corresponding strains of P. putida from the experiments shown in (E). Corresponding data on the localization of FlhF in S. putrefaciens is displayed in Figure 3—figure supplement 5.
Figure 3—figure supplement 1.
Figure 3—figure supplement 1.. Western analysis on the protein levels of FlhF and FipA fusions to fluorescent proteins.
Crude protein extracts from the corresponding (mutant) strains of V. parahaemolyticus (A, D), P. putida (B, E) and S. putrefaciens (C, F) were separated by SDS-PAGE, transferred to membranes and visualized by western blotting using antibodies against GFP (A, C–F) and mCherry (B). The same OD units from the culture were loaded for each sample. The corresponding strain background is indicated above the lanes.
Figure 3—figure supplement 2.
Figure 3—figure supplement 2.. N-terminal tagging of PpFlhF with mCherry does not negatively affect spreading motility in soft agar.
The upper panel shows the spreading in soft agar, the lower panel shows the corresponding quantification. The images shown are from the same plate, three independent experiments were conducted. The corresponding standard error bar is shown.
Figure 3—figure supplement 3.
Figure 3—figure supplement 3.. Localization of FlhF depends on FipA and HubP.
Shown are enlargments of Figure 3A, representative micrographs of the indicated strains of V. parahaemoloyticus expressing FlhF-sfGFP from its native promoter. The upper panel shows the DIC image, the lower panel the corresponding fluorescence image. Fluorescent foci are highlighted by white arrows. Scale bar = 2 μm.
Figure 3—figure supplement 4.
Figure 3—figure supplement 4.. Localization of FlhF depends on FipA and HubP.
Shown are enlargments of Figure 3E, representative micrographs of the indicated strains of P. putida expressing FlhF-sfGFP from its native promoter. The upper panel shows the DIC image, the lower panel the corresponding fluorescence image. Fluorescent foci are highlighted by white arrows. Scale bar = 5 μm.
Figure 3—figure supplement 5.
Figure 3—figure supplement 5.. SpFipA and SpHubP concertedly affect polar SpFlhF localization.
A) Fluorescence microscopy on the indicated (mutant) strains each bearing an flhF-mvenus hybrid gene replacing native flhF on the chromosome. The upper panel shows DIC micrographs, the lower panel the corresponding fluorescent images. The scale bar equals 5 µm. (B) Quantification of the FlhF-mVenus localization patterns, using the data from >300 cells (n) from three independent experiments, the corresponding standard error is shown as error bar.
Figure 4.
Figure 4.. Activity of FipA depends on FlhF and on its transmembrane domain.
(A) Micrographs of E. coli cells expressing FipA-sfGFP from V. parahaemolyticus, and a truncated version lacking the transmembrane domain (ΔTM). The left panels display the DIC and the right panels the corresponding fluorescence images. The scale bar equals 5 μm. (B) Electron micrographs of V. parahaemolyticus wild-type and mutant cells lacking the transmembrane domain of fipA, respectively. The corresponding quantification of the flagellation pattern is shown to the left of the micrographs. Note that the data for the wild-type cells is the same as in Figure 2D and E. (C) Spreading behavior of the indicated P. putida strains (left) with the corresponding quantification (right). Loss of the FipA TM region phenocopies a complete fipA deletion.
Figure 5.
Figure 5.. Conserved residues in the domain of unknown function of FipA are essential for interaction with FlhF.
(A) Weight-based consensus sequence of the conserved region of DUF2802 as obtained from 481 species. The residues targeted in the FipA orthologs of V. parahaemolyticus, P. putida and S. putrefaciens are indicated along with their appropriate residue position. (B, C) Bacterial two-hybrid assay of FipA variants of V. parahaemolyticus (B) or P. putida (C) with an alanine substitution in the conserved residues indicated in (A). The constructs were tested for self-interaction and interaction with FlhF. In vivo interaction of the fusions in E. coli is indicated by blue coloration of the colonies. (D) Quantification from single-cell tracking of swimming V. parahaemolyticus cells expressing FipA bearing the indicated substitution in the DUF2802 domain (see Figure 2B for wild-type behavior). Asterisks indicate a p-value <0.05 (ANOVA + Tukey test) (F) Localization of VpFlhF in the absence of FipA or in cells with substitutions in the DUF2802 domain. Left: Micrographs showing the localization of FipA-sfGFP in the indicated strains; the upper panels display the DIC and the lower panels the corresponding fluorescence images (for an enlargement see Figure 5—figure supplement 1). The scale bar equals 5 µm. Right: the corresponding quantification of the FlhF-sfGFP patterns in the indicated strains. (E) Soft-agar spreading assays of P. putida wild-type and indicated mutant strains, asterisks display a p-value of 0.05 (*) or 0.01 (**) (ANOVA). (G) Localization of P. putida FlhF in strains bearing substitutions in the DUF2802 interaction site. Left: micrographs displaying the localization of FlhF-mCherry in the indicated strains. Upper panels show the DIC and lower panels the corresponding fluorescence images. The scale bar equals 5 µm (for an enlargement see Figure 5—figure supplement 1). Right: Corresponding quantification of the FlhF localization pattern in the indicated strains. Data for S. putrefaciens is displayed in Figure 5—figure supplement 2.
Figure 5—figure supplement 1.
Figure 5—figure supplement 1.. Conserved residues in the domain of unknown function of FipA are essential for interaction with FlhF in P. putida.
(A) Localization of VpFlhF in cells with substitutions in the DUF2802 domain. Micrographs are showing the localization of FipA-sfGFP in the indicated strains; the upper panels display the DIC and the lower panels the corresponding fluorescence images. The scale bar equals 5 µm. (B) The same analysis for P. putida FlhF-mCherry. The images are enlargements of Figure 5F (A) and Figure 5G (B).
Figure 5—figure supplement 2.
Figure 5—figure supplement 2.. Targeted residue substitution in FipA affects FlhF positioning and function in S. putrefaciens.
(A) BACTH analysis (see, e.g. Figure 2) suggests that G106A and L125A in SpFipA does not disrupt but maybe weakens (G106A) the interaction between SpFipA and SpFlhF. (B) Spreading of the indicated S. putrefaciens strains in soft agar reveals a small but sigifnificant (asterisk = p < 0.05) and based on three independent experiments. (C) Left: micrographs showing DIC (upper panels) and fluorescent imaging on mVenus-tagged FlhF cells in mutant backgrounds bearing the given substutions in SpFipA with the corresponding quantification (n>300 cells, right). The in vivo analysis suggests that the residue substitutions in SpFipA give rise to phenotypes that are similar to that of a fipA deletion.
Figure 6.
Figure 6.. The localization pattern of FipA.
(A, B) Localization pattern of fluorescently labeled FipA in V. parahaemolyticus and P. putida. (A) Representative micrographs of V. parahaemolyticus expressing FipA-sfGFP from its native promoter. Scale bar = 2 μm. The upper panel shows the DIC and the lower panel the corresponding fluorescence channel. To the right the localization was quantified accordingly. (B) The same analysis for P. putida. (C, D) Time lapse analysis of FipA-sfGFP localization over a cell cycle in V. parahaemolyticus (C) and P. putida (D). The numbers in the upper DIC micrographs show the minutes after start of the experiment. The scale bars equal 1 µm (C) and 5 µm (D).
Figure 6—figure supplement 1.
Figure 6—figure supplement 1.. Production and function of FipA derivatives.
The three panels show western blotting analysis of PAGE protein separations from V. parahaemolyticus (A), P. putida (B) and S. putrefaciens (C) bearing FipA-sfGFP with substitutions in conserved residues as indicated, using antibodies raised against sfGFP. V. parahaemolyticus also includes a mutant deleted in flhF. The loaded samples are normalized by OD units. (D) The C-terminal fusion of sfGFP has only minor effects on FipA function in S. putrefaciens and P. putida. The upper panels show the spreading in soft agar (taken from the same soft agar plate), the lower the corresponding quantification. The error bars are the standard deviation from three independent experiments.
Figure 6—figure supplement 2.
Figure 6—figure supplement 2.. The localization pattern of FipA.
Localization pattern of fluorescently labeled FipA in V. parahaemolyticus and P. putida. Left: Representative micrographs of V. parahaemolyticus expressing FipA-sfGFP from its native promoter. Scale bar = 2 μm. The upper panel shows the DIC and the lower panel the corresponding fluorescence channel. Right: The same analysis for P. putida. The images are enlargements of the micrographs in Figure 6A and B.
Figure 7.
Figure 7.. Normal localization of FipA depends on interaction with FlhF.
(A, B) Localization pattern of V. parahaemolyticus FipA-sfGFP in the indicated wild-type and mutant strains. The upper panels display the DIC micrographs, the middle panel the corresponding fluorescence imaging (scale bar equals 5 µm), and the lower panel the corresponding demograph showing the fluorescence of FipA-sfGFP along the cell length. (C) Quantification of the cell localization pattern from the experiment shown in (A, B) as combined from three biological replicates. (D, E, F) The same analysis for the corresponding P. putida strains as indicated. The scale bar equals 5 µm. The data for S. putrefaciens is displayed in Figure 7—figure supplement 3.
Figure 7—figure supplement 1.
Figure 7—figure supplement 1.. Normal localization of FipA depends on interaction with FlhF.
Localization pattern of V. parahaemolitycus FipA-sfGFP in the indicated wild-type and mutant strains. The upper panels display the DIC micrographs, the lower panel the corresponding fluorescence imaging (scale bar equals 5 µm). The images are enlargements of the micrographs in Figure 7A (upper) and 7B (lower).
Figure 7—figure supplement 2.
Figure 7—figure supplement 2.. Normal localization of FipA depends on interaction with FlhF.
Localization pattern of P. putida FipA-sfGFP in the indicated wild-type and mutant strains. The upper panels display the DIC micrographs, the lower panel the corresponding fluorescence imaging (scale bar equals 5 µm). The images are enlargements of the micrographs in Figure 7D (upper) and 7E (lower).
Figure 7—figure supplement 3.
Figure 7—figure supplement 3.. Localization of SpFipA in different strain backgrounds.
Left: Micrographs showing DIC (left) and fluorescence (right) microscopy on cells with FipA-sfGFP in different background strains as indicated. The scale bar equals 5 µm. The corresponding quantification (N>300, three independent experiments) is shown to the right. FipA loses its polar localization in a mutant lacking HubP and in a mutant with the L125A substitution in FipA.

Update of

  • doi: 10.1101/2023.09.20.558563
  • doi: 10.7554/eLife.93004.1
  • doi: 10.7554/eLife.93004.2

References

    1. Ainsaar K, Tamman H, Kasvandik S, Tenson T, Hõrak R. The TonBm-PocAB system is required for maintenance of membrane integrity and polar position of flagella in Pseudomonas putida. Journal of Bacteriology. 2019;201:e00303-19. doi: 10.1128/JB.00303-19. - DOI - PMC - PubMed
    1. Arroyo-Pérez EE, Ringgaard S. Interdependent polar localization of flhf and flhg and their importance for flagellum formation of vibrio parahaemolyticus. Frontiers in Microbiology. 2021;12:655239. doi: 10.3389/fmicb.2021.655239. - DOI - PMC - PubMed
    1. Banerjee P, Raghav S, Goswami HN, Jain D. The antiactivator FleN uses an allosteric mechanism to regulate σ54-dependent expression of flagellar genes in Pseudomonas aeruginosa. Science Advances. 2021;7:eabj1792. doi: 10.1126/sciadv.abj1792. - DOI - PMC - PubMed
    1. Bange G, Petzold G, Wild K, Parlitz RO, Sinning I. The crystal structure of the third signal-recognition particle GTPase FlhF reveals a homodimer with bound GTP. PNAS. 2007;104:13621–13625. doi: 10.1073/pnas.0702570104. - DOI - PMC - PubMed
    1. Blagotinsek V, Schwan M, Steinchen W, Mrusek D, Hook JC, Rossmann F, Freibert SA, Kratzat H, Murat G, Kressler D, Beckmann R, Beeby M, Thormann KM, Bange G. An ATP-dependent partner switch links flagellar C-ring assembly with gene expression. PNAS. 2020;117:20826–20835. doi: 10.1073/pnas.2006470117. - DOI - PMC - PubMed

MeSH terms

Substances

LinkOut - more resources