

Human Pancreatic Cancer Single-Cell Atlas Reveals Association of CXCL10+ Fibroblasts and Basal Subtype Tumor Cells
- PMID: 39636224
- PMCID: PMC11831110
- DOI: 10.1158/1078-0432.CCR-24-2183
Human Pancreatic Cancer Single-Cell Atlas Reveals Association of CXCL10+ Fibroblasts and Basal Subtype Tumor Cells
Abstract
Purpose: Pancreatic ductal adenocarcinoma (PDAC) patients with tumors enriched for the basal-like molecular subtype exhibit enhanced resistance to standard-of-care treatments and have significantly worse overall survival compared with patients with classic subtype-enriched tumors. It is important to develop genomic resources, enabling identification of novel putative targets in a statistically rigorous manner.
Experimental design: We compiled a single-cell RNA sequencing (scRNA-seq) atlas of the human pancreas with 229 patient samples aggregated from publicly available raw data. We mapped cell type-specific scRNA-seq gene signatures in bulk RNA-seq (n = 744) and spatial transcriptomics (ST; n = 22) and performed validation using multiplex immunostaining.
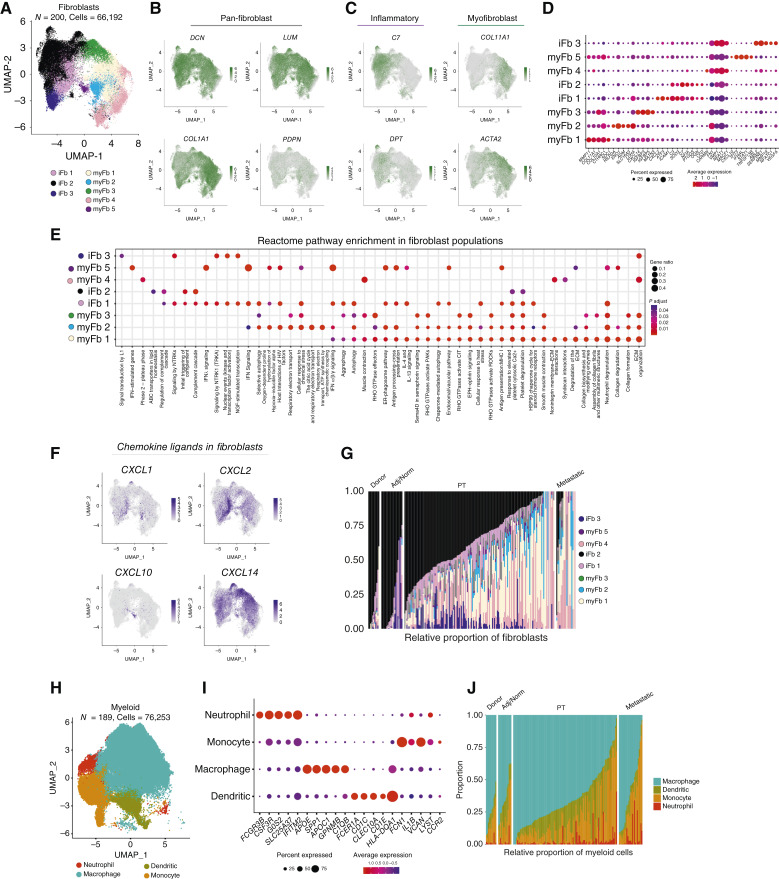
Results: Analysis of tumor cells from our scRNA-seq atlas revealed nine distinct populations, two of which aligned with the basal subtype, correlating with worse overall survival in bulk RNA-seq. Deconvolution identified one of the basal populations to be the predominant tumor subtype in nondissociated ST tissues and in vitro tumor cell and patient-derived organoid lines. We discovered a novel enrichment and spatial association of CXCL10+ cancer-associated fibroblasts with basal tumor cells. We identified that besides immune cells, ductal cells also express CXCR3, the receptor for CXCL10, suggesting a relationship between these cell types in the PDAC tumor microenvironment.
Conclusions: We show that our scRNA-seq atlas (700,000 cells), integrated with ST data, has increased statistical power and is a powerful resource, allowing for expansion of current subtyping paradigms in PDAC. We uncovered a novel signaling niche marked by CXCL10+ cancer-associated fibroblasts and basal tumor cells that could be explored for future targeted therapies.
©2024 The Authors; Published by the American Association for Cancer Research.
Conflict of interest statement
B.Z. Stanger reports grants from Revolution Medicines and Boehringer Ingelheim and other support from iTeos Therapeutics outside the submitted work. A.M. Waters reports grants from the NCI during the conduct of the study and personal fees and nonfinancial support from Revolution Medicines outside the submitted work. E.J. Fertig reports grants from the NIH/NCI, the Lustgarten Foundation, and Break Through Cancer during the conduct of the study and grants from the NIH/NIA and Roche/Genetech and personal fees from Viosera/Resistance Bio, Mestag Therapeutics, and Merck outside the submitted work. No disclosures were reported by the other authors.
Figures


References
-
- Rahib L, Smith BD, Aizenberg R, Rosenzweig AB, Fleshman JM, Matrisian LM. Projecting cancer incidence and deaths to 2030: the unexpected burden of thyroid, liver, and pancreas cancers in the United States. Cancer Res 2014;74:2913–21. - PubMed
-
- Seo YD, Katz MHG. Preoperative therapy for pancreatic adenocarcinoma-precision beyond anatomy. Cancer 2022;128:3041–56. - PubMed
-
- Espinet E, Klein L, Puré E, Singh SK. Mechanisms of PDAC subtype heterogeneity and therapy response. Trends Cancer 2022;8:1060–71. - PubMed
MeSH terms
Substances
Grants and funding
- P20 CA192996/CA/NCI NIH HHS/United States
- R01 CA188134/CA/NCI NIH HHS/United States
- U54 CA209997/CA/NCI NIH HHS/United States
- R01 CA198074/CA/NCI NIH HHS/United States
- R01 CA212600/CA/NCI NIH HHS/United States
- F31 CA284525/CA/NCI NIH HHS/United States
- R01 CA248160/CA/NCI NIH HHS/United States
- S10 OD012351/OD/NIH HHS/United States
- K22CA276632/Basic Research Laboratory (BRL)
- R01 CA247516/CA/NCI NIH HHS/United States
- R00 CA263154/CA/NCI NIH HHS/United States
- K22 CA276632/CA/NCI NIH HHS/United States
- U01 CA200468/CA/NCI NIH HHS/United States
- P30 CA046592/CA/NCI NIH HHS/United States
- R33 CA206949/CA/NCI NIH HHS/United States
- R01 CA202762/CA/NCI NIH HHS/United States
- R00CA263154/Basic Research Laboratory (BRL)
- R01 CA190092/CA/NCI NIH HHS/United States
- F31CA271576/Basic Research Laboratory (BRL)
- K99 CA204725/CA/NCI NIH HHS/United States
- R50 CA211506/CA/NCI NIH HHS/United States
- P20 CA192994/CA/NCI NIH HHS/United States
- PA220131P1/Air Force Surgeon General (Surgeon General of the Air Force)
- P30 CA034196/CA/NCI NIH HHS/United States
- F31 CA271576/CA/NCI NIH HHS/United States
- U01 CA224013/CA/NCI NIH HHS/United States
- P50 CA101955/CA/NCI NIH HHS/United States
- 24TPA1288424/American Heart Association (AHA)
- R01 CA151588/CA/NCI NIH HHS/United States
- P50 CA127297/CA/NCI NIH HHS/United States
- R50 CA211462/CA/NCI NIH HHS/United States
- R01 CA244931/CA/NCI NIH HHS/United States
- R01 CA182076/CA/NCI NIH HHS/United States
- R01 DK128102/DK/NIDDK NIH HHS/United States
- P30 CA013696/CA/NCI NIH HHS/United States
- U10 CA180944/CA/NCI NIH HHS/United States
- P30 CA045508/CA/NCI NIH HHS/United States
- Lustgarten Foundation (Lustgarten)
- U01 CA168409/CA/NCI NIH HHS/United States
- U01 CA210240/CA/NCI NIH HHS/United States
- U01 CA274154/CA/NCI NIH HHS/United States
- P01 CA013106/CA/NCI NIH HHS/United States
- U01 CA224145/CA/NCI NIH HHS/United States
- R01 CA281198/CA/NCI NIH HHS/United States
- T32 CA148056/CA/NCI NIH HHS/United States
- R35 CA197745/CA/NCI NIH HHS/United States
LinkOut - more resources
Full Text Sources
Medical
