. 2025 Feb 3;224(2):e202405170.
doi: 10.1083/jcb.202405170. Epub 2024 Dec 5.

Non-canonical CDK6 activity promotes cilia disassembly by suppressing axoneme polyglutamylation

Affiliations

Non-canonical CDK6 activity promotes cilia disassembly by suppressing axoneme polyglutamylation

Kai He et al. J Cell Biol. .

Abstract

Tubulin polyglutamylation is a posttranslational modification that occurs primarily along the axoneme of cilia. Defective axoneme polyglutamylation impairs cilia function and has been correlated with ciliopathies, including Joubert Syndrome (JBTS). However, the precise mechanisms regulating proper axoneme polyglutamylation remain vague. Here, we show that cyclin-dependent kinase 6 (CDK6), but not its paralog CDK4, localizes to the cilia base and suppresses axoneme polyglutamylation by phosphorylating RAB11 family interacting protein 5 (FIP5) at site S641, a critical regulator of cilia import of glutamylases. S641 phosphorylation disrupts the ciliary recruitment of FIP5 and its association with RAB11, thereby reducing the ciliary import of glutamylases. Encouragingly, the FDA-approved CDK4/6 inhibitor Abemaciclib can effectively restore cilia function in JBTS cells with defective glutamylation. In summary, our study elucidates the regulatory mechanisms governing axoneme polyglutamylation and suggests that developing CDK6-specific inhibitors could be a promising therapeutic strategy to enhance cilia function in ciliopathy patients.


Conflict of interest statement

Disclosures: The authors declare no competing interests exist.

Figures

Figure 1.
Figure 1.
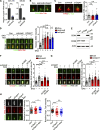
CDK7 suppresses axoneme polyglutamylation. (A) CDK7 selective inhibitors increase the length of glutamylated axoneme in RPE-1 cells. Cells were treated with THZ1 (1 mM) or BS-181 (10 mM) for 24 h in a serum-free medium. ARL13B was used as a marker of cilium. The glutamylated axoneme was labeled by antibody GT335. (B) THZ1 partially rescues the axoneme polyglutamylation in CCP5-YFP overexpressed RPE-1 cells. (C) The knockdown efficiency of CDK7 siRNA was accessed by western blotting. The molecular weigth standards (kD) are labeled on the right. (D) Knockdown of CDK7 partially rescues the axoneme polyglutamylation in CCP5-YFP overexpressed RPE-1 cells. (E) Knockdown of CDK7 restores the axoneme polyglutamylation in TTLL5-depleted cells. Quantified data are presented as mean ± SEM. Statistical analyses were performed by one-way ANOVA analyses with Tukey’s post-hoc test for multiple comparisons. N ≥ 40 cilia. ***P < 0.001. n.s: not significant. Scale bars: 2 μm. Source data are available for this figure: SourceData F1.
Figure S1.
Figure S1.
Kinase inhibitors screen to identify regulators of axoneme polyglutamylation. RPE-1 cells were treated with each kinase inhibitor for 24 h (1 μM) in serum-free medium, and the length of glutamylated axoneme was measured. The positive hits that affect axoneme polyglutamylation are presented. Quantified data are presented as mean ± SEM. N ≥ 30 Cilia.
Figure S2.
Figure S2.
Inhibition of CDK7 or CDK6 does not affect tubulin glutamylation and acetylation in cytoplasm. (A and B) THZ1 or Abemaciclib does not affect cytoplasmic tubulin glutamylation. (C and D) Knockdown of CDK7 or CDK6 does not affect cytoplasmic tubulin glutamylation. (E) The total levels of glutamylated tubulin and acetylated tubulin in control and CDK6−/− RCTE cells were assessed by western bolting. The molecular weigth standards (kD) are labeled on the right. (F) Knockdown of CDK7 or CDK6 does not affect the axonemal acetylation-to-cilium length ratio in RPE1 cells. Cilia length was measured using ARL13B as a cilia marker. Quantified data are presented as mean ± SEM. N ≥ 30 Cilia. Statistical analyses were performed by one-way ANOVA analyses with Tukey’s post-hoc test for multiple comparisons. n.s: not significant. Scale bars: 5 μm. GT335 antibody labels all forms of glutamylated tubulin. PolyE antibody only labels polyglutamylated tubulin (≥3E). Source data are available for this figure: SourceData FS2.
Figure 2.
Figure 2.
CDK6, but not CDK4, suppresses axoneme polyglutamylation. (A) Ectopically expressed and endogenous CDK7 localize at the nucleus. (B) The knockdown efficiency of CDK4 and CDK6-specific siRNAs was accessed by western blotting. The molecular weigth standards (kD) are labeled on the right. (C) Knockdown of CDK6, but not CDK4, promotes axoneme polyglutamylation in RPE-1 cells. (D) The knockout validation of CDK4 and CDK6 by western blotting in RCTE cells. The molecular weigth standards (kD) are labeled on the right. (E) Knockout CDK6, but not CDK4, promotes axoneme polyglutamylation in RCTE cells. (F) The CDK6−/− RCTE cells were transfected with indicated mCherry-tagged CDK6. 48 h later, cells were cultured in serum-free medium for 24 h to induce ciliogenesis. The length of polyglutamylated axoneme in mCherry-positive cells was measured. (G) The RPE-1 cells were transfected with mCherry-tagged CDK6T177D. 48 h later, cells were cultured in a serum-free medium and treated with THZ1 for 24 h. The length of polyglutamylated axoneme was measured. (H) Abemaciclib (Abe) restores axoneme polyglutamylation in TTLL5-depleted RPE-1 cells. Cells were transfected with TTLL5 siRNA for 48 h, followed by Abemaciclib (500 nM) treatment for 24 h in serum-free medium. (I) Abemaciclib partially rescues the axoneme polyglutamylation in CCP5-YFP overexpressed RPE-1 cells. Quantified data are presented as mean ± SEM. Statistical analyses were performed by one-way ANOVA analyses with Tukey’s post-hoc test for multiple comparisons. ***P < 0.001. n.s: not significant. N ≥ 50 cilia. Scale bars: 5 μm (A) or 2 μm (C, E, H, and I). Source data are available for this figure: SourceData F2.
Figure S3.
Figure S3.
siRNA knockdown screen of CDK7 downstream CDKs. (A and B) The knockdown efficiency of indicated siRNAs in RPE-1 cells was accessed by western blotting (A) or qPCR (B). The molecular weigth standards (kD) are labeled on the right. Quantified data are presented as mean ± SD. N = 3 independent experiments. Statistical analyses were performed by two-tailed unpaired Student’s t test. (C) The effect of indicated CDKs knockdown on axoneme polyglutamylation in RPE-1 cells. Quantified data are presented as mean ± SEM. Statistical analyses were performed by one-way ANOVA analyses with Tukey’s post-hoc test for multiple comparisons. N ≥ 50 cilia. **P < 0.01; ***P < 0.001. Source data are available for this figure: SourceData FS3.
Figure 3.
Figure 3.
Inhibition of CDK6 abolishes cilia disassembly. (A and B) hTERT-RPE-1 cells were transfected with siRNA for 48 h, followed by serum starvation and Abemaciclib (500 nM) treatment for 24 h. After that, cells were cultured in the medium containing 20% FBS for the indicated times. The cilia length was measured using ARL13B as a marker at indicated times. Quantified data are presented as mean ± SEM. Statistical analyses were performed by one-way ANOVA analyses with Tukey’s post-hoc test for multiple comparisons. N ≥ 50 cilia. **P < 0.01; ***P < 0.001. n.s: not significant.
Figure 4.
Figure 4.
Ciliary CDK6 suppresses axoneme polyglutamylation. (A and B) The subcellular localization of ectopically expressed CDK6-mCherry (A) and CDK4-mCherry (B) in ciliated RPE-1 cells. GT335 antibody labels axoneme, basal body/mother centriole, and daughter centriole. Scale bars: 5 μm. (C) The subcellular localization of endogenous CDK6 in non-ciliated (FBS+) and ciliated (FBS−) RPE-1 cells. Scale bars: 2 μm. (D) The subcellular localization of endogenous phosphorylated CDK6 (T177) in ciliated RPE-1 cells. Scale bars: 2 μm. (E) The subcellular localization of ectopically expressed cyclin D3-YFP in indicated RPE-1 cells. CEP164 were used as the marker of the mother centriole or basal body. Scale bars: 2 μm. (F) Schematic illustration of CEP170C-based cilia targeting system. N: N-terminal; C: C-terminal; L: flexible linker. (G) Ciliary targeting of CyclinD3-CDK6 inhibits axoneme polygultamylation. The ratio of glutamylated axoneme length to cilia length in indicated YFP-positive RPE-1 cells were quantified. Quantified data are presented as mean ± SEM. Statistical analyses were performed by two-tailed unpaired Student’s t test. N ≥ 50 cilia. ***P < 0.001. Scale bars: 2 μm.
Figure 5.
Figure 5.
CDK7 and CDK6 suppress ciliary import of TTLL5 and TTLL6. (A and B) THZ1 and Abemaciclib promotes the ciliary import of TTLL5 (A) and TTLL6 (B). After 24 h serum starvation, the TTLL5-YFP or TTLL6-YFP overexpressed RPE-1 cells were treated with THZ1 or Abemaciclib for 2 h. (C and D) Knockdown of CDK7 promotes the ciliary import of TTLL5 (C) and TTLL6 (D). (E and F) Knockdown of CDK6 promotes the ciliary import of TTLL5 (E) and TTLL6 (F). Quantified data are presented as mean ± SD. Statistical analyses were performed by one-way ANOVA analyses with Tukey’s post-hoc test for multiple comparisons (A, B, E, and F) or two-tailed unpaired Student’s t test (C and D). N = 4 independent experiments. *P < 0.05; **P < 0.01; ***P < 0.001. Scale bars: 2 μm.
Figure S4.
Figure S4.
The effects of THZ1 and BafA1 on cilia base TTLL5/6-YFP and the effects of cilia-trapped YFP, CDK6, or CyclinD3-CDK6 on total FIP5 protein abundance. (A) Autophagy inhibitor bafilomycin-A1 (BafA1) prevents the loss of TTLL5/6-YFP at the cilia base in THZ1-treated cells. Scale bar: 2 μm. TTLL5/6-YFP expressing RPE1 cells were pretreated with or without BafA1 (10 nM) for 1 h followed by 2 h THZ1 treatment. (B) Ciliary CDK6 does not affect the protein level of FIP5. YFP control, CDK6 or CyclinD3-CDK6 were overexpressed at cilia base. The protein level of FIP5 was accessed by western blotting. The molecular weigth standards (kD) are labeled on the right. Source data are available for this figure: SourceData FS4.
Figure 6.
Figure 6.
FIP5 acts downstream of CDK6 to regulate axoneme polyglutamylation. (A) The FIP5-mCherry overexpressed RCTE cells were cultured in a serum-containing medium. Images cropped from live-cell imaging before and after Abemaciclib treatment. White triangles indicate the accumulation loci of FIP5-mCherry–positive vesicles. (B) The subcellular localization, and fluorescent intensity of FIP5 at cilia base in indicated YFP-positive RPE-1 cells. Acetylated tubulin (Ac-Tub) was used as a marker of cilium. (C) Knockdown of FIP5 inhibits Abemaciclib-induced axoneme hyperglutamylation in RPE-1 cells. (D) The knockdown efficiency of CDK6 and FIP5 siRNAs was accessed by western blotting. The molecular weigth standards (kD) are labeled on the right. (E) Knockdown of FIP5 inhibits CDK6 depletion-induced axoneme hyperglutamylation in RPE-1 cells. (F and G) Knockdown of FIP5 inhibits CDK6 depletion-induced ciliary import of TTLL5 (F) and TTLL6 (G). Quantified data are presented as mean ± SEM (B, C, E, and right panels of F and G) or SD (left panels of F and G). Statistical analyses were performed by one-way ANOVA analyses with Tukey’s post-hoc test for multiple comparisons. N ≥ 50 cilia (B, C, E, and right panels of F and G) or = 4 independent experiments (left panels of F and G). ***P < 0.001. n.s: not significant. Scale bars: 10 μm (A), 5 μm (B), or 2 μm (C and E–G). Source data are available for this figure: SourceData F6.
Figure 7.
Figure 7.
S641 phosphorylation by CDK6 interrupts cilia base accumulation and RAB11 interaction of FIP5. (A) The putative CDK6 phosphorylation sites and cyclin binding motifs in FIP5. (B) Direct interaction between FIP5 and Cyclin D3 was detected by GST pull-down assay. GST-CDK6 (CDK6), GST-Cyclin-D3 (CycD3), and 6× his-tagged truncated FIP5 (129–653) (ΔC2-FIP5) proteins were used. The purity of recombinant proteins was assessed by Coomassie blue staining. IB: immunoblotting. The molecular weigth standards (kD) are labeled on the right. (C) Direct CDK6/cyclin D3-mediated FIP5 phosphorylation was detected by in vitro kinase reaction assay. Recombinant ΔC2-FIP5 and active Cyclin-D3/CDK6 (D3K6) proteins were used. GST-Cyclin D3 (CycD3) and His-CDK6 (CDK6) were also used. The phosphorylation of FIP5 was examined by anti-phosphorylated Serine antibody (p-Ser). (D) Indicated mCherry-tagged FIP5 and CyclinD3-CDK6-YFP were transfected in 293T cells. The phosphorylation of FIP5 was examined by anti-phosphorylated Serine antibody after immunoprecipitation (IP) of FIP5-mCherry. * indicates the positive band of D3K6-YFP. (E) mCherry or mCherry-tagged FIP5 mutants were transfected in RCTE cells. The length of the glutamylated axoneme in mCherry-positive cells was measured. Quantified data are presented as mean ± SEM. Statistical analyses were performed by one-way ANOVA analyses with Tukey’s post-hoc test for multiple comparisons. N ≥ 100 cilia. ***P < 0.001. n.s: not significant. (F) Subcellular localization of mCherry-tagged WT- or S641A-FIP5 in non-ciliated RCTE cells. The enlarged fields indicated by white squares and showed in the right panels. The line-scan fluorescence intensity profiles of mCherry at the positions marked by arrow lines are shown on the right. Scale bar: 10 μm. (G) The subcellular localization of mCherry-tagged FIP5 in indicated YFP-positive ciliated RCTE cells. The line-scan fluorescence intensity profiles of mCherry at the positions marked by arrow lines are shown on the right. Scale bar: 10 μm. (H and I) Indicated mCherry-tagged FIP5 and flag-tagged RAB11A were transfected in 293T cells. The interaction between FIP5 and RAB11A was examined by co-immunoprecipitation. (J) Indicated mCherry-tagged FIP5 were transfected in RCTE cells. The interaction between mCherry-tagged FIP5 and endogenous RAB11A was examined by co-immunoprecipitation. Source data are available for this figure: SourceData F7.
Figure 8.
Figure 8.
Abemaciclib rescues glutamylation and ciliary signaling in JBTS mutant cells. (A–E) Abemaciclib (200 nM, 24 h) restores axoneme polyglutamylation and Shh signaling in Armc9 and Cep41 knocked-down normal or Halo-mGLI2 Flp-In NIH-3T3 cells, examined by mean intensity of GT335 in cilia (A and B), and SAG (100 nM, 24 h) induced cilia tip accumulation of GLI3 (A and C) and GLI2 (D and E). T: Cilia tip. B: Cilia base. (F–H) Abemaciclib (200 nM, 24 h) restores axoneme polyglutamylation (F and G) and ciliary localization of PC2 (F and H) in Armc9 and Cep41 knocked-down IMCD3 cells. Quantified data are presented as mean ± SEM. Statistical analyses were performed by one-way ANOVA analyses with Tukey’s post-hoc test for multiple comparisons. N ≥ 50 cilia. *P < 0.05; **P < 0.01; ***P < 0.001. Scale bars: 2 μm. (I) Schematic model illustrating the CDK6-FIP5 phosphorylation cascade-regulated axoneme polyglutamylation. In cells with inactivated CDK6, FIP5 interacts with RAB11 to promote the ciliary import of TTLL5/6 and subsequent axoneme polyglutamylation. Glutamylated axoneme supports the cilia localization of polycystins and signaling molecules such as Hedgehog component GLI2/3. In cells with activated CDK6, CDK6 at the cilia base phosphorylates FIP5 at S641, disrupting the FIP5-RAB11 interaction and subsequent ciliary import of TTLL5/6. This leads to axoneme hypoglutamylation and defective ciliary localization of polycystins and GLI2/3. Image created with https://BioRender.com.
Figure S5.
Figure S5.
Abemaciclib rescues Shh signaling in JBTS cells by relieving CDK6’s inhibition on axoneme polyglutamylation. (A) The knockdown efficiency of Armc9 siRNA in NIH-3T3 and IMCD3 cells was accessed by qPCR. Quantified data are presented as mean ± SD. Statistical analyses were performed by unpaired Student’s t test. N = 3 independent experiments. ***P < 0.001. (B and C) Knockdown of Armc9 or Cep41 does not affect ciliary base localization of CDK6 or FIP5 in NIH-3T3 cells. (D) Knockdown of Armc9 or Cep41 does not affect SAG induced ciliary translocation of SMO in NIH-3T3 cells. (E) The knockdown efficiency of mouse Cdk4 and Cdk6 specific siRNAs in NIH-3T3 cells were accessed by western blotting. The molecular weigth standards (kD) are labeled on right. (F and G) Knockdown of Cdk6, but not Cdk4, restores SAG-induced cilia tip accumulation of GLI3 in Armc9- (F) or Cep41- (G) depleted NIH-3T3 cells. (H) Abemaciclib does not affect axoneme acetylation or detyrosination. NIH-3T3 cells were transfected with siRNA for 48 h, followed by serum starvation and Abemaciclib (200 nM) treatment for 24 h. The mean fluorescent intensity of acetylated and detyrosinated tubulin (Detyr. Tub) in cilia was quantified. Quantified data for C–H are presented as mean ± SEM. Statistical analyses were performed by one-way ANOVA analyses with Tukey’s post-hoc test for multiple comparisons. N ≥ 40 cilia. *P < 0.05; **P < 0.01; ***P < 0.001. n.s: not significant. Scale bars: 2 μm.

References

    1. Anvarian, Z., Mykytyn K., Mukhopadhyay S., Pedersen L.B., and Christensen S.T.. 2019. Cellular signalling by primary cilia in development, organ function and disease. Nat. Rev. Nephrol. 15:199–219. 10.1038/s41581-019-0116-9 - DOI - PMC - PubMed
    1. Bowie, E., Norris R., Anderson K.V., and Goetz S.C.. 2018. Spinocerebellar ataxia type 11-associated alleles of Ttbk2 dominantly interfere with ciliogenesis and cilium stability. PLoS Genet. 14:e1007844. 10.1371/journal.pgen.1007844 - DOI - PMC - PubMed
    1. Fisher, R.P. 2005. Secrets of a double agent: CDK7 in cell-cycle control and transcription. J. Cell Sci. 118:5171–5180. 10.1242/jcs.02718 - DOI - PubMed
    1. George, M.A., Qureshi S., Omene C., Toppmeyer D.L., and Ganesan S.. 2021. Clinical and pharmacologic differences of CDK4/6 inhibitors in breast cancer. Front. Oncol. 11:693104. 10.3389/fonc.2021.693104 - DOI - PMC - PubMed
    1. Goetz, S.C., and Anderson K.V.. 2010. The primary cilium: A signalling centre during vertebrate development. Nat. Rev. Genet. 11:331–344. 10.1038/nrg2774 - DOI - PMC - PubMed

LinkOut - more resources