. 2025 Jan 6;222(1):e20240010.
doi: 10.1084/jem.20240010. Epub 2024 Dec 5.

Human DBR1 deficiency impairs stress granule-dependent PKR antiviral immunity

Affiliations

Human DBR1 deficiency impairs stress granule-dependent PKR antiviral immunity

Shuo Ru et al. J Exp Med. .

Abstract

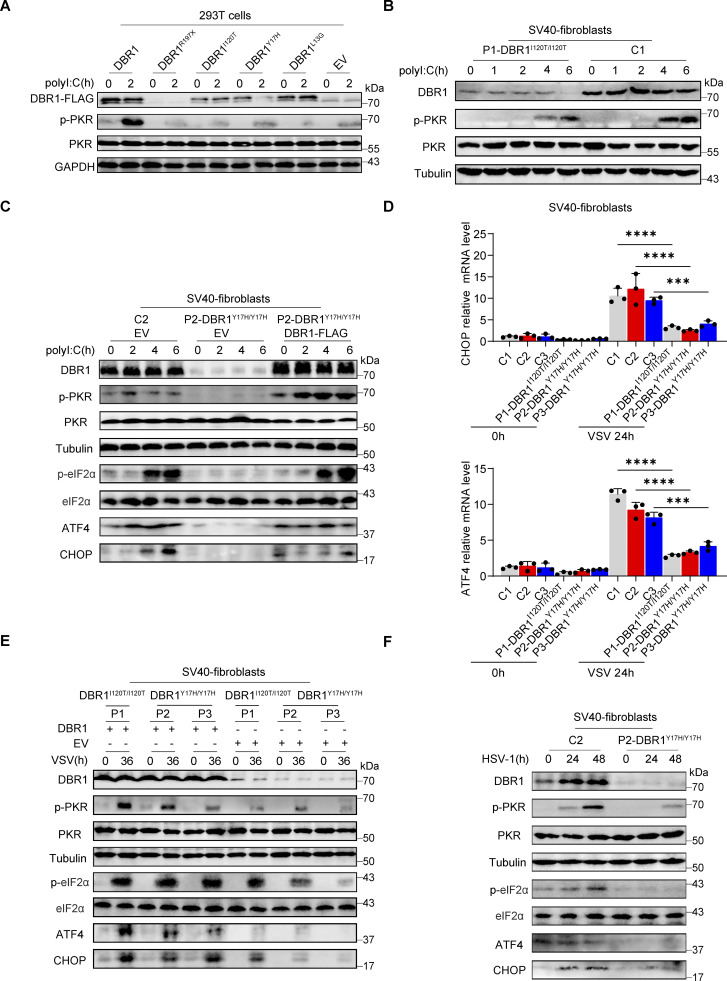
The molecular mechanism by which inborn errors of the human RNA lariat-debranching enzyme 1 (DBR1) underlie brainstem viral encephalitis is unknown. We show here that the accumulation of RNA lariats in human DBR1-deficient cells interferes with stress granule (SG) assembly, promoting the proteasome degradation of at least G3BP1 and G3BP2, two key components of SGs. In turn, impaired assembly of SGs, which normally recruit PKR, impairs PKR activation and activity against viruses, including HSV-1. Remarkably, the genetic ablation of PKR abolishes the corresponding antiviral effect of DBR1 in vitro. We also show that Dbr1Y17H/Y17H mice are susceptible to similar viral infections in vivo. Moreover, cells and brain samples from Dbr1Y17H/Y17H mice exhibit decreased G3BP1/2 expression and PKR phosphorylation. Thus, the debranching of RNA lariats by DBR1 permits G3BP1/2- and SG assembly-mediated PKR activation and cell-intrinsic antiviral immunity in mice and humans. DBR1-deficient patients are prone to viral disease because of intracellular lariat accumulation, which impairs G3BP1/2- and SG assembly-dependent PKR activation.


Conflict of interest statement

Disclosures: W. Fairbrother reported being a co-founder of Walah Scientific, a COVID breathalyzer company. W. Fairbrother is on the SAB of ReMIX. No other disclosures were reported.

Figures

Figure S1.
Figure S1.
DBR1 regulates the activation of PKR and integrated stress response rather than IFN response. (A) RT-qPCR detection of DBR1 mRNA in BJ cells transduced with scrambled and shDBR1. Data representative of three independent experiments. Graphs depict mean with SD and points represent biological replicates. Statistical analysis was performed with t tests. ***, P < 0.001. (B) BJ cells with scrambled shRNA or shDBR1 were stimulated with polyI:C, followed by RT-qPCR analysis of the indicated IFN or ISGs. Data representative of three independent experiments. Graphs depict points that represent biological replicates. (C) RT-qPCR detection of DBR1 mRNA in BJ cells transduced with overexpressing DBR1 relative to control. Data representative of three independent experiments. Graphs depict mean with SD, and points represent biological replicates. Statistical analysis was performed with t tests. ***, P < 0.001. (D) BJ cells with EV or DBR1 overexpression were stimulated with IFNβ, followed by RT-qPCR analysis of EV and DBR1 BJ cells for expression of the indicated ISGs. Data representative of three independent experiments. Graphs depict points that represent biological replicates. (E) RT-qPCR detection of DBR1 mRNA in HEK293T cells transduced with scrambled and shDBR1. Data representative of three independent experiments. Graphs depict the mean with SD and points represent biological replicates. Statistical analysis was performed with unpaired t tests. ****, P < 0.0001. (F) RT-qPCR detection of DBR1 mRNA in HEK293T cells transduced with DBR1 relative to control. Data representative of three independent experiments. Graphs depict the mean with SD and points represent biological replicates. Statistical analysis was performed with t tests. ****, P < 0.0001. (G) RT-qPCR determination of ID1, DKK1 RNA lariat levels in HEK293T scrambled control and shDBR1 cells. Data representative of three independent experiments. Graphs depict mean with SD and points represent biological replicates. Statistical analysis was performed with one-way ANOVA with Dunnett’s multiple comparisons test. ****, P < 0.0001. (H and I) HEK293T scrambled control or shDBR1 cells were infected with VSV at an MOI of 0.1 (H) or HSV-1 at an MOI of 0.5 (I) for 24 h, and viral replication was then detected by RT-qPCR. Data representative of three independent experiments. Graphs depict the mean with SD and points represent biological replicates. Statistical analysis was performed with one-way ANOVA with Dunnett’s multiple comparisons test. ****, P < 0.0001. (J) HEK293T cells transfected with the scramble shRNA or shDBR1 were stimulated with polyI:C (1 µg/ml), followed by WB for indicated proteins. Tubulin was used as a loading control. Data shown are representative of three independent experiments. (K and L) HEK293T cells transduced with the scrambled shRNA, shDBR1, or shDBR1 with DBR1 for rescue were analyzed by WB with the indicated antibodies (K). GAPDH was used as a loading control. Data shown are representative of three independent experiments. RT-qPCR for RNA lariat detection (L). Data representative of three independent experiments. Graphs depict mean with SD, and points represent biological replicates. Statistical analysis was performed with one-way ANOVA with Dunnett’s multiple comparisons test. **, P < 0.01; ***, P < 0.001. (M) HEK293T cells transduced with shDBR1 or shDBR1 cells transduced with DBR1 for rescue were infected with HSV-1 (left) or VSV (right), and viral mRNA was then quantified by RT-qPCR. Statistical analysis was performed with unpaired t tests. **, P < 0.01. Data representative of three independent experiments. Graphs depict mean with SD, and points represent biological replicates. (N) RT-qPCR analysis of control, shDBR1-transduced and DBR1-overexpressing HEK293T cells for assessment of the expression of the indicated ISR genes. Data representative of three independent experiments. Graphs depict mean with SD, and points represent biological replicates. Statistical analysis was performed with one-way ANOVA with Dunnett’s multiple comparisons test. **, P < 0.01. (O) Stimulation with polyI:C (1 µg/ml) in THP-1 cells transduced with the scramble shRNA or shDBR1, followed by WB for indicated proteins. GAPDH was used as a loading control. Data shown are representative of three independent experiments. (P) THP1 cells transduced with EV or DBR1 were stimulated with polyI:C (1 µg/ml) and WB was then performed with the indicated antibodies. GAPDH was used as a loading control. Data shown are representative of three independent experiments. (Q) HEK293T cells transduced with the scrambled shRNA or shDBR1 were subjected to HSV-1 infection (MOI: 0.5) for various time points. WB was then performed with the indicated antibodies. GAPDH was used as a loading control. Data shown are representative of three independent experiments. (R and S) THP-1 cells transduced with the scrambled shRNA or shDBR1 were subjected to HSV-1 infection (MOI: 0.5) (R) or VSV infection (MOI: 0.1) (S) for various time points, followed by WB for the indicated proteins. GAPDH was used as a loading control. Data shown are representative of three independent experiments. (T) RT-qPCR quantification of ID1 and DKK1 RNA lariat levels in fibroblasts from the control and patients. Data representative of three independent experiments. Graphs depict mean with SD, and points represent biological replicates. Statistical analysis was performed with one-way ANOVA with Dunnett’s multiple comparisons test. ***, P < 0.001; ****, P < 0.0001. (U–W) Cells from the control and the patient were infected with VSV at a MOI of 0.1, and RT-qPCR was then performed for detection of the expression of viral genes (U), IFN and ISG genes (V and W). Data representative of three independent experiments. Graphs depict mean with SD, and points represent biological replicates. Statistical analysis was performed with one-way ANOVA with Dunnett’s multiple comparisons test. **, P < 0.01; ***, P < 0.001; ****, P < 0.0001. (X) Patient’s cells were rescued by transfection with DBR1, and RT-qPCR was then performed to assess ID1 and DKK1 lariat levels. Data representative of three independent experiments. Graphs depict mean with SD, and points represent biological replicates. Statistical analysis was performed with t tests. **, P < 0.01; ***, P < 0.001. (Y) Control and patient’s cells were infected with HSV-1 (MOI: 0.5), and viral mRNA was then quantified by RT-qPCR. Data representative of three independent experiments. Graphs depict mean with SD, and points represent biological replicates. Statistical analysis was performed with t tests. **, P < 0.01. Source data are available for this figure: SourceData FS1.
Figure 1.
Figure 1.
DBR1 regulates the PKR-mediated stress response during viral infection. (A) RT-qPCR determination of ID1, DKK1 RNA lariat levels in BJ scrambled control and shDBR1 cells. Data are representative of three independent experiments. Graphs depict the mean with standard deviation (SD), and points represent biological replicates. Statistical analysis was performed with one-way ANOVA with Dunnett’s multiple comparisons test. **, P < 0.01. (B) BJ cells stably expressing Flag-DBR1 and an shRNA against DBR1 together with a scrambled/EV control were transfected and stimulated with polyI:C (1 µg/ml), and were then subjected to WB analysis with the indicated antibodies. GAPDH was used as a loading control. Data shown are representative of three independent experiments. (C) shDBR1 BJ cells transfected with EV or DBR1 were transfected with polyI:C (1 µg/ml) for 0, 2, or 4 h. Cell lysates were then prepared and subjected to WB with the indicated antibodies. Tubulin was used as a loading control. Data shown are representative of three independent experiments. (D) Following stimulation with polyI:C (1 µg/ml) in scrambled control and shDBR1 BJ cells, RT-qPCR was performed to quantify CHOP and ATF4 mRNA levels. Data are representative of three independent experiments. Graphs depict the mean with SD, and points represent biological replicates. Statistical analysis was performed with one-way ANOVA with Dunnett’s multiple comparisons test. ****, P < 0.0001. (E) BJ scrambled control or shDBR1 cells were infected with VSV at an MOI of 0.1 for 24 h, and viral replication was then detected by RT-qPCR. Data are representative of three independent experiments. Graphs depict the mean with SD, and points represent biological replicates. Statistical analysis was performed with one-way ANOVA with Dunnett’s multiple comparisons test. **, P < 0.01. (F) BJ cells transduced with scrambled shRNA or shDBR1 were infected with VSV at an MOI of 0.1 for various times. The cells were then lysed and subjected to WB with the indicated antibodies. GAPDH was used as a loading control. Data shown are representative of three independent experiments. (G) BJ cells transduced with scrambled shRNA or shDBR1 were infected with HSV-1 at an MOI of 0.5 for 24 h and then quantified for viral mRNA by RT-qPCR. Data representative of three independent experiments. Graphs depict the mean with SD, and points represent biological replicates. Statistical analysis was performed with one-way ANOVA with Dunnett’s multiple comparisons test. ***, P < 0.001. (H) BJ cells transduced with scrambled shRNA or shDBR1 were infected with HSV-1 at an MOI of 0.5 for various times. The cells were then lysed and subjected to WB with the indicated antibodies, followed by the p-PKR/PKR WB grayscale analysis of three independent experiments. GAPDH was used as a loading control. (I and J) BJ cells were infected with HSV-1 (MOI: 0.5) for 24 h and then quantified for the expression of the indicated ISR genes (I), IFNB and the indicated ISGs (J) by RT-qPCR. Data are representative of three independent experiments. Graphs depict the mean with SD and points represent biological replicates. Statistical analysis was performed with t tests. **, P < 0.01; ***, P < 0.001. Source data are available for this figure: SourceData F1.
Figure 2.
Figure 2.
DBR1 mutants from the patients fail to potentiate the PKR-mediated stress response. (A) WT DBR1 or DBR1 variants from patients with brainstem encephalitis were overexpressed in HEK293T cells and then stimulated with polyI:C transfection (1 µg/ml). The cells were lysed and subjected to WB for detection of the indicated proteins. GAPDH was used as a loading control. Data shown are representative of three independent experiments. (B and C) SV40-transformed fibroblasts (SV40-fibroblasts) from control and two patients, P1-DBR1I120T/I120T (B) and P2-DBR1Y17H/Y17H without and with WT DBR1 rescue (C) were transfected with 1 µg/ml polyI:C and subjected to WB with the indicated antibodies. Tubulin was used as a loading control. Data shown are representative of three independent experiments. (D) SV40-fibroblasts from control or DBR1-deficient patients were infected with VSV, and RT-qPCR was performed to assess the expression of the indicated ISR genes. Data are representative of three independent experiments. Graphs depict the mean with SD, and points represent biological replicates. Statistical analysis was performed with one-way ANOVA with Dunnett’s multiple comparisons test. ***, P < 0.001; ****, P < 0.0001. (E) SV40-fibroblasts from three patients, P1-DBR1I120T/I120T, P2-DBR1Y17H/Y17H, and P3-DBR1Y17H/Y17H without or with WT DBR1 rescue were infected with VSV at an MOI of 0.1, followed by WB for indicated antibodies. Tubulin was used as a loading control. Data shown are representative of three independent experiments. (F) SV40-fibroblasts from a healthy control and a DBR1-deficient patient were infected with HSV-1 at an MOI of 0.5, followed by WB for indicated antibodies. Tubulin was used as a loading control. Data shown are representative of three independent experiments. Source data are available for this figure: SourceData F2.
Figure S2.
Figure S2.
DBR1 influences PKR antiviral function by modulating the level of RNA lariats. (A and B) HEK293T cells with or without PKR overexpression were infected with HSV-1-GFP at an MOI of 0.5 (A), or VSV at an MOI of 0.1 (B) for 24 h. RT-qPCR was performed to confirm viral infection. Data representative of three independent experiments. Graphs depict mean with SD, and points represent biological replicates. Statistical analysis was performed with t tests. **, P < 0.01; ****, P < 0.0001. (C) PKR+/+ and PKR−/− BJ cells were infected with VSV-GFP at an MOI of 0.1, or HSV-1-GFP at an MOI of 0.5 for 24 h, and fluorescence imaging was then performed. Scale bars, 100 µm. Data shown are representative of three independent experiments. (D and E) HEK293T cells transduced with EV or PKR were infected with VSV at an MOI of 0.1 (D), or HSV-1 at an MOI of 0.5 (E); WB was then performed with the indicated antibodies, followed by the p-PKR/PKR WB grayscale analysis of three independent experiments. Tubulin was used as a loading control. Data shown are representative of three independent experiments. Graphs depict the mean with SD and points represent biological replicates. (F) PKR+/+ and PKR−/− BJ cells were transduced with EV or DBR1 and infected with VSV-GFP (MOI: 0.1), or HSV-1-GFP (MOI: 0.5) for 24 h, and fluorescence imaging was then performed for viral GFP. Scale bars, 100 µm. Data shown are representative of three independent experiments. (G) shDBR1 BJ cells transduced with EV or PKR were infected with HSV-1-GFP at an MOI of 0.5, or VSV at an MOI of 0.1 for 24 h. Scale bars, 100 µm. Data shown are representative of three independent experiments. (H) shDBR1 HEK293T cells transduced with EV or PKR were infected with HSV-1-GFP at an MOI of 0.1 for 24 h or VSV at an MOI of 0.1, RT-qPCR was then performed to detect the expression of viral genes. Data representative of three independent experiments. Graphs depict mean with SD and points represent biological replicates. Statistical analysis was performed with unpaired t tests. **, P < 0.01; ***, P < 0.001. (I and J) RNA was extracted from HEK293T cells transduced with scrambled shRNA, shDBR1, or DBR1. The purified RNA was then used to transfect HEK293T cells for 4 h. Cells were infected with VSV at an MOI of 0.01 for 24 h. Viral titers were assessed by fluorescence imaging (I). Scale bars, 100 µm. Data shown are representative of three independent experiments. Viral titers were assessed RT-qPCR (J). Data representative of three independent experiments. Graphs depict mean with SD, and points represent biological replicates. Statistical analysis was performed with one-way ANOVA with Dunnett’s multiple comparisons test. **, P < 0.01. (K) HEK293T cells were transfected with 1 µg/ml RNA purified from HEK293T cells transduced with the scrambled control shRNA, or shDBR1 for different time periods, and were then infected with VSV-GFP at a MOI of 0.01 for 24 h. And the viral gene expression was quantified by RT-qPCR. Data representative of three independent experiments. Graphs depict mean with SD, and points represent biological replicates. Statistical analysis was performed with unpaired t tests one-way ANOVA with Dunnett’s multiple comparisons test. NS, not significant, ***, P < 0.001; ****, P < 0.0001. (L) Diagram of RNA lariat-expressing plasmid design and fluorescence imaging. Scale bars, 20 µm. Data shown are representative of three independent experiments. (M and N) HEK293T cells expressing ID1/DKK1-Lariats or ID1/DKK1-Lariats/DBR1 were infected with HSV-1 at an MOI of 0.05 (M) or VSV at an MOI of 0.01 (N), and viral replication was then determined by RT-qPCR. Data representative of three independent experiments. Graphs depict mean with SD, and points represent biological replicates. Statistical analysis was performed with t tests. **, P < 0.01. (O and P) HeLa cells transduced with the scrambled control, shDBR1, or ID1/DKK1-Lariats were infected with VSV at an MOI of 0.1 for 24 h, and the viral GFP was then detected by FACS. Data representative of three independent experiments. Graphs depict mean with SD, and points represent biological replicates. Statistical analysis was performed with one-way ANOVA with Dunnett’s multiple comparisons test. ****, P < 0.0001. (Q and R) RT-qPCR assays for circRNA quantification in HEK293T cells transduced with shDBR1 (Q) or DBR1 (R) cells relative to control. Statistical analysis was performed with unpaired t tests. NS, not significant. Data representative of three independent experiments. Graphs depict mean with SD, and points represent biological replicates. (S) RT-qPCR assays for circRNA in cells from patients relative to controls. Statistical analysis was performed with unpaired t tests. NS, not significant. Data representative of three independent experiments. Graphs depict mean with SD, and points represent biological replicates. Source data are available for this figure: SourceData FS2.
Figure 3.
Figure 3.
PKR is required for the antiviral activity of DBR1. (A) PKR+/+ and PKR−/− BJ cells were transduced with EV or DBR1, followed by WB for indicated antibodies. GAPDH was used as a loading control. Data shown are representative of three independent experiments. (B) PKR+/+ and PKR−/− BJ cells were transduced with EV or DBR1 and infected with HSV-1 at an MOI of 0.5, followed by quantification of virus replication by RT-qPCR. Data representative of three independent experiments. Graphs depict the mean with SD and points represent biological replicates. Statistical analysis was performed with one-way ANOVA with Dunnett’s multiple comparisons test. NS, not significant, ****, P < 0.0001. (C) Similar to B, except the supernatant was collected at different time points for viral titration. Data representative of three independent experiments. Graphs depict the mean with SD, and points represent biological replicates. Statistical analysis was performed with one-way ANOVA with Dunnett’s multiple comparisons test. NS, not significant, ***, P < 0.001. (D) Similar to B, except the cells were infected with VSV at an MOI of 0.1 (n = 3 for each group). Data representative of three independent experiments. Graphs depict the mean with SD, and points represent biological replicates. Statistical analysis was performed with one-way ANOVA with Dunnett’s multiple comparisons test. ****, P < 0.0001. (E) Similar to C, except the cells were infected with VSV at an MOI of 0.1. Data are representative of three independent experiments. Graphs depict the mean with SD and points represent biological replicates. Statistical analysis was performed with one-way ANOVA with Dunnett’s multiple comparisons test. NS, not significant, ****, P < 0.0001. (F) Similar to B and D except that the cells were analyzed by WB for the indicated antibodies. Tubulin was used as a loading control. Data shown are representative of three independent experiments. (G) Similar to B except that expression of the indicated ISRs was detected by RT-qPCR. Data representative of three independent experiments. Graphs depict mean with SD, and points represent biological replicates. Statistical analysis was performed with one-way ANOVA with Dunnett’s multiple comparisons test. **, P < 0.01; ***, P < 0.001; ****, P < 0.0001. (H and I) PKR+/+ and PKR−/− BJ cells were transduced with scrambled shRNA or shDBR1 and infected with VSV MOI = 0.1 (H) or HSV-1-GFP MOI = 0.5 (I), followed by quantification of virus replication by RT-qPCR. Data representative of three independent experiments. Graphs depict the mean with SD and points represent biological replicates. Statistical analysis was performed with one-way ANOVA with Dunnett’s multiple comparisons test. *, P < 0.05; ***, P < 0.001; ****, P < 0.0001. (J) PKR+/+ and PKR−/− BJ cells were transduced with scrambled shRNA or shDBR1, and WB was then performed to detect the indicated proteins. Tubulin was used as a loading control. Data shown are representative of three independent experiments. (K and L) BJ cells transduced with the scrambled control or shDBR1 cells together with EV or PKR overexpression were infected with VSV-GFP (MOI: 0.1) (K), or HSV-1-GFP (MOI: 0.5) (L) for 24 h, followed by quantification of virus replication by RT-qPCR (n = 3 for each group). Data representative of three independent experiments. Graphs depict the mean with SD and points represent biological replicates. Statistical analysis was performed with one-way ANOVA with Dunnett’s multiple comparisons test. ***, P < 0.001; ****, P < 0.0001. (M) Similar to L, except that the cells overexpressing DBR1-copGFP and DBR1Y17H were also included, and the indicated proteins were detected by WB. Tubulin was used as a loading control. Data shown are representative of three independent experiments. Source data are available for this figure: SourceData F3.
Figure 4.
Figure 4.
RNA lariats inhibit PKR activation and weaken cellular antiviral activity. (A) HEK293T cells were transfected with 1 µg/ml RNA purified from shDBR1 HEK293T cells, and ID1 and DKK1 lariat RNA levels were determined by RT-qPCR. Data representative of three independent experiments. Graphs depict the mean with SD and points represent biological replicates. Statistical analysis was performed with one-way ANOVA with Dunnett’s multiple comparisons test. NS, not significant, **, P < 0.01; ***, P < 0.001. (B and C) HEK293T cells were transfected with 1 µg/ml RNA purified from HEK293T cells transduced with the scrambled shRNA, shDBR1, or DBR1 for 2 h and were then infected with VSV-GFP at a MOI of 0.01 for 24 h. Flow cytometry was then performed to analyze viral GFP levels. Data representative of three independent experiments. Graphs depict the mean with SD and points represent biological replicates. Statistical analysis was performed with one-way ANOVA with Dunnett’s multiple comparisons test. **, P < 0.01; ***, P < 0.001. (D and E) HEK293T cells were transfected with 1 µg/ml RNA purified from HEK293T cells transduced with scrambled shRNA or shDBR1 for 2 h and infected with HSV-1 at an MOI of 0.1 (D) or VSV at a MOI of 0.01 (E) for various time points, followed by quantification of virus replication by RT-qPCR. Data representative of three independent experiments. Graphs depict the mean with SD and points represent biological replicates. (F) HEK293T cells were transfected with 0.8 µg/ml RnaseR-digested RNA purified from HEK293T cells transduced with scrambled control shRNA or shDBR1, and then infected with VSV at a MOI of 0.01 for 24 h, followed by quantification of virus replication by RT-qPCR. Data representative of three independent experiments. Graphs depict the mean with SD and points represent biological replicates. Statistical analysis was performed with one-way ANOVA with Dunnett’s multiple comparisons test. *, P < 0.05; ***, P < 0.001. (G) HEK293T PKR+/+ and PKR−/− cells were transfected with 0.8 µg/ml RnaseR-digested RNA purified from HEK293T cells transduced with scrambled control shRNA or shDBR1, and infected with HSV-1 at a MOI of 0.1 for 24 h, followed by quantification of virus replication by RT-qPCR. Data representative of three independent experiments. Graphs depict the mean with SD and points represent biological replicates. Statistical analysis was performed with one-way ANOVA with Dunnett’s multiple comparisons test. NS, not significant, **, P < 0.01; ***, P < 0.001. (H) HEK293T cells were transfected with 1 µg/ml RNA purified from HEK293T cells transduced with scrambled control shRNA, shDBR1, or DBR1, and stimulated with polyI:C or infected with HSV-1 at an MOI of 0.5 or VSV at a MOI of 0.1 for 24 h. Cell lysates were detected by WB with the indicated antibodies. GAPDH was used as a loading control. Data shown are representative of three independent experiments. (I) Diagram of RNA lariat-expressing plasmid design. This graph is created in BioRender. Ru, S. (2024) https://BioRender.com/u76g969. (J) HEK293T cells were transfected with the lariat-expressing plasmids for 24 h, and lariat RNA ID1 and DKK1 levels were measured by RT-qPCR. Data representative of three independent experiments. Graphs depict the mean with SD and points represent biological replicates. Statistical analysis was performed with one-way ANOVA with Dunnett’s multiple comparisons test. NS, not significant, ***, P < 0.001; ****, P < 0.0001. (K and L) HEK293T cells were transfected with lariat-expressing plasmids for 24 h; they were then infected with HSV-GFP (MOI: 0.5) (K) or VSV-GFP (MOI: 0.1) (L) and viral gene expression was quantified by RT-qPCR. Data representative of three independent experiments. Graphs depict the mean with SD and points represent biological replicates. Statistical analysis was performed with one-way ANOVA with Dunnett’s multiple comparisons test. ***, P < 0.001. (M) HEK293T cells were transfected with lariat ID1 or lariat DKK1 plasmids together with or without PKR overexpression. Cells were then stimulated with polyI:C and WB was then performed with the indicated antibodies. GAPDH was used as a loading control. Data shown are representative of three independent experiments. Source data are available for this figure: SourceData F4.
Figure S3.
Figure S3.
DBR1 licenses G3BP proteins to form SGs. (A) WB with indicated antibodies after immunoprecipitation with an anti-FLAG antibody on lysates of HEK239T cells in an overexpression system. Data shown are representative of three independent experiments. (B) BJ cells were infected with VSV at an MOI of 0.1, or HSV-1 at an MOI of 0.5 for 12 h; immunofluorescence detection was then performed for PKR, G3BP2, and G3BP1-mNeonGreen. Scale bars, 20 µm. Data shown are representative of three independent experiments. (C and D) HEK293T G3BP2-mNeonGreen/DBR1-mScarlet cells were imaged (C) and the intracellular G3BP2- mNeonGreen puncta were quantified (D). Scale bars, 50 µm. Data shown are representative of three independent experiments. Data are representative of three independent experiments. Graphs depict the mean with SD and points represent biological replicates. Statistical analysis was performed with one-way ANOVA with Dunnett’s multiple comparisons test. NS, not significant, ****, P < 0.0001. (E) Fluorescence images of HEK293T G3BP-mNeonGreen and HEK293T shDBR1/G3BP-mNeonGreen cells. Scale bars, 50 µm. Data shown are representative of three independent experiments. Data representative of three independent experiments. Graphs depict mean with SD, and points represent biological replicates. Statistical analysis was performed with one-way ANOVA with Dunnett’s multiple comparisons test. **, P < 0.01. (F and G) THP-1 cells (D) and cells from patients (E) and controls were analyzed by WB with the indicated antibodies. VCL was used as a loading control. Data shown are representative of three independent experiments. (H) G3BP1−/− HeLa cells and control cells were treated with 500 µM SA, and WB was then performed with the indicated antibodies. VCL was used as a loading control. Data shown are representative of three independent experiments. (I) G3BP DKO U2OS cells and control cells were stimulated with polyI:C (2 µg/ml) for 4 h, and WB was then performed with the indicated antibodies. VCL was used as a loading control. Data shown are representative of three independent experiments. (J) G3BP DKO HEK293T cells and control cells were stimulated with polyI:C (1 µg/ml) for various time points, and WB was then performed with the indicated antibodies. VCL was used as a loading control. Data shown are representative of three independent experiments. (K) HEK293T cells with overexpression of the indicated proteins were infected with VSV at an MOI of 0.1, and WB was then performed with the indicated antibodies, followed by the p-PKR/PKR WB gray scale analysis of three independent experiments. GAPDH was used as a loading control. Graphs depict points represent biological replicates. Data shown are representative of three independent experiments. Source data are available for this figure: SourceData FS3.
Figure 5.
Figure 5.
G3BP SG assembly and G3BP protein levels remain low in DBR1-deficient cells. (A) BJ cells transduced with the scrambled control shRNA or with shDBR1 were infected with the indicated viruses, and SG formation was then followed by G3BP1 staining, microscopy imaging, and the SG puncta quantification. Scale bar, 20 µm. Data shown are representative of three independent experiments. Graphs depict the mean with SD and points represent biological replicates. Statistical analysis was performed with one-way ANOVA with Dunnett’s multiple comparisons test. ****, P < 0.0001. (B) HEK293T cells transduced with the scrambled shRNA or with shDBR1 were stimulated with polyI:C (1 µg/ml) or infected with VSV (MOI: 0.01) or HSV-1 (MOI: 0.05) and G3BP1 was then detected by fluorescence. Scale bar, 20 µm. Data shown are representative of six independent experiments. (C) HeLa cells transduced with the scrambled control shRNA or with shDBR1 were stimulated with polyI:C (1 µg/ml) and G3BP1 was then detected by fluorescence microscopy. Scale bar, 20 µm. Data shown are representative of three independent experiments. (D and E) Control cells and cells from a DBR1-deficient patient were infected with VSV (MOI = 0.01) for 24 h, stimulated with polyI:C (1 µg/ml) for 4 h (D), or treated with 500 µM sodium arsenite (SA) for 1 h (E). Immunofluorescence staining was then performed for the indicated markers and SGs were quantified. Scale bar, 20 µm. Data shown are representative of three independent experiments. Graphs depict the mean with SD and points represent biological replicates. Statistical analysis was performed with one-way ANOVA with Dunnett’s multiple comparisons test. NS, not significant, **, P < 0.01; ****, P < 0.0001. (F) HEK293T cells transduced with shDBR1 or DBR1-mscarlet were subjected to immunofluorescence staining for the indicated markers. Scale bar, 20 µm. Data shown are representative of three independent experiments. (G) HEK293T cells transduced with the scrambled control shRNA, and shDBR1 cells expressing G3BP2-mNeonGreen were transfected with polyI:C (1 µg/ml) for 4 h, and the markers indicated were then detected by fluorescence microscopy. Scale bar, 20 µm. Data shown are representative of six independent experiments. (H) RT-qPCR and WB detection of G3BP expression in indicated HeLa cells. GAPDH was used as a loading control. Data shown are representative of three independent experiments. Graph points represent biological replicates. (I) FACS analysis of the expression of G3BP (uninfected) and viral GFP after VSV-GFP (MOI: 0.01) infection for 24 h in EBV-B cells from a control or a DBR1-deficient patient. Data shown are representative of three independent experiments. (J and K) G3BP1+/+ and G3BP1−/− HeLa cells transduced with EV or DBR1 were infected with VSV-GFP (MOI: 0.01); viral gene expression was then quantified by RT-qPCR (J). Data shown are representative of three independent experiments. Graphs depict the mean with SD and points represent biological replicates. Statistical analysis was performed with one-way ANOVA with Dunnett’s multiple comparisons test. **, P < 0.01; ****, P < 0.0001. Proteins were detected by WB detection with indicated antibodies (K). Vinculin (VCL) was used as a loading control. Data shown are representative of three independent experiments. (L) Scrambled shRNA and shDBR1 HeLa cells transduced with EV or G3BP1 were infected with HSV-1. Viral gene expression was then quantified by RT-qPCR. Data shown are representative of three independent experiments. Graphs depict mean with SD, and points represent biological replicates. Statistical analysis was performed with one-way ANOVA with Dunnett’s multiple comparisons test. NS, not significant, ***, P < 0.001; ****, P < 0.0001. Source data are available for this figure: SourceData F5.
Figure S4.
Figure S4.
The stability of the G3BP protein is compromised by RNA lariats. (A) PKR+/+ and PKR−/− BJ cells were infected with VSV at an MOI of 0.01, or HSV-1-GFP at an MOI of 0.5 for 24 h, stimulated with polyI:C (2 µg/ml) for 5 h or heat stressed at 43°C for 40 min; immunofluorescence analysis was then performed for G3BP1. Scale bars, 20 µm. Data representative of three independent experiments. Graphs depict mean with SD, and points represent biological replicates. Statistical analysis was performed with one-way ANOVA with Dunnett’s multiple comparisons test. *, P < 0.05; **, P < 0.01; ***, P < 0.001; ****, P < 0.0001. (B) WT and shDBR1-transduced cells were transfected with lariat RNA for 8 h; immunofluorescence analysis was then performed for G3BP1-SGs. Scale bars, 20 µm. Data representative of three independent experiments. Graphs depict the mean with SD and points represent biological replicates. Statistical analysis was performed with unpaired t tests. *, P < 0.05. (C) Lariat RNA was used to transfect shDBR1 HEK293T cells, and immunofluorescence analysis was then performed for G3BP1. Scale bars, 20 µm. Data representative of three independent experiments. (D) Fluorescence analysis of MCP (red) in HEK293T cells transfected with ID1/DKK1-8xMS2 -lariats (left). The percentage of cells with MCP and ID1/DKK1-8xMS2 -lariats foci was quantified (right), and at least 100 cells from each group were analyzed (n = 3 for each group). Scale bars, 50 µm. Data representative of six independent experiments. Graphs depict the mean with SD and points represent biological replicates. Statistical analysis was performed with unpaired t tests. ***, P < 0.001. (E) WB with the indicated antibodies following immunoprecipitation with an anti-FLAG (MCP) antibody on lysates of HEK293T cells in an overexpression system. Data representative of three independent experiments. (F) HEK293T cells were transfected with G3BP1/2-mNeonGreen, PKR-BFP or MCP-mScarlet separately, followed by immunofluorescence imaging. Scale bars, 20 µm. Data representative of three at least six independent experiments. (G) HEK293T G3BP1-mNenonGreen cells were transfected with ID1/DKK1-lariats, circRNA (circFNDC3B and circCAMSAP1) or polyI:C stimulation, and the formation of G3BP1 puncta was detected by immunofluorescence. Scale bars, 20 µm. Data representative of three independent experiments. (H) WB with the indicated antibodies following IP with an anti-FLAG (MCP) antibody for lysates of HEK293T PKR+/+ and PKR−/− cells in a stable overexpression system. Data representative of three independent experiments. (I) HEK293T PKR−/− cells with ID1/DKK1-MS2-Lariats/MCP-mScarlet/G3BP- mNeonGreen/shDBR1 transduction were imaged for the indicated fluorescence markers. Scale bars, 20 µm. Data representative of at least six independent experiments. (J) SG component analysis (log fold change) of shDBR1 versus scrambled cells, following VSV infection G3BP1 IP and mass spectrometry. (K) HEK293T shDBR1/G3BP2-mNeonGreen cells were treated with the proteasome inhibitor MG132 and the autophagy inhibitor CQ for 18 h, and FACS was performed to assess G3BP2-mNeonGreen fluorescence recovery. Data shown are representative of three independent experiments. (L) FACS was performed to assess G3BP2-mNeonGreen fluorescence recovery before and after the treatment of HEK293T G3BP2-mNeonGreen, shDBR1/G3BP2-mNeonGreen cells with various concentrations of the proteasome inhibitor MG132. Data shown are representative of three independent experiments. (M and N) HeLa scrambled control or shDBR1 cells were treated with MG132 for 4 h, and then were infected with VSV at an MOI of 0.1 (M) or HSV-1 at an MOI of 0.5 (N) for 24 h, and viral replication was then detected by RT-qPCR. Data representative of three independent experiments. Graphs depict mean with SD, and points represent biological replicates. Statistical analysis was performed with one-way ANOVA with Dunnett’s multiple comparisons test. ****, P < 0.0001. (O) WB with the indicated antibodies following immunoprecipitation with an anti-FLAG-(Flag-UB) antibody for the lysates of HEK239T cells in an overexpression system. Data shown are representative of three independent experiments. Source data are available for this figure: SourceData FS4.
Figure 6.
Figure 6.
RNA lariats interact with G3BP protein, impairing SG function and G3BP protein stability. (A) Extracted RNA from HEK293T cells transduced with shDBR1/ID1/DKK1-lariats or control cells was used to transfect HeLa cells transduced with the scrambled shRNA or shDBR1 for 24 h; fluorescence imaging was then performed for the indicated markers. Scale bar, 20 µm. Data shown are representative of three independent experiments. (B) Lariat imaging with MCP-mScarlet and puncta quantification in HEK293T cells (n = 12 for each group). Scale bar, 20 µm. Data representative of three independent experiments. Graphs depict mean with SD, and points represent biological replicates. Statistical analysis was performed with one-way ANOVA with Dunnett’s multiple comparisons test. *, P < 0.05; ****, P < 0.0001. (C) WB with the indicated antibodies following immunoprecipitation with the anti-FLAG (MCP) antibody on lysates from HEK239T cells in an overexpression system. Data shown are representative of three independent experiments. (D) HEK293T cells with ID1/DKK1-MS2-Lariats/MCP-mScarlet/G3BP-mNeonGreen/PKR-BFP/shDBR1 overexpression were imaged with the indicated fluorescence markers. Scale bar, 20 µm. Data shown are representative of three independent experiments. (E) HEK293T G3BP DKO cells with ID1/DKK1-MS2-Lariats/MCP-mScarlet/PKR-GFP/shDBR1 overexpression were imaged with indicated fluorescence markers. Scale bar, 20 µm. Data shown are representative of three independent experiments. (F and G) FRAP assay to detect the fluorescence recovery of G3BP2-mNeonGreen 3 days after shRNA transduction. Scale bars, 5 µm (F). Data representative of three independent experiments. Graphs depict mean with SD, and points represent biological replicates. (H) HEK293T cells transduced with shDBR1 or shDBR1/ID1-DKK1-lariat were treated with MG132 or BafA1, and WB was then performed to detect the indicated proteins, followed by relative G3BP1 quantification of three independent experiments. VCL was used as a loading control. Data shown are representative of three independent experiments. Graphs depict mean with SD, and points represent biological replicates. (I) MG132 was incubated for 4 h with HEK293T G3BP2-mNeonGreen cells transduced with the scrambled shRNA or shDBR1. Fluorescence imaging was then performed for the indicated markers. Scale bar, 20 µm. Data shown are representative of three independent experiments. (J) FACS detection of G3BP2-mNeonGreen protein before and after treatment with MG132. Data representative of three independent experiments. Graphs depict mean with SD, and points represent biological replicates. Statistical analysis was performed with one-way ANOVA with Dunnett’s multiple comparisons test. NS, not significant, *, P < 0.05; ***, P < 0.001; ****, P < 0.0001. (K) MG132 or CQ was incubated with HEK293T G3BP2-mNeonGreen cells transduced with the scrambled shRNA or shDBR1, and HEK293T G3BP2-mNeonGreen cells. VCL (H and K) was used as a loading control. Data shown are representative of three independent experiments. (L) WB with the indicated antibodies following MG132 treatment and immunoprecipitation with an anti-FLAG (MCP) antibody on lysates of HEK293T cells in a stable overexpression system. Data shown are representative of three independent experiments. Source data are available for this figure: SourceData F6.
Figure 7.
Figure 7.
DBR1 is essential for G3BP protein stability and antiviral effect in vitro. (A) Alignment of the N-terminal sequences of the DBR1 proteins of the indicated species. (B) WB detection with the indicated antibodies in MEFs. GAPDH was used as a loading control. Data shown are representative of three independent experiments. (C) WB detection with the indicated antibodies in BMDMs. GAPDH was used as a loading control. Data shown are representative of three independent experiments. (D) Fluorescence detection of the indicated markers in MEF cells. Scale bars, 20 µm. Data shown are representative of three independent experiments. (E) WT and Dbr1Y17H/Y17H MEFs were infected with VSV (MOI: 0.1) or HSV-1 (MOI: 0.5) for 24 h, stimulated with polyI:C (2 µg/ml) for 5 h or incubated at 43°C for 40 min; fluorescence imaging was then performed for the indicated markers. Scale bars, 20 µm. Data shown are representative of three independent experiments. (F) Detection of fluorescent immunostaining for the indicated markers in WT and Dbr1Y17H/Y17H mouse brain sections. Scale bars, 50 µm. Data shown are representative of three independent experiments. (G) Fluorescence imaging of WT and Dbr1Y17H/Y17H MEFs infected with HSV-1-GFP (MOI: 0.5) for various time points. Scale bars, 10 0 µm. Data shown are representative of five independent experiments. (H and I) WT and Dbr1Y17H/Y17H MEFs were infected with VSV at a MOI of 0.1 (H) or HSV-1 at a MOI of 0.5 (I) for 36 h. RT-qPCR was then performed to detect the expression of the indicated viral genes. Statistical analysis was performed with one-way ANOVA with Dunnett’s multiple comparisons test. ****, P < 0.0001. Data representative of three independent experiments. Graphs depict mean with SD, and points represent biological replicates. (J and K) Similar to H and I, except that WB was performed with the indicated antibodies after infection with VSV (J) or HSV-1 (K). Tubulin (K) or GAPDH (J) was used as a loading control. Data shown are representative of three independent experiments. (L–N) WT, Dbr1Y17H/+, and Dbr1Y17H/Y17H MEFs were infected with VSV (MOI: 0.1) for 24 h, and RT-qPCR was then performed to detect expression of the indicated genes. Statistical analysis was performed with one-way ANOVA with Dunnett’s multiple comparisons test. NS, not significant, *, P < 0.05; **, P < 0.01; ***, P < 0.001; ****, P < 0.0001. Data representative of three independent experiments. Graphs depict mean with SD, and points represent biological replicates. Source data are available for this figure: SourceData F7.
Figure S5.
Figure S5.
DBR1 deficiency increases susceptibility to viral infection in vitro and in vivo. (A) Alignment of the sequences of segments of the DBR1 protein between the species indicated. (B) Body weights of WT (n = 10) and Dbr1Y17H/Y17H (n = 12) mice at 4–5 mo. Statistical analysis was performed with t tests. ****, P < 0.0001. Graphs depict the mean with SD and points represent biological replicates. (C) Comparison of body weight changes in WT (n = 6) and Dbr1Y17H/Y17H (n = 6) mice from birth. Graphs depict points that represent biological replicates. (D) Lariat analysis of WT and Dbr1Y17H/Y17H MEF following RNAseq. Data shown are representative of two independent experiments. (E and F) RT-qPCR assessment of WT (n = 8) and Dbr1Y17H/Y17H (n = 8) RNA lariats expression in different mouse tissues. Data representative of three independent experiments. Graphs depict mean with SD, and points represent biological replicates. (G) After the treatment of WT and Dbr1Y17H/Y17H MEFs with MG132 and CQ for 6 h, G3BP2 was detected by WB. GAPDH was used as a loading control. Data shown are representative of three independent experiments. (H and I) WT and Dbr1Y17H/Y17H MEFs were infected with viruses (VSV-GFP at an MOI of 0.1, or HSV-1-GFP at an MOI of 0.5) for 24 h; FACS analysis was then performed for the analysis of viral GFP levels (H) and RT-qPCR was used to detect expression of the indicated genes (I). Data representative of three independent experiments. Graphs depict mean with SD and points represent biological replicates. Statistical analysis was performed with one-way ANOVA with Dunnett’s multiple comparisons test. ****, P < 0.0001. (J) WB analysis after the stimulation of MEFs with polyI:C (2 µg/ml). Tubulin was used as a loading control. Data shown are representative of three independent experiments. (K) WT and Dbr1Y17H/Y17H mice were inoculated with HSV-1 (3.6 × 10⁵ PFU/g body weight) by injection into the tail vein, and RT-qPCR was performed to assess viral replication and ISG expression in the brainstem. Data representative of three independent experiments. Graphs depict the mean with SD and points represent biological replicates. Graph points represent mouse numbers. Statistical analysis was performed with t tests. ****, P < 0.0001. (L) RT-qPCR assessment of viral gene expression in various mouse tissues. Graph points represent mouse numbers. Data representative of three independent experiments. Graphs depict the mean with SD and points represent biological replicates. Statistical analysis was performed with t tests. *, P < 0.05; **, P < 0.01; ***, P < 0.001; ****, P < 0.0001. Source data are available for this figure: SourceData FS5.
Figure 8.
Figure 8.
DBR1 is crucial for PKR activation and antiviral responses in vivo. (A) Survival curve of WT (n = 8). and Dbr1Y17H/Y17H (n = 6) mice after intravenous inoculation with HSV-1 at a dose of 3.6 × 10⁵ PFU/g body weight. Data representative of three independent experiments. Statistical analysis for mouse survival was performed with Kaplan–Meier tests. ***, P < 0.001. (B–D) WT and Dbr1Y17H/Y17H mice were sacrificed 3.5 days after intravenous inoculation with HSV-1 (3.6 × 10⁵ PFU/g body weight). Brain tissues were collected, and RT-qPCR was performed to analyze the expression of viral genes (B) and the indicated ISR genes (C). Data representative of three independent experiments. Graphs depict the mean with SD and points represent biological replicates. Statistical analysis was performed with one-way ANOVA with Dunnett’s multiple comparisons test. **, P < 0.01; ***, P < 0.001; ****, P < 0.0001. WB with the indicated antibodies was used to assess protein levels (D). Data shown are representative of three independent experiments. (E) Survival curves of WT (n = 10) and Dbr1Y17H/Y17H (n = 12) mice after intravenous inoculation with VSV (106 PFU/g body weight). Data representative of three independent experiments. Statistical analysis for mouse survival was performed with Kaplan–Meier tests. ***, P < 0.001. (F and G) WT and Dbr1Y17H/Y17H mice were sacrificed 3.5 days after intravenous inoculation with VSV (106 PFU/g body weight). Brain tissues were collected, and RT-qPCR was performed to analyze the expression of viral genes (F) and the indicated ISR genes (G). Data representative of three independent experiments. Graphs depict the mean with SD and points represent biological replicates. Statistical analysis was performed with one-way ANOVA with Dunnett’s multiple comparisons test. *, P < 0.05; **, P < 0.01; ****, P < 0.0001. Source data are available for this figure: SourceData F8.

References

    1. Arenas, J., and Hurwitz J.. 1987. Purification of a RNA debranching activity from HeLa cells. J. Biol. Chem. 262:4274–4279. 10.1016/S0021-9258(18)61343-2 - DOI - PubMed
    1. Armakola, M., Higgins M.J., Figley M.D., Barmada S.J., Scarborough E.A., Diaz Z., Fang X., Shorter J., Krogan N.J., Finkbeiner S., et al. . 2012. Inhibition of RNA lariat debranching enzyme suppresses TDP-43 toxicity in ALS disease models. Nat. Genet. 44:1302–1309. 10.1038/ng.2434 - DOI - PMC - PubMed
    1. Balachandran, S., Roberts P.C., Brown L.E., Truong H., Pattnaik A.K., Archer D.R., and Barber G.N.. 2000. Essential role for the dsRNA-dependent protein kinase PKR in innate immunity to viral infection. Immunity. 13:129–141. 10.1016/S1074-7613(00)00014-5 - DOI - PubMed
    1. Bastard, P., Manry J., Chen J., Rosain J., Seeleuthner Y., AbuZaitun O., Lorenzo L., Khan T., Hasek M., Hernandez N., et al. . 2021. Herpes simplex encephalitis in a patient with a distinctive form of inherited IFNAR1 deficiency. J. Clin. Invest. 131:e139980. 10.1172/JCI139980 - DOI - PMC - PubMed
    1. Bertrand, E., Chartrand P., Schaefer M., Shenoy S.M., Singer R.H., and Long R.M.. 1998. Localization of ASH1 mRNA particles in living yeast. Mol. Cell. 2:437–445. 10.1016/S1097-2765(00)80143-4 - DOI - PubMed

MeSH terms

LinkOut - more resources