Observational Study
. 2024 Dec 5;8(1):138.
doi: 10.1186/s41747-024-00540-3.

Focal liver lesions: multiparametric microvasculature characterization via super-resolution ultrasound imaging

Affiliations
Observational Study

Focal liver lesions: multiparametric microvasculature characterization via super-resolution ultrasound imaging

Qian-Qian Zeng et al. Eur Radiol Exp. .

Abstract

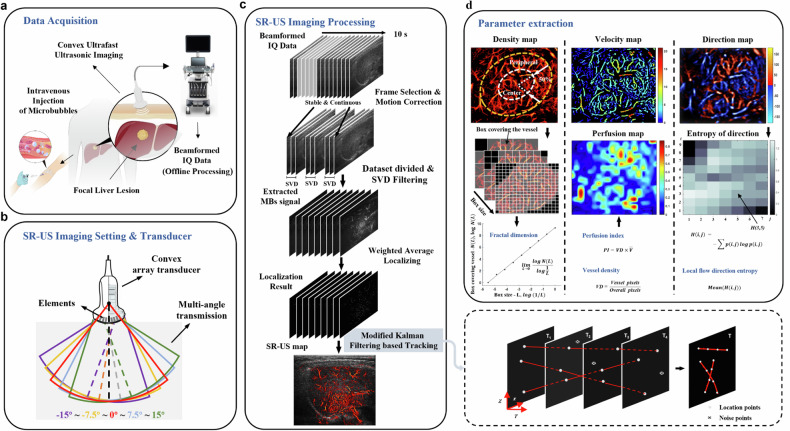
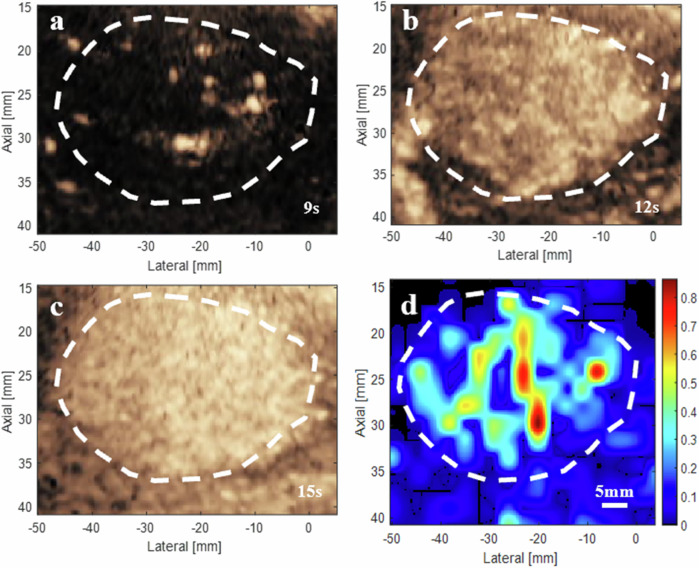
Background: Noninvasive and functional imaging of the focal liver lesion (FLL) vasculature at microscopic scales is clinically challenging. We investigated the feasibility of using super-resolution ultrasound (SR-US) imaging for visualizing and quantifying the microvasculature of intraparenchymal FLLs.

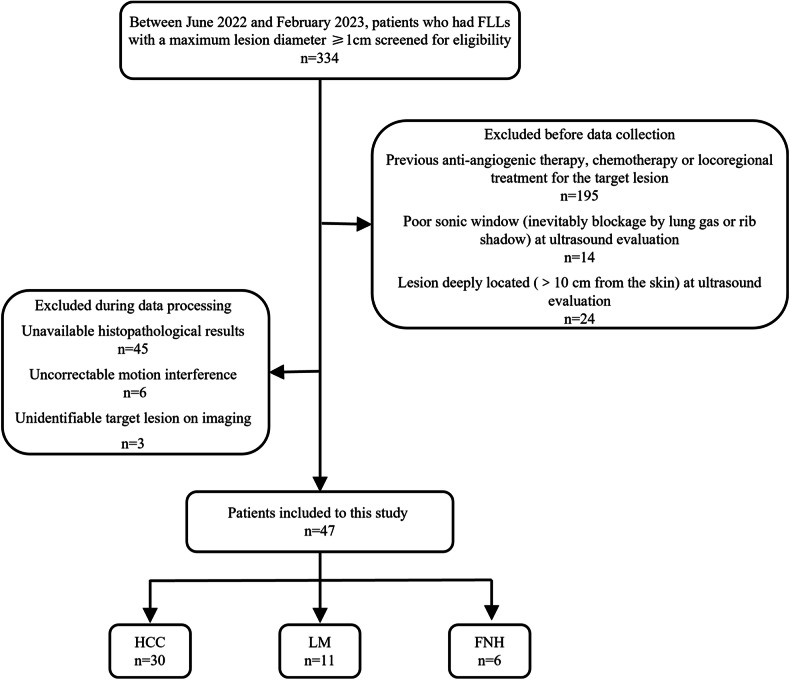
Methods: Patients with FLLs between June 2022 and February 2023 were prospectively screened. Following bolus injection of microbubbles at clinical concentration, SR-US was performed using a high frame rate (350-500 Hz) modified ultrasound scanner and a convex array transducer with a central frequency of 3.1 MHz.

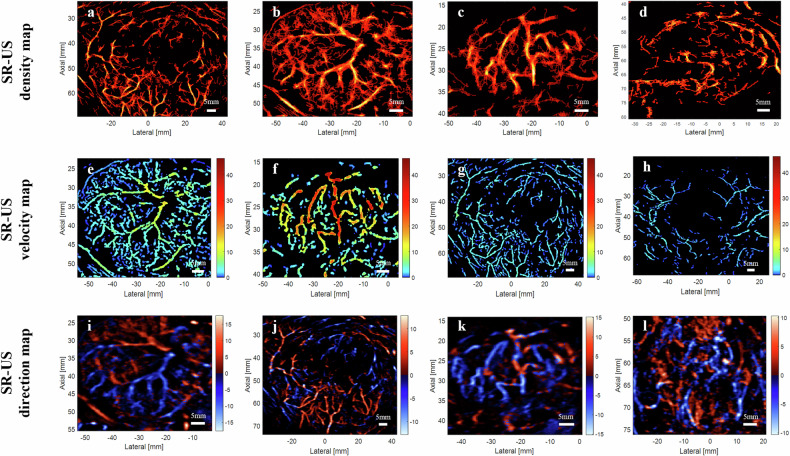
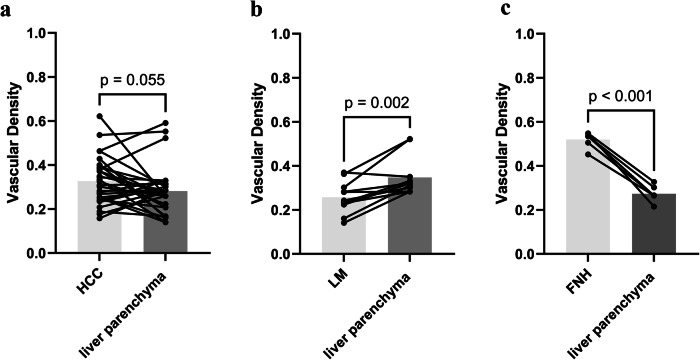
Results: In total, 47 pathologically proven FLLs at a depth of 5.7 ± 1.7 cm (mean ± standard deviation) were included: 30 hepatocellular carcinomas (HCC), 11 liver metastases (LM), and 6 focal nodular hyperplasias (FNH). The smallest detectable vessel size of the hepatic microvasculature was 128.4 ± 18.6 μm (mean ± standard deviation) at a depth of 8 cm. Significant differences were observed among the three types of lesions in terms of pattern categories, vessel density, minimum flow velocity, and perfusion index. We observed higher vessel density for FNH versus liver parenchyma (p < 0.001) as well as fractal dimension and local flow direction entropy value for FNH versus HCC (p = 0.002 and p < 0.001, respectively) and for FNH versus LM (p = 0.006 and p = 0.002, respectively).

Conclusion: Multiparametric SR-US showed that these three pathological types of FLLs have specific microvascular phenotypes. Vessel density, fractal dimension and local flow direction entropy served as valuable parameters in distinguishing between benign and malignant FLLs.

Trial registration: ClinicalTrials.gov (NCT06018142).

Relevance statement: Multiparametric SR-US imaging offers precise morphological and functional assessment of the microvasculature of intraparenchymal focal liver lesions, providing insights into tumor heterogeneity and angiogenesis.

Key points: Super-resolution (SR)-US imaging allowed morphological and functional evaluation of intraparenchymal hepatic lesion microvasculature. Hepatocellular carcinoma, liver metastasis, and focal nodular hyperplasia exhibit distinct microvascular architectures and hemodynamic profiles. Multiparametric microvasculature characterization via SR-US imaging facilitates the differentiation between benign and malignant microvascular phenotypes.

Keywords: Carcinoma (hepatocellular); Focal nodular hyperplasia; Liver neoplasms; Microbubbles; Ultrasonography.


Conflict of interest statement

Declarations. Ethics approval and consent to participate: Our study was registered on ClinicalTrials.gov (NCT06018142), and the study protocol was approved by the Institutional Review Board. Consent to participate was obtained from all patients in this study. Consent for publication: Not applicable. Competing interests: The authors of this manuscript declare no relationships with any companies whose products or services may be related to the subject matter of the article.

Figures

Fig. 1
Fig. 1
Procedure demonstration of offline super-resolution ultrasound data acquisition, processing and parameter extraction. a Data acquisition. b Settings and convex array transducer parameters. c Imaging processing. Beamformed in-phase/quadrature (IQ) data was selected based on the motion amplitude and corrected by matrix transformation. Then microbubbles signals were extracted through singular value decomposition filtering and located by weighted average. The modified Kalman filter method and interpolation were used to track and rebuild the microbubbles trajectory to generate density maps. Modified Kalman filter-based tracking is displayed in the bottom right. d Parameter extraction processing. Yellow dashed line indicates the lesion boundary corresponding to B-mode image. By shrinking the radius inward (the distance between multiple points on the boundary to the center) inward by 50% (white dashed line), each lesion could be divided into central and peripheral regions, the latter defined as the outer 50%; removing the peripheral area yielded the center regions
Fig. 2
Fig. 2
Examples of different super-resolution ultrasound (SR-US) parametric patterns. Density maps: a peripherally distributed pattern; b well-distributed pattern; c, d irregularly distributed pattern. The color bar corresponds to the normalized number of localized microbubbles. Velocity maps: e, f high-speed feeding pattern; g, h low-speed supplying pattern. The color bar corresponds to different speeds. Direction maps: i centrifugal pattern; j centripetal pattern; k eccentric pattern; l mixed pattern. The color bar represents the blood flow direction; red and blue indicate flow toward and away from the transducer, respectively. The white horizontal scale bar on all images represents 5 mm. a, g and j are images of a 51-year-old female patient with liver metastasis; b, e, i of a 35-year-old male patient with focal nodular hyperplasia; c, f, k of a 71-year-old female patient with hepatocellular carcinoma; d of a 65-year-old female patient with hepatocellular carcinoma; h of a 45-year-old male patient with liver metastasis; l of another 65-year-old female patient with hepatocellular carcinoma
Fig. 3
Fig. 3
Flowchart showing study inclusion and exclusion criteria. FLLs, Focal liver lesions; FNH, Focal nodular hyperplasia; HCC, Hepatocellular carcinoma; LM, Liver metastasis
Fig. 4
Fig. 4
Focal nodular hyperplasia in a 38-year-old female patient. a B-mode image. bd Contrast-enhanced ultrasound image. e Super-resolution ultrasound (SR-US) microvascular density image overlaid on the ultrasound B-mode image. f The lesion was zoomed-in region as indicated by the white rectangle in e. g Magnified region indicated by the white rectangle in f. h Contrast-enhanced power doppler (CE-PD) image of the same region in g. i Vessel cross-section intensity profile of SR-US and CE-PD image. Intensity profile of the vessel cross-section, delineated by the white dashed line in the SR-US image (g) and the CE-PD image (h), is represented by the red and black dashed curves, respectively
Fig. 5
Fig. 5
Contrast-enhanced ultrasound (CEUS) image and super-resolution ultrasound (SR-US) perfusion map of a 71-year-old female patient with hepatocellular carcinoma. ac CEUS image. d The corresponding SR-US perfusion map. The white dashed line indicates the lesion boundary
Fig. 6
Fig. 6
Pairwise comparative analysis of vascular density in focal liver lesions and the surrounding liver parenchyma. a Difference between hepatocellular carcinoma (HCC) group and liver parenchyma. b Difference between liver metastasis (LM) group and liver parenchyma. c Difference between focal nodular hyperplasia (FNH) group and liver parenchyma

References

    1. Bergers G, Benjamin LE (2003) Tumorigenesis and the angiogenic switch. Nat Rev Cancer 3:401–410. 10.1038/nrc1093 - PubMed
    1. Zhu AX, Duda DG, Sahani DV, Jain RK (2011) HCC and angiogenesis: possible targets and future directions. Nat Rev Clin Oncol 8:292–301. 10.1038/nrclinonc.2011.30 - PMC - PubMed
    1. Schirner M, Menrad A, Stephens A, Frenzel T, Hauff P, Licha K (2004) Molecular imaging of tumor angiogenesis. Ann N Y Acad Sci 1014:67–75. 10.1196/annals.1294.007 - PubMed
    1. Rosen MA, Schnall MD (2007) Dynamic contrast-enhanced magnetic resonance imaging for assessing tumor vascularity and vascular effects of targeted therapies in renal cell carcinoma. Clin Cancer Res 13:770s–776s. 10.1158/1078-0432.Ccr-06-1921 - PubMed
    1. Pysz MA, Foygel K, Panje CM, Needles A, Tian L, Willmann JK (2011) Assessment and monitoring tumor vascularity with contrast-enhanced ultrasound maximum intensity persistence imaging. Invest Radiol 46:187–195. 10.1097/RLI.0b013e3181f9202d - PMC - PubMed

Publication types

Associated data