

Fully automatic quantification of pulmonary fat attenuation volume by CT: an exploratory pilot study
- PMID: 39636527
- PMCID: PMC11621257
- DOI: 10.1186/s41747-024-00536-z
Fully automatic quantification of pulmonary fat attenuation volume by CT: an exploratory pilot study
Abstract
Background: Non-malignant chronic diseases remain a major public health concern. Given the alterations in lipid metabolism and deposition in the lung and its association with fibrotic interstitial lung disease (fILD) and chronic obstructive pulmonary disease (COPD), this study aimed to detect those alterations using computed tomography (CT)-based analysis of pulmonary fat attenuation volume (CTpfav).
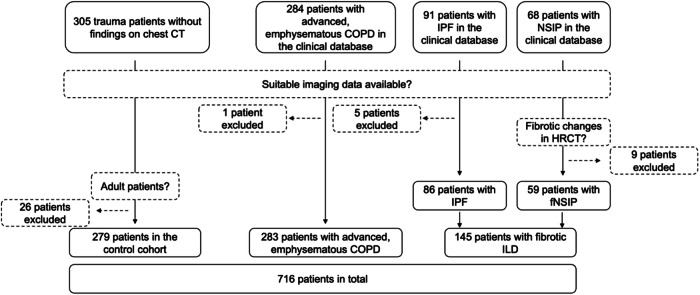
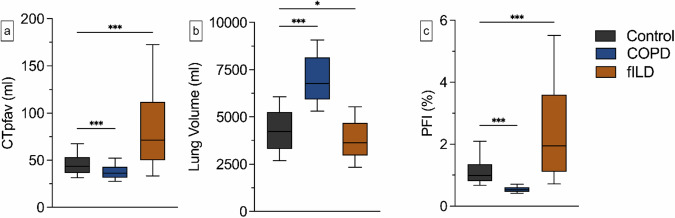
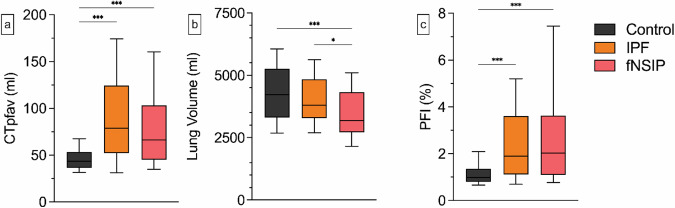
Methods: This observational retrospective single-center study involved 716 chest CT scans from three subcohorts: control (n = 279), COPD (n = 283), and fILD (n = 154). Fully automated quantification of CTpfav based on lung segmentation and HU-thresholding. The pulmonary fat index (PFI) was derived by normalizing CTpfav to the CT lung volume. Statistical analyses were conducted using Kruskal-Wallis with Dunn's post hoc tests.
Results: Patients with fILDs demonstrated a significant increase in CTpfav (median 71.0 mL, interquartile range [IQR] 59.7 mL, p < 0.001) and PFI (median 1.9%, IQR 2.4%, p < 0.001) when compared to the control group (CTpfav median 43.6 mL, IQR 16.94 mL; PFI median 0.9%, IQR 0.5%). In contrast, individuals with COPD exhibited significantly reduced CTpfav (median 36.2 mL, IQR 11.4 mL, p < 0.001) and PFI (median 0.5%, IQR 0.2%, p < 0.001).
Conclusion: The study underscores the potential of CTpfav and PFI as imaging biomarkers for detecting changes in lung lipid metabolism and deposition and demonstrates a possibility of tracking these alterations in patients with COPD and ILDs. Further research is needed to validate these findings and explore the clinical relevance of CTpfav and PFI in lung disease management.
Relevance statement: This study introduces a fully automated method for quantifying CTpfav, potentially establishing it as a new imaging biomarker for chronic lung diseases.
Key points: This retrospective observational study employed an open-source, automated algorithm for the quantification of CT pulmonary fat attenuation volume (CTpfav). Patients with fibrotic interstitial lung disease (fILD) showed a significantly higher CTpfav and pulmonary fat index (PFI), i.e., CTpfav/CT lung volume, compared to a control group. Patients with chronic obstructive pulmonary disease (COPD) showed significantly lower CTpfav and PFI compared to the control group. CTpfav and PFI may each serve as imaging biomarkers for various lung diseases and warrant further investigation.
Keywords: Body composition; Lung diseases (interstitial); Lung volume measurements; Pulmonary disease (chronic obstructive); Tomography (x-ray computed).
© 2024. The Author(s).
Conflict of interest statement
Declarations. Ethics approval and consent to participate: This study was approved by the local Institutional Review Board (approval number: 23-11410-BO on 16/08/2023). The Institutional Review Board waived the requirement of written information due to the observational retrospective study design. Data underwent full anonymization before inclusion. Consent for publication: Not applicable. Competing interests: The authors declare that they have no competing interests.
Figures
References
-
- Chen R, Dai J (2023) Lipid metabolism in idiopathic pulmonary fibrosis: from pathogenesis to therapy. J Mol Med 101:905–915. 10.1007/s00109-023-02336-1 - PubMed
-
- Hutchinson J, Fogarty A, Hubbard R, McKeever T (2015) Global incidence and mortality of idiopathic pulmonary fibrosis: a systematic review. Eur Respir J 46:795–806. 10.1183/09031936.00185114 - PubMed
Publication types
MeSH terms
Grants and funding
LinkOut - more resources
Full Text Sources
Medical