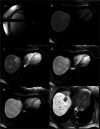
MRI analysis of relative tumor enhancement in liver metastases and correlation with immunohistochemical features
- PMID: 39636546
- PMCID: PMC11621246
- DOI: 10.1186/s13244-024-01866-7
MRI analysis of relative tumor enhancement in liver metastases and correlation with immunohistochemical features
Abstract
Objective: Investigate the association between the relative tumor enhancement (RTE) of gadoxetic acid across various MRI phases and immunohistochemical (IHC) features in patients with liver metastases (LM) from colorectal cancer (CRC), breast cancer (BC), and pancreatic cancer (PC).
Methods: A retrospective analysis was conducted on 68 patients with LM who underwent 1.5-T MRI scans. Non-contrast and contrast-enhanced T1-weighted (T1-w) gradient echo (GRE) sequences were acquired before LM biopsy. RTE values among LM groups were compared by cancer type using analysis of variance. The relationships between RTE and IHC features tumor stroma ratio, cell count, Ki67 proliferation index, and CD45 expression were evaluated using Spearman's rank correlation coefficients.
Results: Significant differences in RTE were observed across different MRI phases among patients with BCLM, CRCLM, and PCLM: arterial phase (0.75 ± 0.42, 0.37 ± 0.36, and 0.44 ± 0.19), portal venous phase (1.09 ± 0.41, 0.59 ± 0.44, and 0.53 ± 0.24), and venous phase (1.11 ± 0.45, 0.65 ± 0.61, and 0.50 ± 0.20). In CRCLM, RTE inversely correlated with mean Ki67 (r = -0.50, p = 0.01) in the hepatobiliary phase. Negative correlations between RTE and CD45 expression were found in PCLM and CRCLM in the portal venous phase (r = -0.69, p = 0.01 and r = -0.41, p = 0.04) and the venous phase (r = -0.65, p = 0.01 and r = -0.44, p = 0.02).
Conclusion: Significant variations in RTE were identified among different types of LM, with correlations between RTE values and IHC markers such as CD45 and Ki67 suggesting that RTE may serve as a non-invasive biomarker for predicting IHC features in LM.
Critical relevance statement: RTE values serve as a predictive biomarker for IHC features in liver metastasis, potentially enhancing non-invasive patient assessment, disease monitoring, and treatment planning.
Key points: Few studies link gadoxetic acid-enhanced MRI with immunohistochemistry in LM. RTE varies by liver metastasis type and correlates with CD45 and Ki67. RTE reflects IHC features in LM, aiding non-invasive assessment.
Keywords: Breast cancer; Colorectal cancer; Immunohistochemistry; Magnetic resonance imaging; Pancreas cancer.
© 2024. The Author(s).
Conflict of interest statement
Ethics approval and consent to participate: This study received approval from the Institutional Review Board of Otto-von-Guericke University Magdeburg (Ethics Committee, approval number 43/20). Consent for publication: Not applicable. Competing interests: The authors declare no competing interests.
Figures


References
-
- Baghdadi A, Mirpour S, Ghadimi M et al (2022) Imaging of colorectal liver metastasis. J Gastrointest Surg 26:245–257. 10.1007/s11605-021-05164-1 - PubMed
-
- Morisaka H, Seno D, Sakurai Y et al (2021) Quantitative analysis of gadoxetic acid-enhanced MRI for the differential diagnosis of focal liver lesions: comparison between estimated intralesional gadoxetic acid retention by T1 mapping and conventional processing methods. Eur J Radiol 138:109620. 10.1016/j.ejrad.2021.109620 - PubMed
LinkOut - more resources
Full Text Sources
Research Materials
Miscellaneous

