

Integrated transcriptomic and metabolomic analyses uncover the key pathways of Limonium bicolor in response to salt stress
- PMID: 39636615
- PMCID: PMC11869187
- DOI: 10.1111/pbi.14534
Integrated transcriptomic and metabolomic analyses uncover the key pathways of Limonium bicolor in response to salt stress
Abstract
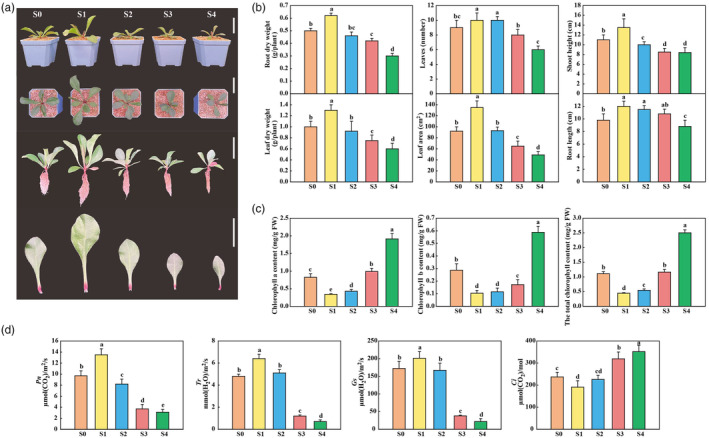
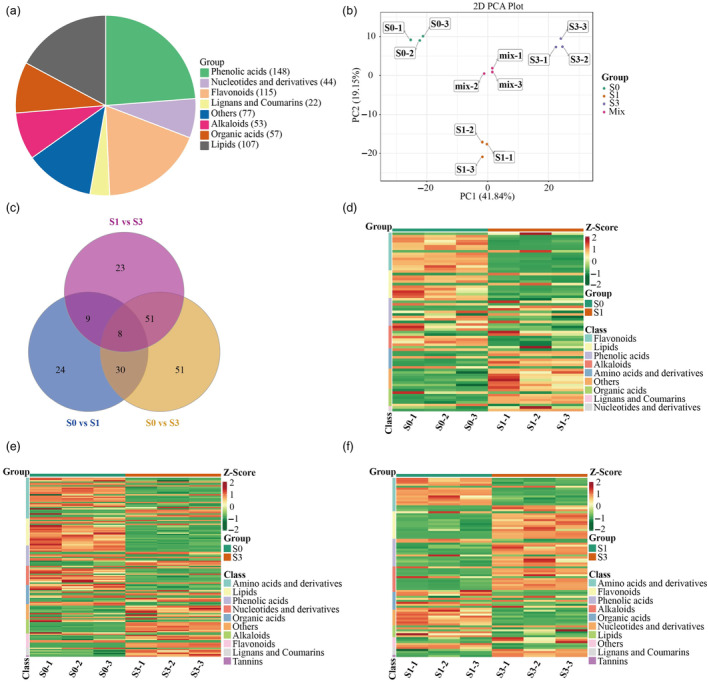
Salinity significantly inhibits plant growth and development. While the recretohalophyte Limonium bicolor can reduce its ion content by secreting salt, the metabolic pathways it employs to adapt to high salt stress remain unclear. This study aims to unravel this enigma through integrated transcriptomic and metabolomic analyses of L. bicolor under salt stress conditions. The results showed that compared to the control (S0), low salt treatment (S1) led to a significant increase in plant growth, photosynthesis efficiency and antioxidant enzyme activity but caused no significant changes in organic soluble substance and ROS contents. However, high salt treatments (S3 and S4) led to a significant decrease in plant growth, photosynthesis efficiency and antioxidant enzyme activity, accompanied by a significant increase in organic soluble substance and ROS contents. A significant increase in phenolic compounds, such as caffeoyl shikimic acid and coniferin, upon the treatments of S1, S3 and S4, and a decrease and increase in flavonoids upon the treatments of S1 and S3 were also observed, respectively. This study also demonstrated that the expression patterns of key genes responsible for the biosynthesis of these metabolites are consistent with the observed trends in their accumulation levels. These results suggest that under low salt stress conditions, the halophyte L. bicolor experiences minimal osmotic and oxidative stress. However, under high salt stress conditions, it suffers severe osmotic and oxidative stress, and the increase in organic soluble substances and flavonoids serves as a key response to these stresses and also represents a good strategy for the alleviation of them.
Keywords: Limonium bicolor; flavonoid; phenolic compound; plant growth; salt stress.
© 2024 The Author(s). Plant Biotechnology Journal published by Society for Experimental Biology and The Association of Applied Biologists and John Wiley & Sons Ltd.
Conflict of interest statement
The authors declare no conflict of interest.
Figures


Similar articles
-
Melatonin increases growth and salt tolerance of Limonium bicolor by improving photosynthetic and antioxidant capacity.BMC Plant Biol. 2022 Jan 4;22(1):16. doi: 10.1186/s12870-021-03402-x. BMC Plant Biol. 2022. PMID: 34983373 Free PMC article.
-
Exogenous melatonin enhances salt secretion from salt glands by upregulating the expression of ion transporter and vesicle transport genes in Limonium bicolor.BMC Plant Biol. 2020 Oct 27;20(1):493. doi: 10.1186/s12870-020-02703-x. BMC Plant Biol. 2020. PMID: 33109099 Free PMC article.
-
The WRKY gene family in the halophyte Limonium bicolor: identification, expression analysis, and regulation of salt stress tolerance.Plant Cell Rep. 2024 Jun 12;43(7):167. doi: 10.1007/s00299-024-03258-z. Plant Cell Rep. 2024. PMID: 38865016
-
Exogenous 6-BA enhances salt tolerance of Limonium bicolor by increasing the number of salt glands.Plant Cell Rep. 2023 Dec 23;43(1):12. doi: 10.1007/s00299-023-03104-8. Plant Cell Rep. 2023. PMID: 38135797
-
The transcriptome of NaCl-treated Limonium bicolor leaves reveals the genes controlling salt secretion of salt gland.Plant Mol Biol. 2016 Jun;91(3):241-56. doi: 10.1007/s11103-016-0460-0. Epub 2016 Mar 3. Plant Mol Biol. 2016. PMID: 26936070
Cited by
-
Phenotypic, Physiological, and Transcriptomic Analyses Reveal Different Responses to Salt Stress in Cultivated Red Lettuce and Wild Lettuce Seedlings.Int J Mol Sci. 2025 Apr 6;26(7):3425. doi: 10.3390/ijms26073425. Int J Mol Sci. 2025. PMID: 40244249 Free PMC article.
-
Salt gradient-driven adaptation in okra: uncovering mechanisms of tolerance and growth regulation.Front Plant Sci. 2025 Jul 23;16:1648092. doi: 10.3389/fpls.2025.1648092. eCollection 2025. Front Plant Sci. 2025. PMID: 40772056 Free PMC article.
-
Integration of mRNA and miRNA Analysis Reveals the Regulation of Salt Stress Response in Rapeseed (Brassica napus L.).Plants (Basel). 2025 Aug 4;14(15):2418. doi: 10.3390/plants14152418. Plants (Basel). 2025. PMID: 40805768 Free PMC article.
-
Effects of Combined Salt and Heat Stress on Agronomic Traits, Photosynthetic Parameters, and Physiological Biochemistry in Six Alfalfa (Medicago sativa L.) Cultivars.Plants (Basel). 2025 Aug 10;14(16):2479. doi: 10.3390/plants14162479. Plants (Basel). 2025. PMID: 40872102 Free PMC article.
-
Preliminary Analysis of the Salt-Tolerance Mechanisms of Different Varieties of Dandelion (Taraxacum mongolicum Hand.-Mazz.) Under Salt Stress.Curr Issues Mol Biol. 2025 Jun 11;47(6):449. doi: 10.3390/cimb47060449. Curr Issues Mol Biol. 2025. PMID: 40699848 Free PMC article.
References
-
- Abulfaraj, A.A. (2020) Stepwise signal transduction cascades under salt stress in leaves of wild barley (Hordeum spontaneum). Biotechnol Biotec Eq. 34, 860–872.
-
- Ahmad, P. , Venema, K. and Corpas, F.J. (2022) Unravelling salt tolerance mechanisms in plants: From lab to field. Plant Physiol. Biochem. 176, 31–33. - PubMed
-
- Ali, M. , Afzal, S. , Parveen, A. , Kamran, M. , Javed, M.R. , Abbasi, G.H. , Malik, Z. et al. (2020) Silicon mediated improvement in the growth and ion homeostasis by decreasing Na+ uptake in maize (Zea mays L.) cultivars exposed to salinity stress. Plant Physiol. Biochem. 158, 208–218. - PubMed
MeSH terms
Substances
LinkOut - more resources
Full Text Sources
Miscellaneous
