. 2024 Dec 5:13:RP97504.
doi: 10.7554/eLife.97504.

Dynamic tracking of native precursors in adult mice

Affiliations

Dynamic tracking of native precursors in adult mice

Suying Liu et al. Elife. .

Abstract

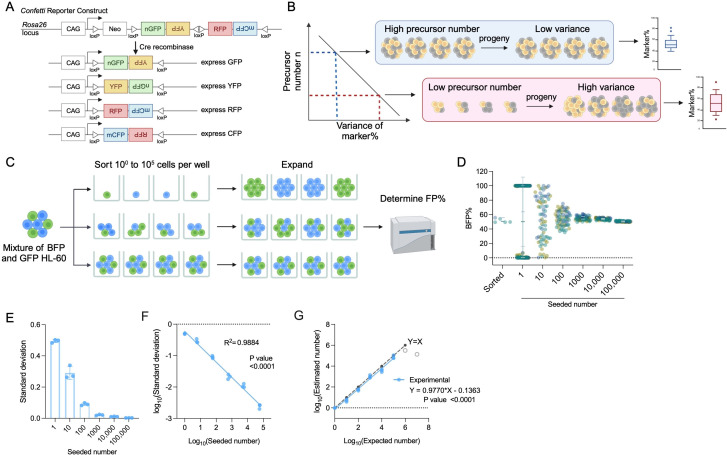
Hematopoietic dysfunction has been associated with a reduction in the number of active precursors. However, precursor quantification at homeostasis and under diseased conditions is constrained by the scarcity of available methods. To address this issue, we optimized a method for quantifying a wide range of hematopoietic precursors. Assuming the random induction of a stable label in precursors following a binomial distribution, estimates depend on the inverse correlation between precursor numbers and the variance of precursor labeling among independent samples. Experimentally validated to cover the full dynamic range of hematopoietic precursors in mice (1-105), we utilized this approach to demonstrate that thousands of precursors, which emerge after modest expansion during fetal-to-adult transition, contribute to native and perturbed hematopoiesis. We further estimated the number of precursors in a mouse model of Fanconi Anemia, showcasing how repopulation deficits can be classified as autologous (cell proliferation) and non-autologous (lack of precursor). Our results support an accessible and reliable approach for precursor quantification, emphasizing the contemporary perspective that native hematopoiesis is highly polyclonal.

Keywords: Fanconi Anemia; clonal diversity; hematopoiesis; mouse; regenerative medicine; stem cells.


Conflict of interest statement

SL, SA, HZ, JE, SJ, GJ, TM, LP, HL, PK No competing interests declared

Figures

Figure 1.
Figure 1.. The principle of inverse correlation between variance of FP% and precursor numbers.
(A) Schematic of the Confetti cassette at the mouse Rosa26 locus. Sequences of four fluorescence protein are interspaced by loxP sites. Upon Cre-expression, the Confetti cassette will recombine and express one of the four fluorescence proteins. (B) The inverse relationship between variance of markers and precursor numbers. The distribution of FP% is determined in the progeny to estimate the number of precursors. (C) Workflow to validate the correlation formula between variance of FP% and precursor numbers by a two-color cell system. (D) Blue fluorescent protein (BFP) frequencies in wells seeded with 1–100,000 HL-60. Each dot represents a well. Two replicates were shown. Each replicate consists of at least 20 wells per seeded number. Error bars represent mean ± SD. (E) The standard deviation of BFP% in wells seeded with various numbers of HL-60. Error bars represent mean ± SD. N = 3 replicates. (F) The correlation between seeded numbers and standard deviation of BFP%. N = 3 replicates. (G) The correlation between seeded numbers and the numbers estimated with standard deviation of BFP% and equation 2. N = 3 replicates except for seeded numbers 106 and 107 (gray circles). For 106 and 107, N = 1 replicates. For (A–C), images were created with BioRender.com/f96e500.
Figure 1—figure supplement 1.
Figure 1—figure supplement 1.. Establishing the correlation between variance of fluorescence protein (FP) and precursor numbers.
(A) The correlation between precursor numbers and coefficient of variances (CVs) of individual FP or all CVs (original correlation formula), replotted from Ganuza et al., 2017, Figure 1f. (B) FPmean% in a previously published dataset, replotted from Ganuza et al., 2017, Figure 1f. (C) The correlation between precursor numbers and standard deviation (σ) of individual FP, replotted from Ganuza et al., 2017. (D) The BFP% in HL-60 mix during 2 weeks of growth. (E) The effect of outliers on precursor number estimation. Left, BFP% in samples with/without outliers. Quartiles by Tukey method was shown. The outlier is highlighted by circle. Middle, standard deviation of BFP% with/without outliers. Right, estimated precursor numbers with/without outliers. (F) The changes of standard deviation when recorded events varied. ‘&’ denotes the potential overestimated standard deviation due to low flow recorded events. (G) The variance of estimated precursor numbers when varying sample sizes were used. (H) The relative error of estimation as sample sizes increased. Each dot represents data from one seeded number. Error bars represent mean ± SD.
Figure 2.
Figure 2.. Transplantation of defined number of precursors.
(A) Representative flow plots showing Confetti induction by HSC-SCL-CreERT in the LSK population. (B) Schematic for transplantation of defined number of precursors. Briefly, 4 × 10⁶ Confetti-induced WBM for ‘high-precursor number’ groups, or 0.25 × 10⁶ WBM for ‘low-precursor number’ groups were transplanted into lethally irradiated recipient mice. Image was created with BioRender.com/f96e500. (C) RFPConf% distribution in peripheral blood (PB) myeloid cells. Each dot represents one animal. Recipient sample size = 7–14 mice per replicate, N = 3 replicates per group. Error bars represent mean ± SD. (D) The precursor numbers of B cells, T cells, and myeloid cells in recipient mice. Dash lines mark the level of historically estimated transplantable clone numbers. Each dot represents a precursor number calculated from multiple mice. Error bars represent mean ± SD. (E) The correlation of precursor numbers calculated from RFPConf%, YFPConf%, or CFPConf%. Each dot represents a precursor number calculated from multiple mice. (F) The precursor number of bone marrow (BM) MP and hematopoietic stem and progenitor cell (HSPC) in recipient mice. Dash lines represent historically estimated transplantable clone numbers. Each dot represents a precursor number calculated from multiple mice. Error bars represent mean ± SD. (G) The donor chimerism of recipient mice, and the CD45.2+ chimerism differences between high- and low-precursor number groups. Each solid dot represents one animal. Each outlined dot represents the average value of a replicate containing multiple animals. Recipient sample size = 7–14 mice per replicate, N = 3 replicates for each precursor number group. Two-way ANOVA for paired samples was performed. (H) The frequency of myeloid cells in the PB of recipients. Each dot represents one animal. Recipient sample size = 7–14 mice per replicate, N = 3 replicates for each precursor number group. Two-way ANOVA for paired samples was performed. ns, non-significant, *p < 0.05, **p < 0.001.
Figure 2—figure supplement 1.
Figure 2—figure supplement 1.. The induction specificity of HSC-SCL-CreERT.
(A) Experiment schematic to examine the induction specificity of HSC-SCL-CreERT. N = 10 for induced animals, N = 3 for non-induced animals. Image was created with BioRender.com/f96e500. (B) Flow gating strategy for bone marrow (BM) hematopoietic stem and progenitor cell (HSPC) and MPs. (C) Confetti labeling in BM HSPCs. Error bars represent mean ± SD. (D) Flow gating strategy for BM lineage cells. (E) Confetti labeling in BM lineage cells. Error bars represent mean ± SD. (F) Flow gating strategy to examine spleen cells. (G) Confetti labeling in spleen cells. Error bars represent mean ± SD. See Methods and Supplementary file 1 for the detailed antibody, fluorophore and marker combination used for each cell type.
Figure 2—figure supplement 2.
Figure 2—figure supplement 2.. Analysis of HSC-SCL-CreERT background Cre activity.
(A) Representative flow plot showing Confetti expression in peripheral blood (PB) T cells in 48- to 50-week-old HSC-SCL-CreERT/Confetti animals compared to an animal induced with 1-day tamoxifen treatment. (B) Quantification of RFP and YFP% in PB T cells. N = 8 for non-induced 48- to 50-week-old animals. (C) Representative flow plot for Confetti labeling in PB T cells post HSC-SCL-CreERT-mediated induction. (D) The level of CFP+ and RFP+ double positive cells in PB T cells of animals induced by HSC-SCL-CreERT compared to Vav-Cre/Confetti animals analyzed at the same age. N = 3 for Vav-Cre animals, N = 8 for HSC-SCL-CreERT animals.
Figure 2—figure supplement 3.
Figure 2—figure supplement 3.. Variance of FP% inversely correlates with precursor numbers in vivo.
(A) The correlation between expected numbers and the estimated numbers calculated from FP% of precursors following Poisson distribution. See Methods for simulation details. (B) Flow gating strategy for peripheral blood (PB) B cell, T cell, and myeloid cell. See Methods and Supplementary file 1 for the detailed antibody, fluorophore, and marker combination used for each cell type. (C) RFPConf% distribution in B cell and T cell. (D) YFPConf% distribution in myeloid cell. (E) CFPConf% distribution in myeloid cell. (F) RFPPB%, CFPPB%, YFPPB%, and Confetti% distribution in myeloid cells. (G) Linear correlation of PB precursor numbers calculated from RFPConf%, RFPPB%, CFPPB%, YFPPB%, Confetti%, or RFPRFP+YFP%. Each dot represents a precursor number calculated from multiple mice. For (C–F), each dot represents one animal. Recipient sample size = 7–14 mice per replicate, N = 3 replicates per group. Error bars represent mean ± SD.
Figure 2—figure supplement 4.
Figure 2—figure supplement 4.. Bone marrow (BM) analysis for high- and low-precursor number groups.
(A) RFPConf% distribution in BM hematopoietic stem and progenitor cells (HSPCs). Each dot represents one animal. (B) BM donor chimerism. (C) BM nucleated cell numbers. N = 15 mice for high-precursor number group, n = 14 for low-precursor number group. Unpaired t test was performed. (D) BM HSPC and MP frequency in donor CD45.2+ population. Two-way ANOVA for paired samples was performed. For (B) and (D), each solid dot represents one animal; each outlined dot represents the average value of a replicate containing multiple animals. Except for (C), recipient sample size = 7–14 mice per replicate, N = 3 replicates per group. For all graphs, Error bars represent mean ± SD. ns, non-significant, *p < 0.05.
Figure 3.
Figure 3.. Quantification of active hematopoietic precursor at steady state.
(A) Experiment schematic for Confetti induction in adult-induced animals. Image was created with BioRender.com/f96e500. (B) Confetti labeling in B cells, myeloid cells, and bone marrow (BM) hematopoietic stem and progenitor cells (HSPCs). Statistics for comparisons between labeling of month 7 and other months were shown. One-way ANOVA for paired samples was performed. (C) RFPConf% in peripheral blood (PB) myeloid cells and BM HSPCs. Statistics for comparisons between labeling of month 7 and other months were shown. One-way ANOVA for paired samples was performed. (D) The number of myeloid precursors and the average precursor number from month 5 to 7. (E) The number of BM precursors. Paired permutation was performed. (F) The frequency-to-clone ratio of BM HSPCs. Paired permutation test was performed. Each solid dot represents one animal. Each outlined dot represents the average value of a replicate containing multiple animals. Error bars represent mean ± SD. PB sample size = 14–22 mice per replicate; BM sample size = 8–10 mice per replicate; N = 4 replicates. ns, non-significant, *p < 0.05, **p < 0.001.
Figure 3—figure supplement 1.
Figure 3—figure supplement 1.. Analysis of fluorescence protein (FP) induction in adult-induced animals.
(A) Confetti labeling in LSK after 14 days of tamoxifen treatment. N = 5 animals. Error bars represent mean ± SD. (B) CFPConf% in peripheral blood (PB) myeloid cells. (C) CFPPB% in PB myeloid cells. (D) RFPRFP+YFP% in PB myeloid cells. (E) RFPPB% and YFPPB% in PB myeloid cells. (F) CFPConf% in PB myeloid cells of fetal-induced animals (G) Bone marrow (BM) hematopoietic stem and progenitor cell (HSPC) frequencies. Error bars represent mean ± SD. For (B–E), sample size = 14–22 mice per replicate; for (F), sample size = 4–11 mice per replicate; for (G) sample size = 8–10 mice per replicate. For (B–E) and (G), N = 4 replicates. For (F), N = 5 replicates.
Figure 4.
Figure 4.. Number of precursors post-5-FU treatment and along developmental ontogeny.
(A) Experiment schematic for one-dose 5-FU treatment. Image was created with BioRender.com/f96e500 . (B) The number of bone marrow (BM) precursors post-5FU treatment. Permutation test was performed. For UT, sample size = 8–10 mice per replicate; N = 4 replicates; for 5-FU, sample size = 6–8 mice per replicate; N = 5 replicates. (C) Experiment schematic for Confetti induction at fetal stages. Image was created with BioRender.com/f96e500. (D) The Confetti labeling of B cells, T cells, and myeloid cells. Each dot represents one animal. Each outlined dot represents the average value of a replicate containing multiple animals. Sample size = 4–11 mice per replicate; N = 5 replicates. (E) The number of precursors in peripheral blood (PB) myeloid cells, B cells, and T cells. Permutation test was performed. For E14.5 and adult-induction, N = 4 replicates; for E11.5, n = 3 replicates. (F) The number of BM precursors. Each dot represents one precursor number. Permutation test was performed. For E14.5 and adult-induction, N = 4 replicates; for E11.5, N = 3 replicates. (G) The relative fold change increase of precursor numbers from fetal to adult stage, as well as fold change of CRU and cell counts. Error bars represent mean ± SD. ns, non-significant, *p < 0.05, **p <0.001.
Figure 4—figure supplement 1.
Figure 4—figure supplement 1.. Analysis related to 5-FU treatment and Confetti fetal induction.
(A) Peripheral blood (PB) myeloid cells frequencies before 5-FU treatment and 10 days post-5-FU treatment. Dashed lines connect the values for the same replicate. Sample size = 6–8 mice per replicate, N = 5 replicates for 5-FU. Paired t test was performed. (B) The bone marrow (BM) hematopoietic stem and progenitor cell (HSPC) frequencies of UT and 5-FU-treated groups 10 days post-5-FU treatment. For UT, sample size = 8–10 mice per replicate, N = 4 replicates; for 5-FU, sample size = 6–8 mice per replicate, N = 5 replicates. (C) Confetti% in PB in E11.5-labeled animals. Dashed lines connect values for the same replicate. (D) The distribution of fluorescence proteins (FPs) in Confetti+ population of B cells. Data showing average from all mice. N = 24–34 for E14.5, N = 7–24 for E11.5. Error bars represent mean ± SD. For (A–C), each solid dot represents one animal; each outlined dot represents the average value of a replicate containing multiple animals. ns, non-significant; *p < 0.05, **p < 0.001.
Figure 5.
Figure 5.. Precursor numbers in a mouse model of Fanconi Anemia (FA).
(A) Experimental workflow to generate Fancc+/+ and Fancc−/− mice, induce Confetti expression and track precursor number dynamics. Image was created with BioRender.com/f96e500. (B) Confetti labeling in peripheral blood (PB) B cells and myeloid cells. Each dot represents one animal. Each outlined dot represents the average value of a replicate containing multiple animals. Dashed lines connect the values for the same replicate. (C) The number of PB myeloid precursors. (D) The number of bone marrow (BM) precursors. Permutation test was performed. (E) Experiment schematic for competitive transplantation. Image was created with BioRender.com/f96e500. (F) PB donor chimerism in recipient mice of young FA donors. Each dot represents one animal. Dashed lines connect the average donor chimerism of three replicates. For Fancc+/+ or Fancc+/−, n = 10 per replicate, N = 3 replicates; for Fancc−/−, N = 7–9 per replicate, N = 3 replicates. Two-way ANOVA was performed. (G) The number of PB myeloid precursors post-transplantation of young FA donors. Dashed lines connect the average precursor numbers. Permutation test was performed. N = 3 for each group. (H) PB donor chimerism recipient mice of aging FA donor cells. Each dot represents one animal. Dashed lines connect the average donor chimerism of three replicates. For both genotype, N = 10 per replicate, N = 3 replicates. Two-way ANOVA was performed. (I) The number of PB B cell precursors post-transplantation of aging FA donors. Dashed lines connect the average precursor numbers. Permutation test was performed. N = 3 for each genotype. For (A–C), Fancc+/+, sample size = 11–17 mice per replicate, N = 5 replicates; Fancc+/−, sample size = 10–22 mice per replicate, N = 7 replicates; Fancc−/−, sample size = 9–17 mice per replicate, N = 4 replicates. For (D), Fancc+/+, sample size = 5–9 mice per replicate, N = 5 replicates; Fancc+/−, sample size = 6–12 mice per replicate, N = 5 replicates; Fancc−/−, sample size = 6–11 mice per replicate, N = 4 replicates. Error bars represent mean ± SD. nd, not determined; ns, non-significant; *p < 0.05, **p < 0.001. # represents lowest p value possible for permutation test.
Figure 5—figure supplement 1.
Figure 5—figure supplement 1.. Analysis of Fanconi Anemia (FA) mice at steady state.
(A) Peripheral blood (PB) myeloid cell frequencies. Each dot represents one animal. Each outlined dot represents the average value of a replicate containing multiple animals. (B) PB B cell frequencies. Each dot represents one animal. Each outlined dot represents the average value of a replicate containing multiple animals. (C) Complete blood count analysis. Each dot represents one animal. N = 13 for Fancc+/+, N = 16 for Fancc−/− mice. Unpaired t test was performed. (D) Bone marrow (BM) hematopoietic stem and progenitor cell (HSPC) frequencies. Each dot represents one animal. Each outlined dot represents the average value of a replicate containing multiple animals. One-way ANOVA was performed. (E) BM nucleated cells counts. Each dot represents one animal. Unpaired t test was performed. N = 12 for Fancc+/+ and Fancc−/− mice. (F) RFPRFP+YFP% in PB myeloid cells and B cells. Each dot represents one animal. Each outlined dot represents the average value of a replicate containing multiple animals. For (A–B) and (F), Fancc+/+, sample size = 11–17 mice per replicate, N = 5 replicates; Fancc+/−, sample size = 10–22 mice per replicate, N = 7 replicates; Fancc−/−, sample size = 9–17 mice per replicate, N = 4 replicates. For (D), Fancc+/+, sample size = 5–9 mice per replicate, N = 5 replicates; Fancc+/−, sample size = 6–12 mice per replicate, N = 5 replicates; Fancc−/−, sample size = 6–11 mice per replicate, N = 4 replicates. Error bars represent mean ± SD. ns, non-significant; *p < 0.05.
Figure 5—figure supplement 2.
Figure 5—figure supplement 2.. Analysis of Fanconi Anemia (FA) recipient mice.
(A) Young Fancc donor bone marrow (BM) hematopoietic stem and progenitor cell (HSPC) frequency analysis. N = 5 for Fancc+/+ or Fancc+/−, N = 2 for Fancc−/−. (B) Donor chimerism in recipient BM of young Fancc donor. Each dot represents one animal. Each outlined dot represents the average value of a replicate containing multiple animals. Two-way ANOVA was performed. Recipient sample size = 7–10 mice per replicate, N = 3 replicates per group. (C) Number of peripheral blood (PB) B cell precursors in recipients of young FA donor. (D) Number of PB T cell precursors in recipients of young FA donor. (E) Number of BM HSPC precursors in recipients of young FA donor. (F) Aging Fancc donor BM HSPC frequency analysis. N = 3 for Fancc+/+, N = 3 for Fancc. (G) Number of PB myeloid cell precursors in recipients of aging FA donor. (H) Number of PB T cell precursors in recipients of aging FA donor. (I) Donor chimerism in recipient BM of aging Fancc donor. Each dot represents one animal. Each outlined dot represents the average value of a replicate containing multiple animals. Two-way ANOVA was performed. Recipient sample size = 7–10 mice per replicate, N = 3 replicates per group. (J) Number of BM HSPC precursors in recipients of aging FA donor. For (C–E), (G, H), and (J), N = 3 replicates per group; permutation test was performed; dashed lines connect the average precursor numbers. Error bars represent mean ± SD. nd, not determined; ns, non-significant; *p < 0.05, **p < 0.001. # represents lowest p value possible for permutation test.
Author response image 1.
Author response image 2.
Author response image 3.
Author response image 4.

Update of

Similar articles

References

    1. Berger CN, Sturm KS. Estimation of the number of hematopoietic precursor cells during fetal mouse development by covariance analysis. Blood. 1996;88:2502–2509. doi: 10.1182/blood.v88.7.2502.bloodjournal8872502. - DOI - PubMed
    1. Bowling S, Sritharan D, Osorio FG, Nguyen M, Cheung P, Rodriguez-Fraticelli A, Patel S, Yuan WC, Fujiwara Y, Li BE, Orkin SH, Hormoz S, Camargo FD. An Engineered CRISPR-Cas9 Mouse Line for Simultaneous Readout of Lineage Histories and Gene Expression Profiles in Single Cells. Cell. 2020;181:1410–1422. doi: 10.1016/j.cell.2020.04.048. - DOI - PMC - PubMed
    1. Breivik H. Haematopoietic stem cell content of murine bone marrow, spleen, and blood. Limiting dilution analysis of diffusion chamber cultures. Journal of Cellular Physiology. 1971;78:73–78. doi: 10.1002/jcp.1040780111. - DOI - PubMed
    1. Buescher ES, Alling DW, Gallin JI. Use of an X-linked human neutrophil marker to estimate timing of lyonization and size of the dividing stem cell pool. The Journal of Clinical Investigation. 1985;76:1581–1584. doi: 10.1172/JCI112140. - DOI - PMC - PubMed
    1. Busch K, Klapproth K, Barile M, Flossdorf M, Holland-Letz T, Schlenner SM, Reth M, Höfer T, Rodewald H-R. Fundamental properties of unperturbed haematopoiesis from stem cells in vivo. Nature. 2015;518:542–546. doi: 10.1038/nature14242. - DOI - PubMed