. 2024 Dec 5;10(2):e184711.
doi: 10.1172/jci.insight.184711.

Variation in HIV-1 Tat activity is a key determinant in the establishment of latent infection

Affiliations

Variation in HIV-1 Tat activity is a key determinant in the establishment of latent infection

Francisco Gomez-Rivera et al. JCI Insight. .

Abstract

Despite effective treatment, human immunodeficiency virus (HIV) persists in optimally treated people as a transcriptionally silent provirus. Latently infected cells evade the immune system and the harmful effects of the virus, thereby creating a long-lasting reservoir of HIV. To gain a deeper insight into the molecular mechanisms of HIV latency establishment, we constructed a series of HIV-1 fluorescent reporter viruses that distinguish active versus latent infection. We unexpectedly observed that the proportion of active to latent infection depended on a limiting viral factor, which created a bottleneck that could be overcome by superinfection of the cell, T cell activation, or overexpression of HIV-1 transactivator of transcription (Tat). In addition, we found that tat and regulator of expression of virion proteins (Rev) expression levels varied among HIV molecular clones and that tat levels were an important variable in latency establishment. Lower rev levels limited viral protein expression whereas lower Tat levels or mutation of the Tat binding element promoted latent infection that was resistant to reactivation even in fully activated primary T cells. Nevertheless, we found that combinations of latency reversal agents targeting both cellular activation and histone acetylation pathways overcame deficiencies in the Tat/TAR axis of transcription regulation. These results provide additional insight into the mechanisms of latency establishment and inform Tat-centered approaches to cure HIV.

Keywords: Cellular immune response; Infectious disease; T cells; Virology.


Conflict of interest statement

Conflict of interest: The authors have declared that no conflict of interest exists.

Figures

Figure 1
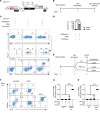
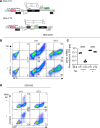
Figure 1. Dual reporter 89.6 VT1 can distinguish between latent and active HIV gene expression in CEM-SS cells.
(A) Diagram for dual reporter 89.6 VT1 expressing mCherry as a Gag-mCherry fusion protein using the native HIV promoter and eGFP driven by the spleen focus forming virus promoter (pSFFV) inserted in the env and nef open reading frames. (B) Schematic demonstrating the experimental process for C and D. (C) Flow cytometric analysis of CEM-SS cells transduced with 89.6 VT1 and treated with PMA, ionomycin, and raltegravir as indicated according to the timeline shown in B. (D) Summary graph of flow cytometric data for CEM-SS cells treated as for C. Statistical significance was determined by 2-way ANOVA with Holm-Šídák multiple comparisons test. The mean ± standard deviation is shown for 4 independent experiments, ****P ≤ 0.0001. (E) Schematic of the experimental process for panels FH. (F) Flow cytometric analyses of CEM-SS cells transduced with 89.6 VT1, treated as indicated, and sorted according to the timeline shown in E. (G and H) Summary graphs of RT-qPCR analysis of RNA from CEM-SS cells treated according to the timeline shown in E and isolated by FACS as in F. RNA copies were normalized to GAPDH RNA copies. Statistical significance was determined by 2-way ANOVA with Tukey’s multiple comparisons test (G and H). The mean ± standard deviation is shown for G and H for 4 independent experiments, ****P ≤ 0.0001. FSC, forward scatter; NT, no treatment.
Figure 2
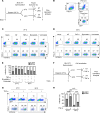
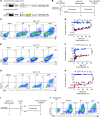
Figure 2. 89.6 VT1 identifies reversible latency in primary human HSPCs.
(A) Schematic of the experimental process for BE. (B) Flow cytometric analysis of HSPCs expanded, transduced, and sorted according to the timeline shown in A. As indicated, actively infected cells were removed via FACS by sorting latently infected (GFP+mCherry) cells. The isolated cells were mixed with uninfected cells so that changes in the proportions of active and latent infection following LRA treatment could be more accurately quantified. (C and D) Flow cytometric analysis of HSPCs from B divided into 37°C or 30°C incubation conditions with LRAs as indicated for 24 hours. (E) Summary graph of flow cytometric analysis (C and D). Result is shown for 1 experiment. (F) Schematic of the experimental process for G and H. (G) Flow cytometric analysis of HSPCs expanded and transduced according to the timeline shown in F. (H) Summary graph of flow cytometric analysis performed as in G. Statistical significance was determined by 2-way ANOVA with Holm-Šídák multiple comparisons test. The mean ± standard deviation is shown for 3 independent experiments. ****P ≤ 0.0001. SSC, side scatter.
Figure 3
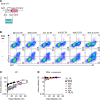
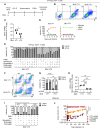
Figure 3. Factors that determine the likelihood of active and latent infection in reporter viruses from different HIV molecular clones.
(A) Diagram for dual reporter 89.6 VT1 probe as described in Figure 1A legend. (B) Diagram for dual reporter 454 VT2 reporter expressing GFP as a Gag-eGFP fusion protein using the native HIV promoter and mCherry driven by the elongation factor 1-a (EF1-α) promoter inserted in env. (C and D) Flow cytometric analysis of CEM-SS cells transduced with the indicated reporter virus, treated with PMA and ionomycin (ion) as indicated at 2 days postinfection (dpi), and harvested 3 dpi. (The same mock sample was used for C and D, but the x and y axes were transposed to allow representation of active infection on the y axis.) (E and F) Summary graphs of flow cytometric data from CEM-SS cells transduced with increasing amounts of the indicated virus and treated where indicated with PMA and ionomycin as described for C and D. Each point represents a replicate from 1 experiment. Similar results were obtained in 3 independent experiments. Statistical significance was determined by Deming (Model II) linear regression (E and F). ***P ≤ 0.001.
Figure 4
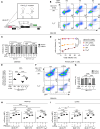
Figure 4. Variation in 5′ LTR sequence determines the proportion of actively versus latently infected quiescent CEM-SS cells.
(A) Diagram displaying the location in which donor-derived 5′ LTR sequences corresponding to HXB2 position 39 to 806 were substituted for the corresponding region in the 89.6 5′ LTR of VT1. (B) Flow cytometric analysis of CEM-SS cells transduced with 89.6 VT1 containing the indicated donor-derived 5′ LTR sequences, treated with PMA and ionomycin as indicated 2 dpi, and harvested 3 dpi. (C and D) Summary graphs of experiments performed as in B with increasing amounts of each reporter virus. Each point represents a technical replicate from 1 independent experiment. Similar results were obtained in 6 independent experiments. (Two of these experiments included VT1 and VT1Δvpr referred to in Figure 3.) Statistical significance was determined by Deming (Model II) linear regression (C and D). ***P ≤ 0.001.
Figure 5
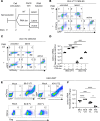
Figure 5. HIV tat levels vary in HIV molecular clones and reporter constructs.
(A) Schematic of the experimental process for panels BD. (B and C) Flow cytometric analysis of CEM-SS transduced with the indicated reporter virus, treated as indicated with PMA and ionomycin, and sorted according to the timeline shown in A. (D) Summary graph of RT-qPCR analysis of RNA isolated from CEM-SS cells treated with the indicated virus and sorted for latent or active infection according to the timeline shown in A. 5′ LTR-FRP indicates whether the fluorescent reporter protein (FRP) was expressed by each sorted population. Statistical significance was determined by 1-way ANOVA with Tukey’s multiple comparisons test. Mean values ± standard deviation are shown from 3 independent experiments, ***P ≤ 0.001. (E) Flow cytometric analysis of HEK293T cells transiently transfected with the indicated construct. Where indicated, permeabilized cells were stained with an antibody directed at HIV Gag. (The same mock sample was used for both viruses, but the x and y axes were transposed to allow representation of active infection on the y axis.) (F) Summary graph of RT-qPCR analysis of RNA from HEK293T cells transiently transfected with the indicated construct as in E. Statistical significance was determined by 1-way ANOVA with Tukey’s multiple comparisons test. Mean values ± standard deviation are shown from 3–5 independent experiments, *P ≤ 0.05; ***P ≤ 0.001; and ****P ≤ 0.0001.
Figure 6
Figure 6. Insertion of constitutive promoter between Tat exons in 89.6 VT1 reduces Tat expression and increases latency.
(A) Top, diagram of 89.6 VT1 as described in Figure 1A legend. Bottom, diagram for dual reporter, 89.6 VT3, in which eGFP driven by the spleen focus forming virus promoter (pSFFV) was inserted in env between tat/rev exons instead of 3′ to the second tat exon as in 89.6 VT1. (B) Flow cytometric analysis of HEK293T cells transiently transfected with the indicated reporter construct plus a plasmid expressing tat89.6 as indicated. (C) Summary graph of tat/rev RT-qPCR analysis of RNA isolated from HEK293T cells transiently transfected as for panel B. Statistical significance was determined by 1-way ANOVA with Tukey’s multiple comparisons test comparisons. Mean values ± standard deviation are shown, from 3 independent experiments, ****P ≤ 0.0001. (D) Flow cytometric analysis of CEM-SS cells transduced with the indicated reporter virus, treated 2 dpi as indicated with PMA and ionomycin, and harvested 3 dpi. Similar results were obtained in 3 independent experiments.
Figure 7
Figure 7. Overexpression of HIV tat dramatically reduces the impact of viral inoculum on latency establishment.
(A) Diagram for lentivirus encoding HIV spliced tat and puromycin resistance gene (51). (B) Schematic of the experimental process for panels CH. (C, E, and G) Representative flow cytometric plots of CEM-SS cells stably expressing lentiviral vectors as indicated and transduced with indicated reporter virus according to the timeline shown in B. (D, F, and H) Summary graphs of flow cytometric analysis of CEM-SS cells stably expressing lentiviral vectors as indicated and transduced with increasing amounts of the indicated reporter virus according to the timeline shown in B. Each point represents a technical replicate from 3 independent experiments: SS, parental CEM-SS cells; EV, CEM-SS cells stably expressing the empty lentiviral vector; tat89.6, CEM-SS stably expressing a lentiviral vector containing tat as in A. (I) Schematic demonstrating the experimental process for panel J. (J) Flow cytometric analysis of CEM-SS cells transduced with 89.6 VT1, sorted for latently infected cells (GFP+mCherry), and then transduced with the indicated lentiviral vector according to the timeline shown in I. Similar results were obtained in 3 independent experiments. For D, F, and H, statistical significance was determined by Deming (Model II) linear regression, ****P ≤ 0.0001.
Figure 8
Figure 8. Lower levels of HIV tat increase the probability of noninduced provirus in fully activated primary T cells infected in vitro.
(A) Schematic of the experimental process. (B) Flow cytometric analysis of cells transduced with the indicated reporter. (C) Summary of RT-qPCR analysis of RNA isolated from cells transduced with the indicated reporter virus as in A. *P ≤ 0.05 by 2-tailed unpaired t test, n = 5. (D) Summary of flow cytometric analysis of cells transduced with the indicated reporter virus as in A and harvested at the indicated day after infection. n = 3. (E) Summary graph of flow cytometric analysis of cells treated as in A. n = 1. (F) Flow cytometric analysis of cells treated as in A with all 5 LRAs (cLRA). (G) Summary graph of flow cytometric data from cells as shown in F. n = 3. (H) Summary graph of RT-qPCR analysis of RNA isolated from cells transduced with the indicated reporter virus and treated where indicated with cLRAs as in A. n = 3. (I) Summary graph of flow cytometric analysis of transduced CEM-SS cells treated with the indicated LRAs. n = 3. (J) Summary graph of flow cytometric analysis of CEM-SS transduced with increasing amounts of the indicated reporter virus plus or minus cLRAs as indicated in I. Statistical significance was determined by Deming (Model II) linear regression. Each point represents a technical replicate from 4 independent experiments. (cLRA included PMA, ionomycin, bryostatin-1, entinostat, and vorinostat.) (NT, no LRA treatment) (89.6 VT1 [VT1], 89.6 VT3 [VT3]). For C, D, and GI, the mean ± standard deviation is shown. For GI **P ≤ 0.01; ***P ≤ 0.001; ****P ≤ 0.0001 by 1-way ANOVA with Tukey’s multiple comparisons test.
Figure 9
Figure 9. TAR mutation phenocopies low tat levels and creates a barrier to induction of active infection.
(A) Diagram of TAR mutant dual reporter (58). (B) Flow cytometric analysis of transduced CEM-SS cells treated with cLRAs (2 dpi) and harvested 3 dpi. Where indicated cells expressed pscALPS-puro tat89.6 (Figure 7). (C) Summary of flow cytometric analysis of cells treated as for B. n = 3. (D) Summary of flow cytometric analysis (as in B) with increases in the indicated reporter virus. Active infection was assessed by the proportion of GFP+ cells that were also mCherry+. Statistical significance was determined by Deming (Model II) linear regression. Each point represents a technical replicate from 1 experiment, n = 4. (E) Summary graph of RT-qPCR analysis of RNA from transduced CEM-SS treated with cLRAs as for B. Untreated cells were sorted for GFP+mCherry whereas cLRA-treated cells were sorted for GFP+mCherry+ cells 3 dpi. n = 4. (F) Flow cytometric analysis of transduced PHA-activated primary CD4+ T cells treated according to the timeline shown in Figure 8A. (G) Summary graph of flow cytometric data from cells as shown in F. n = 4. (H and I) Summary graphs of flow cytometric analysis of cells transduced with the indicated reporter construct and treated with PMA and ionomycin (H) or cLRA (I) as for B. n = 3. (cLRA included PMA, ionomycin, bryostatin-1, entinostat, and vorinostat.) For C and GI statistical significance was determined by 1-way ANOVA with Tukey’s multiple comparisons test. The mean ± standard deviation is shown. *P ≤ 0.05; **P ≤ 0.01; ***P ≤ 0.001; ****P ≤ 0.0001.

References

    1. World Health Organization. HIV and AIDS. https://www.who.int/news-room/fact-sheets/detail/hiv-aids Accessed December 4, 2024.
    1. United Nations. UNAIDS Data 2022. https://www.unaids.org/sites/default/files/media_asset/data-book-2022_en... Accessed December 4, 2024.
    1. Davey RT, et al. HIV-1 and T cell dynamics after interruption of highly active antiretroviral therapy (HAART) in patients with a history of sustained viral suppression. Proc Natl Acad Sci U S A. 1999;96(26):15109–15114. doi: 10.1073/pnas.96.26.15109. - DOI - PMC - PubMed
    1. Pannus P, et al. Rapid viral rebound after analytical treatment interruption in patients with very small HIV reservoir and minimal on-going viral transcription. J Int AIDS Soc. 2020;23(2):e25453. doi: 10.1002/jia2.25453. - DOI - PMC - PubMed
    1. Finzi D, et al. Latent infection of CD4+ T cells provides a mechanism for lifelong persistence of HIV-1, even in patients on effective combination therapy. Nat Med. 1999;5(5):512–517. doi: 10.1038/8394. - DOI - PubMed

MeSH terms

Substances