

Mimicking Retinoblastoma Treatment With Repeated Topotecan or Melphalan Develops Cross-Resistance to Classic Agents But Not to Repurposed Drugs
- PMID: 39636723
- PMCID: PMC11622161
- DOI: 10.1167/iovs.65.14.14
Mimicking Retinoblastoma Treatment With Repeated Topotecan or Melphalan Develops Cross-Resistance to Classic Agents But Not to Repurposed Drugs
Abstract
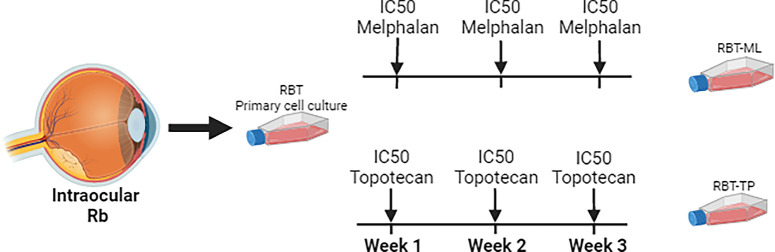
Purpose: Refractory or recurrent retinoblastoma results from acquired chemoresistance and the management of these eyes often requires surgical removal. Our objective was to develop retinoblastoma models resistant to chemotherapy by exposing cancer cells to repeated chemotherapy mimicking the clinical scenario. These newly resistant cells were used to evaluate potential novel therapies.
Methods: Chemoresistant cells were obtained by exposing two primary retinoblastoma cell cultures to three weekly doses of melphalan or topotecan. The sensitivity of these resistant cells to each chemotherapy was evaluated, and cross-resistance to topotecan, melphalan, and carboplatin was assessed. Genomic alterations and differential expression of efflux/influx transporters between chemoresistant and parental cells were analyzed. Subsequently, sensitivity of both resistant and parental cells to the repurposed agents digoxin, methylene blue, and gemcitabine was assessed.
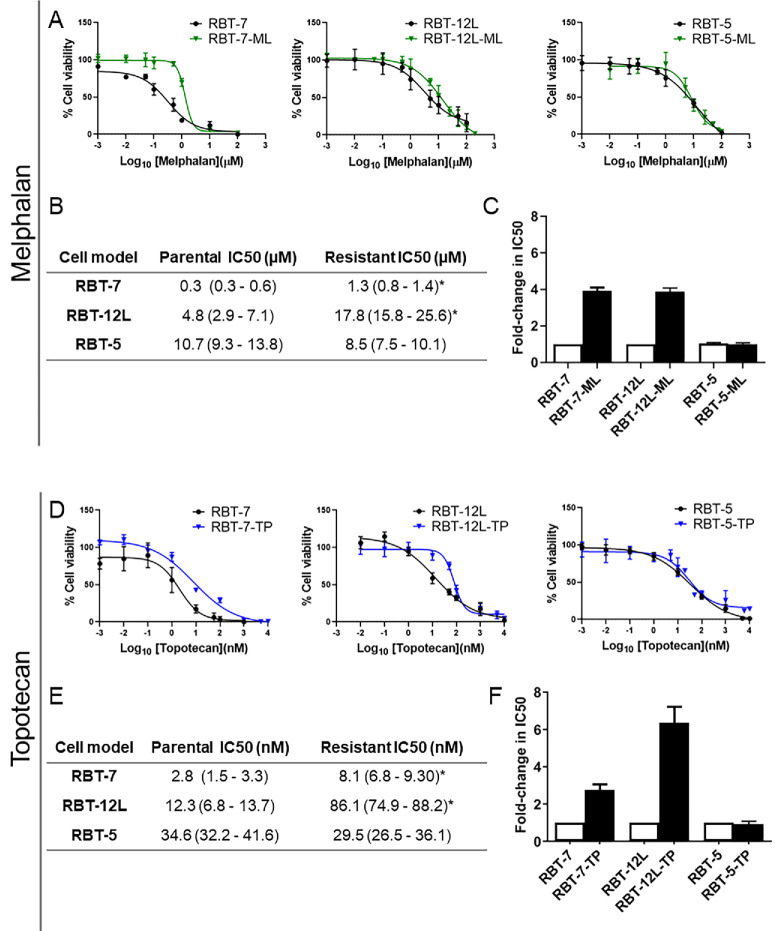
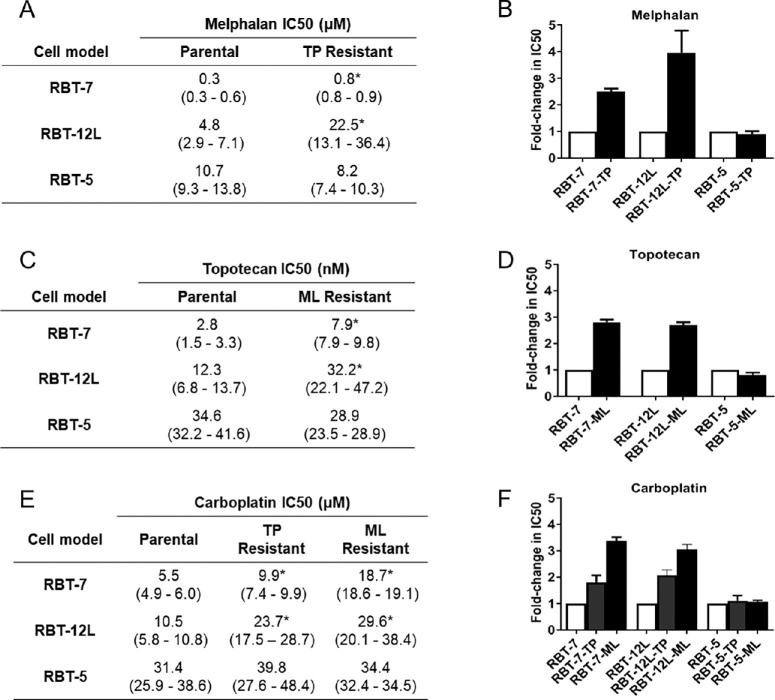
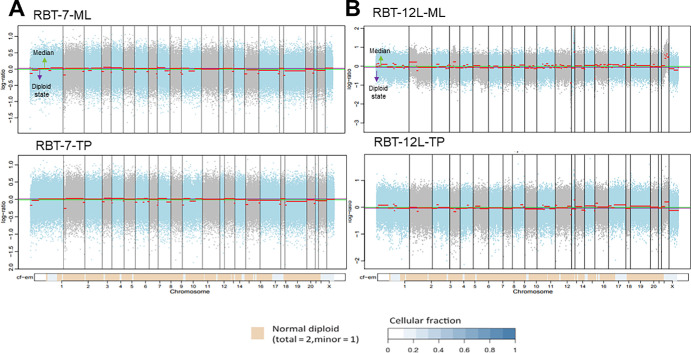
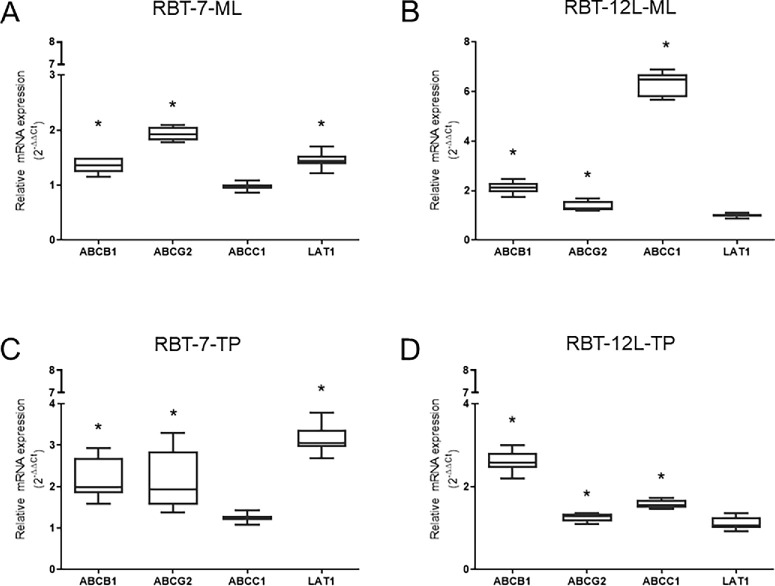
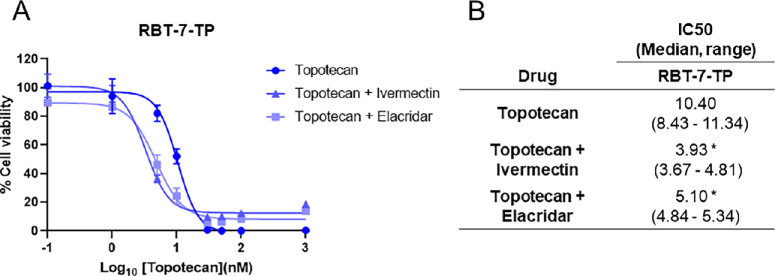
Results: Four chemoresistant models were successfully established, showing significantly higher half-maximal inhibitory concentration (IC50) values for melphalan and topotecan compared to their corresponding parental cells (P < 0.05). Cross-resistance between melphalan and topotecan was demonstrated, with a 3-fold increase in the IC50. Chemoresistant cells also showed reduced sensitivity to carboplatin (P < 0.05) compared to parental cells, whereas sensitivity to the evaluated repurposed agents remained unchanged. Genomic analysis revealed no selective alterations in the resistant cells, although differential expression of influx/efflux transporters was observed across all chemoresistant models.
Conclusions: In vitro simulation of patient treatment was useful to establish chemoresistant retinoblastomas and to identify strategies to overcome resistance to topotecan or melphalan through drug repurposed. Our results warrant further investigation to support the clinical translation.
Conflict of interest statement
Disclosure:
Figures
Similar articles
-
Three-drug intra-arterial chemotherapy using simultaneous carboplatin, topotecan and melphalan for intraocular retinoblastoma: preliminary results.Br J Ophthalmol. 2012 Oct;96(10):1300-3. doi: 10.1136/bjophthalmol-2012-301925. Epub 2012 Aug 3. Br J Ophthalmol. 2012. PMID: 22863945
-
Combined intravitreal melphalan and topotecan for refractory or recurrent vitreous seeding from retinoblastoma.JAMA Ophthalmol. 2014 Aug;132(8):936-41. doi: 10.1001/jamaophthalmol.2014.414. JAMA Ophthalmol. 2014. PMID: 24789622
-
The Addition of Topotecan to Melphalan in the Treatment of Retinoblastoma with Intra-arterial Chemotherapy.Ophthalmol Retina. 2021 Aug;5(8):824-830. doi: 10.1016/j.oret.2020.11.007. Epub 2020 Nov 19. Ophthalmol Retina. 2021. PMID: 33221516
-
OCULAR PHARMACOLOGY OF CHEMOTHERAPY FOR RETINOBLASTOMA.Retina. 2017 Jan;37(1):1-10. doi: 10.1097/IAE.0000000000001275. Retina. 2017. PMID: 27617542 Review.
-
The role for intra-arterial chemotherapy for refractory retinoblastoma: a systematic review.Clin Transl Oncol. 2021 Oct;23(10):2066-2077. doi: 10.1007/s12094-021-02610-z. Epub 2021 Apr 7. Clin Transl Oncol. 2021. PMID: 33826082
References
-
- World Health Organization (WHO). CureAll Framework: WHO Global Initiative for Childhood Cancer: Increasing Access, Advancing Quality, Saving Lives. World Health Organization; 2021. Available at: https://www.who.int/publications/i/item/9789240025271.
-
- Tomar AS, Finger PT, Gallie B, et al. .. A multicenter, international collaborative study for American Joint Committee on Cancer Staging of Retinoblastoma: Part I: Metastasis-Associated Mortality. Ophthalmology. 2020; 127(12): 1719–1732. - PubMed
-
- Shields CL, Mashayekhi A, Au AK, et al. .. The International Classification of Retinoblastoma predicts chemoreduction success. Ophthalmology. 2006; 113(12): 2276–2280. - PubMed
MeSH terms
Substances
LinkOut - more resources
Full Text Sources
