

spatialGE Is a User-Friendly Web Application That Facilitates Spatial Transcriptomics Data Analysis
- PMID: 39636739
- PMCID: PMC11873723
- DOI: 10.1158/0008-5472.CAN-24-2346
spatialGE Is a User-Friendly Web Application That Facilitates Spatial Transcriptomics Data Analysis
Abstract
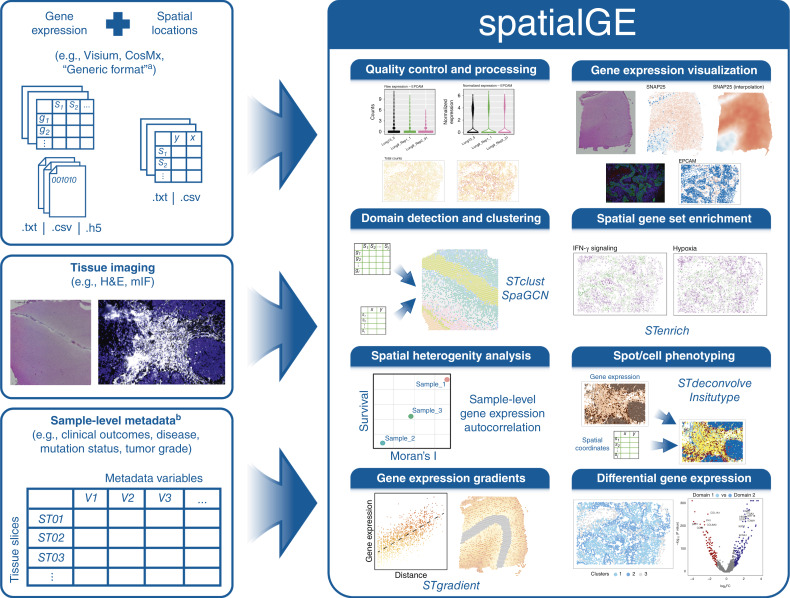
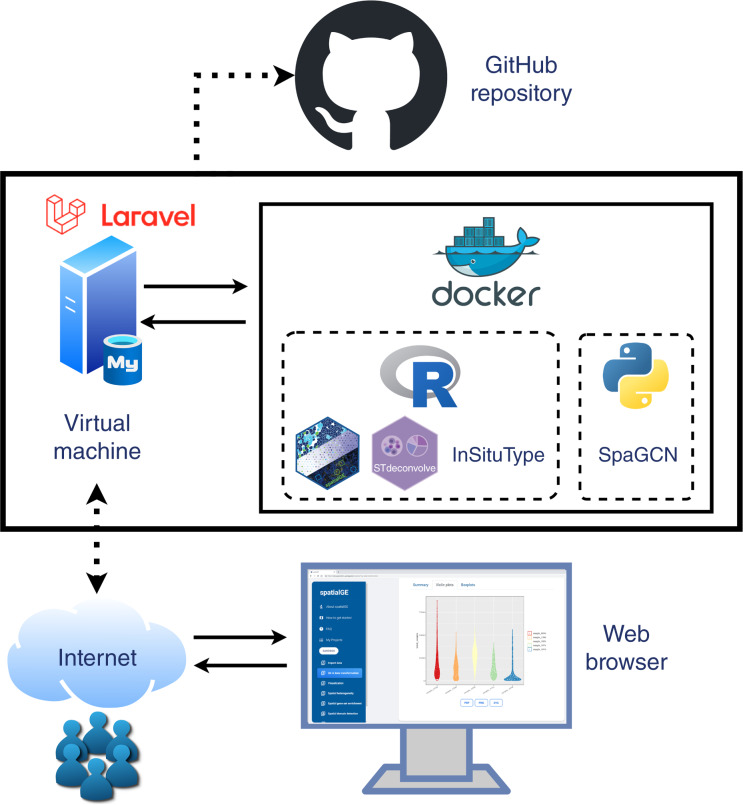
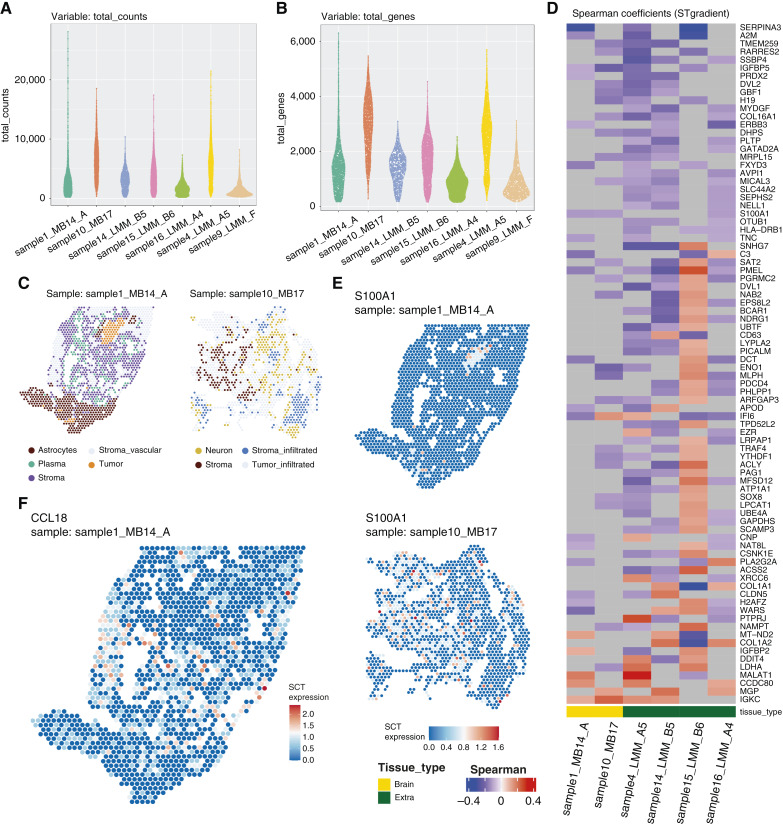
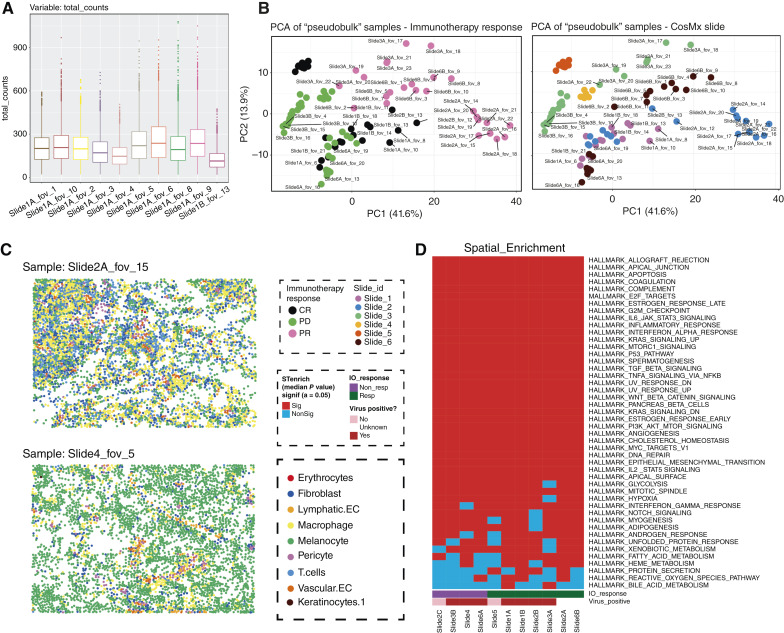
Spatial transcriptomics (ST) is a powerful tool for understanding tissue biology and disease mechanisms. However, the advanced data analysis and programming skills required can hinder researchers from realizing the full potential of ST. To address this, we developed spatialGE, a web application that simplifies the analysis of ST data. The application spatialGE provided a user-friendly interface that guides users without programming expertise through various analysis pipelines, including quality control, normalization, domain detection, phenotyping, and multiple spatial analyses. It also enabled comparative analysis among samples and supported various ST technologies. The utility of spatialGE was demonstrated through its application in studying the tumor microenvironment of two data sets: 10× Visium samples from a cohort of melanoma metastasis and NanoString CosMx fields of vision from a cohort of Merkel cell carcinoma samples. These results support the ability of spatialGE to identify spatial gene expression patterns that provide valuable insights into the tumor microenvironment and highlight its utility in democratizing ST data analysis for the wider scientific community. Significance: The spatialGE web application enables user-friendly exploratory analysis of spatial transcriptomics data by using a point-and-click interface to guide users from data input to discovery of spatial patterns, facilitating hypothesis generation.
©2024 The Authors; Published by the American Association for Cancer Research.
Conflict of interest statement
O.E. Ospina reports grants from NIH/NCI during the conduct of the study. R. Manjarres-Betancur reports grants from NIH during the conduct of the study. I. Smalley reports grants from Melanoma Research Alliance, NIH, and American Cancer Society during the conduct of the study. J. Markowitz reports grants from TuHURA and Merck outside the submitted work, as well as a patent application for Moffitt filed unrelated to the current project pending. S.A. Eschrich reports grants from NIH/NCI during the conduct of the study, as well as a stockholder/co-founder/board member of Cvergenx, Inc., a genomic-based precision radiotherapy company. B.L. Fridley reports grants from NIH during the conduct of the study. No disclosures were reported by the other authors.
Figures
Update of
-
spatialGE: A user-friendly web application to democratize spatial transcriptomics analysis.bioRxiv [Preprint]. 2024 Jul 2:2024.06.27.601050. doi: 10.1101/2024.06.27.601050. bioRxiv. 2024. Update in: Cancer Res. 2025 Mar 03;85(5):848-858. doi: 10.1158/0008-5472.CAN-24-2346. PMID: 39005315 Free PMC article. Updated. Preprint.
References
-
- Moses L, Pachter L. Museum of spatial transcriptomics. Nat Methods 2022;19:534–46. - PubMed
MeSH terms
Grants and funding
LinkOut - more resources
Full Text Sources
Medical
