. 2024 Dec 5;20(12):e1012663.
doi: 10.1371/journal.ppat.1012663. eCollection 2024 Dec.

Single-cell analysis reveals host S phase drives large T antigen expression during BK polyomavirus infection

Affiliations

Single-cell analysis reveals host S phase drives large T antigen expression during BK polyomavirus infection

Jason M Needham et al. PLoS Pathog. .

Abstract

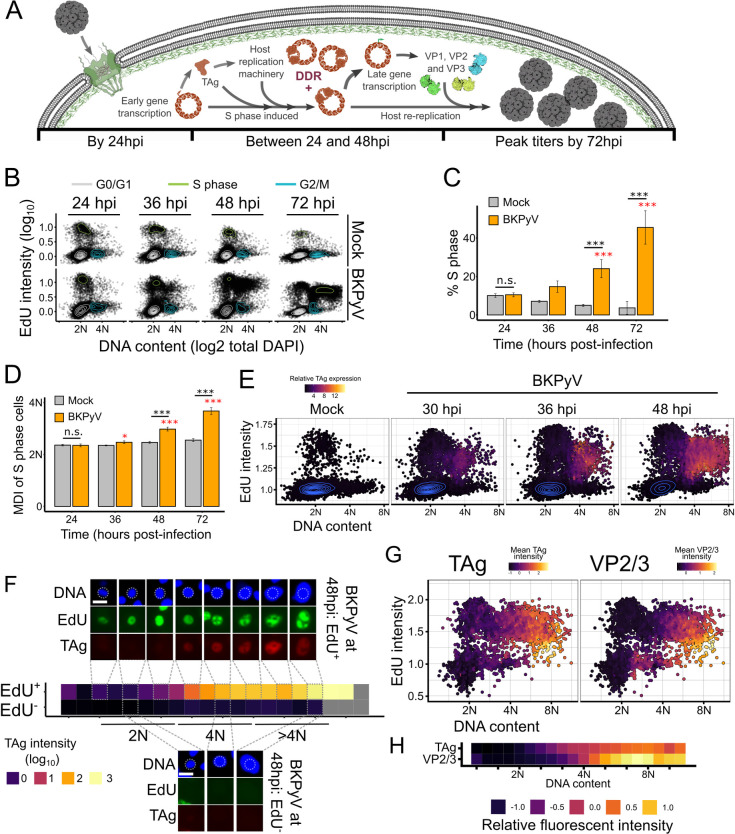
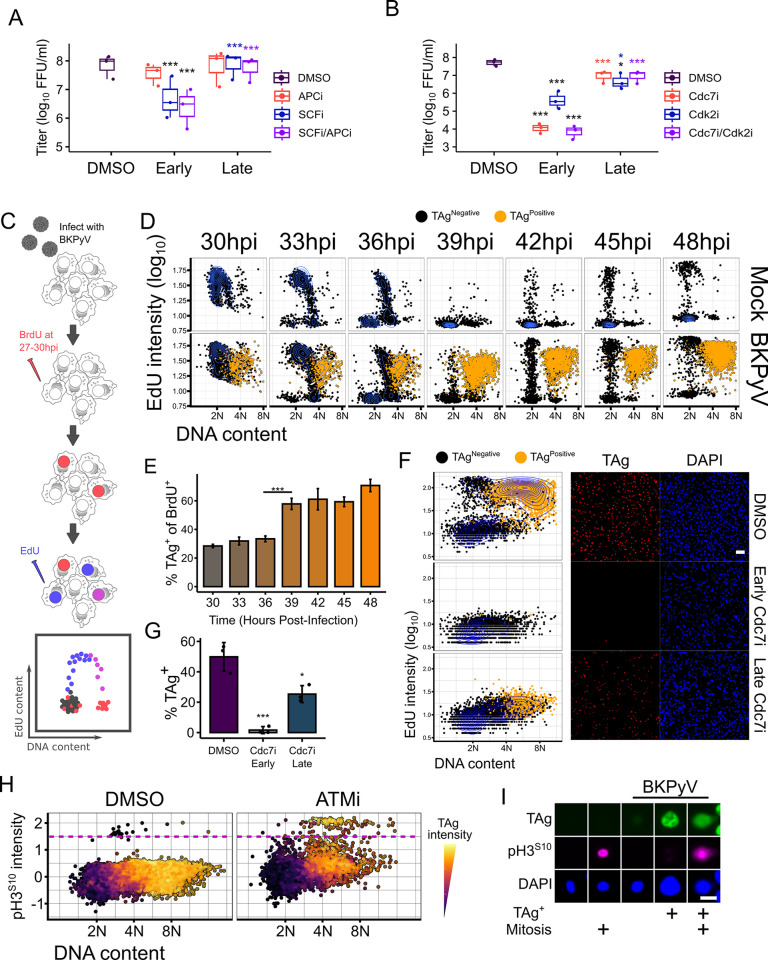
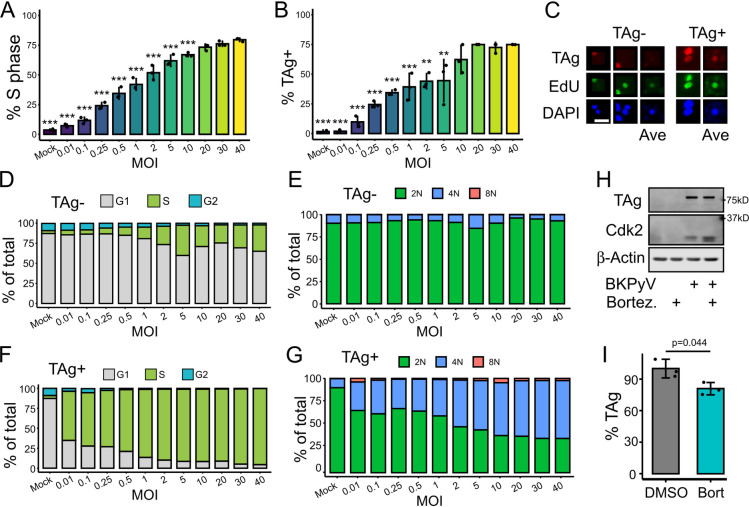
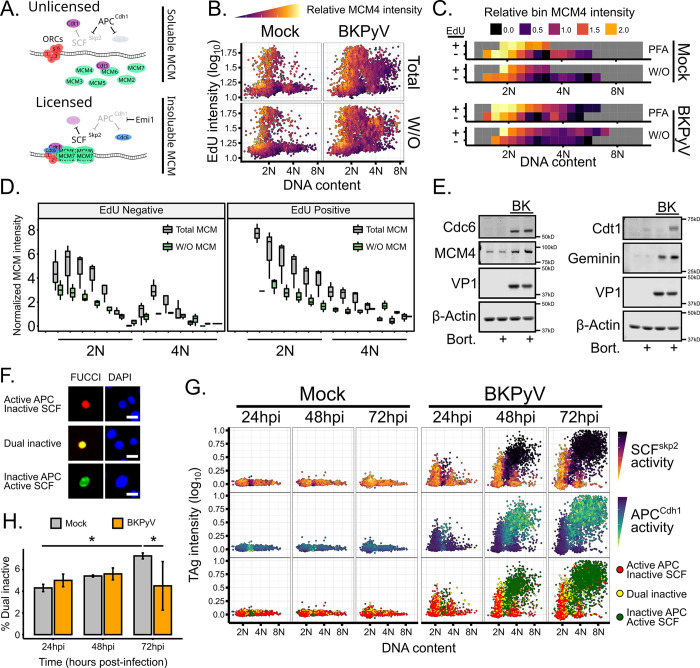
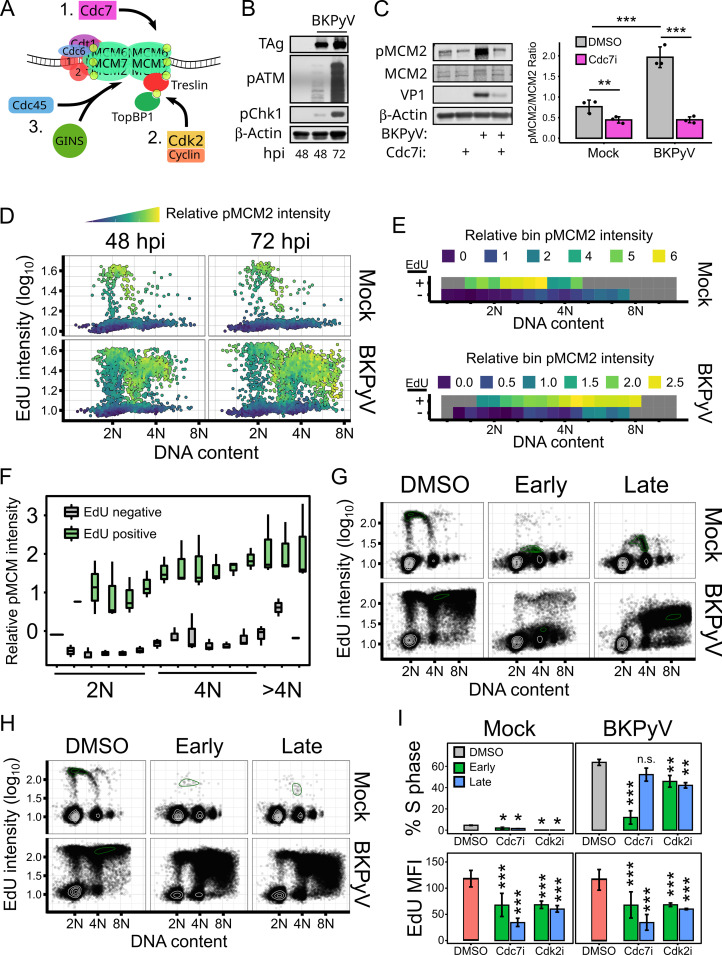
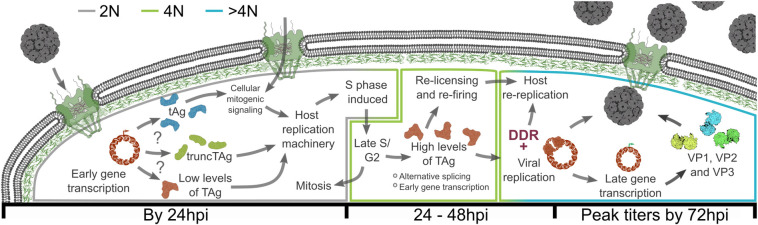
BK polyomavirus (BKPyV) is a major cause of kidney transplant failure, for which there are no antivirals. The current model is that BKPyV expresses TAg (large T antigen) early during infection, promoting cells to enter S phase where the viral DNA can access the host replication machinery. Here, we performed a single-cell analysis of viral TAg expression throughout the cell cycle to reveal that robust TAg expression required replication of the host DNA first. By using inhibitors that only affect host and not viral replication, we show that both TAg expression and viral production rely on an initial S phase. BKPyV is known to promote cellular re-replication, where the cell re-enters S phase from G2 phase (without passing through mitosis or G1 phase) to prolong S phase for viral replication. Thus, BKPyV infection results in cells with greater than 4N DNA content. We found that these subsequent rounds of replication of the host DNA relied on canonical host cell cycle machinery and regulators despite BKPyV infection. Together, these findings suggest a model for polyomavirus replication, where robust viral TAg expression depends on an initial host S phase and that BKPyV primarily replicates during host re-replication. Having a better understanding of the molecular events that are required for BKPyV production will help identify effective therapeutic targets against BKPyV.


Conflict of interest statement

The authors have declared that no competing interests exist.

Figures

Fig 1
Fig 1. Robust expression of TAg was observed only in the re-replicating population.
(A) Model of the current paradigm of a BKPyV infection. (B) Cell cycle diagrams generated from immunofluorescent assays (IFA) of mock or BKPyV-infected RPTE cells (MOI = 0.5) at 24, 36, 48, or 72hpi. Representative of n = 3 biological replicates is shown. (C) Quantification of cells in S phase from (A). Significance relative to mock or BKPyV at 24hpi are indicated by black or red asterisks, respectively. (D) Mean DNA intensity (MDI) of the S phase cells with significance as in (C). (E) Representative single-cell cell cycle diagrams (n = 3) generated from IFA images of mock (36hpi) or BKPyV-infected (MOI = 0.5; at 30, 36, or 48hpi) RPTE cells, pseudocolored by mean nuclear TAg intensity. (F) Representative binned analysis (n = 3) of TAg at 48hpi with randomly selected cells from each bin shown. For each replicate, 20 images were taken of each condition for an average of 18,000 cells/condition. Scale bar = 20 μm. (G) Representative cell cycle plots (n = 3) were colored based on TAg or VP2/3 intensity at 72hpi. (H) Representative binned analysis (n = 3) of TAg and VP2/3 expression at 72hpi. For each replicate, 20 images were taken of each condition for an average of 18,000 cells/condition. Statistical significance was determined by multi-factorial ANOVA and a Tukey post-hoc (*: p < 0.05, **: p < 0.01, ***: p < 0.001).
Fig 2
Fig 2. BKPyV robustly expresses TAg in late S/G2 following the initial S phase.
(A-B) Viral titers (n = 3) from RPTEs treated with DMSO, (A) E3 ubiquitin ligases inhibitors (APCi: 10μM ProTAME and SCFi: 10μM MLN4924), or (B) origin firing inhibitors (Cdc7: 10μM PHA-767491, Cdk2: 3μM NU-6140). Inhibitors were added at 18hpi (Early) or at 48 hpi (Late) and virus was titered at 72hpi by focus forming assay. Black asterisks denote significance from the DMSO control while colored asterisks in the late groups denote significance from the early sample of the same inhibitor. (C) Experimental design for the BrdU/EdU pulse-chase labeling. Cells were labeled with BrdU from 27-30hpi, washed and grown in label-free medium, then labeled with EdU for 3 hours prior to fixation at the indicated time points. (D) Cell cycle diagrams were generated for BrdU+ cells based on S phase (EdU) and DNA content (FxCycle Violet). Cells were gated based on nuclear TAg intensity and TAg+ cells are indicated in orange. Shown are representative cell cycle diagrams (n = 5) generated from IFA images of BrdU/EdU pulsed, mock or BKPyV-infected (MOI = 0.5) RPTEs. (E) Quantification of the percent of TAg+ cells in the BKPyV-infected, BrdU+ population from (D). (F) Representative cell cycle diagrams and IFA images (n = 3) of BKPyV-infected RPTE cells treated with either DMSO or the Cdc7 inhibitor at 18hpi (Early) or at 48hpi (Late). Cells were fixed at 72hpi and IFA was performed for cell cycle analysis and TAg intensity. Scale bar represents 100μm. (G) Quantification of percent TAg+ cells from Cdc7 inhibited cells from (F). (H) Representative plot (n = 3) of DNA content by mitosis (pH3S10) in BKPyV-infected RPTEs treated with the ATM inhibitor (10 μM, AZD0156) at 24hpi and fixed at 72hpi. Dots are colored to show TAg intensity and the dotted line indicates the cut-off used for mitotic cells. For each condition and replicate, at least 2,300 cells were imaged for analysis. (I) Representative images (n = 5) of mock or BKPyV-infected cells showing TAg and mitosis negative or positive cells. Scale bar represents 20μm. Statistical significance was determined using a one-way ANOVA and a Tukey post-hoc (*: p < 0.05, ***: p < 0.001). See also S1 and S2 Figs.
Fig 3
Fig 3. Robust TAg expression is not regulated by genome copy number nor degradation.
(A-G) RPTEs were infected with increasing amounts of BKPyV (MOI = 0.01 to 40) and fixed at 48hpi, imaged, and used to quantify percent S phase (A-C) and percent TAg+ (B) with representative images of cells from MOI = 40 shown in (C). To generate an averaged image, pixel intensities of 20 cells randomly selected from the TAg- and TAg+ populations were averaged to create a new image. Statistical significance was determined by one-way ANOVA using a Tukey post-hoc with asterisks denoting significance from the 40 MOI sample (n = 3; **: p < 0.01, ***: p < 0.001). Scale bar represents 20μm. (D, E) The TAg- populations were gated into G1, S, and G2 populations (D) to visualize cell cycle distribution, or into 2N, 4N, and 8N populations to visualize re-replication (E). (F, G) The same gating analysis as shown in (D,E) was used for the TAg+ population. (H, I) Representative western analysis (H) and TAg quantification (I) (n = 3) of mock or BKPyV-infected RPTE cell lysates treated with either DMSO or the proteasome inhibitor bortezomib (0.5μM) and collected at 48hpi. Statistical significance was determined using a Student’s t-test (H).
Fig 4
Fig 4. Origin licensing uses canonical mechanisms during BKPyV-induced re-replication.
(A) Diagram of host origin licensing and MCM solubility. (B-D) Representative cell cycle plots from mock and BKPyV-infected RPTEs at 48hpi and colored by relative MCM4 intensity. Total MCM4 was visualized by fixing cells in PFA, while chromatin-associated MCM4 (W/O) was visualized by permeabilizing cells prior to fixation. (C) Representative binning analysis of PFA-fixed (Total) or washout (W/O) data shown in (B) was split by EdU status and binned by DNA content. (D) Quantification of the binned data represented in (C). (E) Representative western analyses of licensing factors after proteasome inhibition (Bort.) at 48hpi. (F-H) Representative images of FastFUCCI transduced RPTEs (F). Scale bar represents 20μm. (G) Representative plot of FastFUCCI-transduced mock or BKPyV-infected (MOI = 0.5) cells fixed at 24, 48, and 72hpi. Only cells positive for a FastFUCCI fluorophore are represented and colored based on fluorophore intensities. (H) Quantification of dual positive cells shown in panel G. Statistical significance was determined by two-way ANOVA using infection state and time and a Tukey post-hoc (n = 3; *: p < 0.05). See also S3 Fig.
Fig 5
Fig 5. Firing of new origins of replication during BKPyV-induced re-replication required canonical kinases Cdc7 and Cdk2.
(A) Diagram of canonical host origin firing. (B) Representative western analysis of viral proteins and markers of DDR activation from mock and BKPyV-infected RPTEs at various timepoints post-infection (n = 3). (C) Representative western analysis of mock and BKPyV-infected RPTEs treated with DMSO or Cdc7 inhibitor PHA-767491 (15μM) at 18hpi and collected at 48hpi with quantification (n = 3). (D-F) Representative cell cycle analysis of mock or BKPyV-infected RPTE cells fixed at 48 and 72hpi colored by relative pMCM2S53 intensity (n = 3). Relative pMCM2S53 intensity was calculated by dividing the pMCM2S53 intensity of each cell by the sample average of pMCM2S53. (E) Representative binning analysis of 72hpi cells shown in panel. Boxes are colored by relative pMCM2S53 intensity, except for boxes with fewer than 10 cells (gray). (F) Quantification of the pMCM2S53 intensity from the binning analysis in panel (E). (G-I) Flow cytometry-based cell cycle analyses at 72 hpi of mock and BKPyV-infected RPTEs treated at 18hpi (Early) or 48hpi (Late) using 15μM Cdc7 inhibitor PHA-767491 (G) or 10μM Cdk2 inhibitor NU-6140 (H). (I) Quantification of S phase and EdU mean fluorescent intensity (MFI) of the cells from data represented in (F) and (G). Statistical significance was determined by (C) two-way ANOVA using infection and Cdc7i or (I) one-way ANOVA, followed by a Tukey post-hoc with asterisks denoting significant differences from the DMSO sample (n = 3; *: p < 0.05, **: p < 0.01, ***: p < 0.001). See also S4 Fig.
Fig 6
Fig 6. Model for the dependence of BKPyV on host replication.
Robust S phase may be induced by 1) tAg enhanced mitogenic signaling through disruption of the protein phosphatases, 2) expression of the truncated TAg that contains a pRb binding domain, or 3) low levels of TAg that are primarily directed towards pRb inhibition. As the cell enters late S or G2, TAg rapidly accumulates and inhibits pRb to stimulate host re-replication through origin re-licensing and re-firing using canonical mechanisms. Since the rapid TAg accumulation in the late S or G2 populations cannot be explained by an increase in genomes, it may be due to a phase-specific shift in early gene splicing and/or transcription. In the re-replicating population, BKPyV uses host replication machinery and TAg to replicate viral genomes. High levels of viral replication here activate the DNA damage response (DDR), which maintains a re-replicating population. After TAg expression and viral replication, the structural proteins are expressed, and viral progeny are detected concurrent with host re-replication.

Similar articles

Cited by

References

    1. Helle F, Brochot E, Handala L, Martin E, Castelain S, Francois C, et al.. Biology of the BKPyV: An Update. Viruses. 2017. Nov 3;9(11):327. doi: 10.3390/v9110327 - DOI - PMC - PubMed
    1. Viscidi RP, Rollison DE, Sondak VK, Silver B, Messina JL, Giuliano AR, et al.. Age-Specific Seroprevalence of Merkel Cell Polyomavirus, BK Virus, and JC Virus ▿. Clin Vaccine Immunol CVI. 2011. Oct;18(10):1737–43. - PMC - PubMed
    1. Hirsch HH, Knowles W, Dickenmann M, Passweg J, Klimkait T, Mihatsch MJ, et al.. Prospective study of polyomavirus type BK replication and nephropathy in renal-transplant recipients. N Engl J Med. 2002. Aug 15;347(7):488–96. doi: 10.1056/NEJMoa020439 - DOI - PubMed
    1. Starrett GJ, Buck CB. The case for BK polyomavirus as a cause of bladder cancer. Curr Opin Virol. 2019. Dec;39:8–15. doi: 10.1016/j.coviro.2019.06.009 - DOI - PMC - PubMed
    1. Rao N, Starrett GJ, Piaskowski ML, Butler KE, Golubeva Y, Yan W, et al.. Analysis of Several Common APOBEC-type Mutations in Bladder Tumors Suggests Links to Viral Infection. Cancer Prev Res Phila Pa. 2023. Oct 2;16(10):561–70. doi: 10.1158/1940-6207.CAPR-23-0112 - DOI - PMC - PubMed

MeSH terms

Substances

LinkOut - more resources