. 2024 Dec 10;121(50):e2408114121.
doi: 10.1073/pnas.2408114121. Epub 2024 Dec 5.

Intricate ribosome composition and translational reprogramming in epithelial-mesenchymal transition

Affiliations

Intricate ribosome composition and translational reprogramming in epithelial-mesenchymal transition

Chloé Morin et al. Proc Natl Acad Sci U S A. .

Abstract

Epithelial-mesenchymal transition (EMT) involves profound changes in cell morphology, driven by transcriptional and epigenetic reprogramming. However, evidence suggests that translation and ribosome composition also play key roles in establishing pathophysiological phenotypes. Using genome-wide analyses, we reported significant rearrangement of the translational landscape and machinery during EMT. Specifically, a cell line overexpressing the EMT transcription factor ZEB1 displayed alterations in translational reprogramming and fidelity. Furthermore, using riboproteomics, we unveiled an increased level of the ribosomal protein RPL36A in mesenchymal ribosomes, indicating precise tuning of ribosome composition. Remarkably, RPL36A overexpression alone was sufficient to trigger the acquisition of mesenchymal features, including a switch in the molecular pattern, cell morphology, and behavior, demonstrating its pivotal role in EMT. These findings underline the importance of translational reprogramming and fine-tuning of ribosome composition in EMT.

Keywords: EMT; RPL36A; ZEB1; ribosome; translation.


Conflict of interest statement

Competing interests statement:The authors declare no competing interest.

Figures
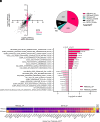
Fig. 1.
Fig. 1.
The translational landscape of ZEB1-induced mesenchymal cells is distinct from that of epithelial cells. (A and B) Ribosome profiling. Steady-state mRNA levels and ribosome-protected mRNAs were quantified by RNAseq and RIBOseq, respectively. Using decision tree based on log2 fold-changes (FC) between hMEC and hMEC-ZEB1 and adjusted P-values (SI Appendix, Fig. S2H), three main classes were identified for which log2(FC) RIBOseq and RNAseq data are plotted (A). These three classes had the following characteristics i) total and ribosome-associated levels vary concomitantly (“BOTH”, black); ii) total levels vary independently of ribosome-associated ones (“RNAseq”, green); and iii) ribosome-associated levels vary without change in their total levels (“RIBOseq”, pink). The number of dysregulated mRNA in each class is given (B). Mesenchymal hMEC-ZEB1 cells display a higher proportion of mRNAs regulated at the translational level than the transcriptional level. (C) Analysis of gene enrichment. Overrepresentation analysis was performed using “RIBOseq” mRNA lists compared to either hallmark or gene ontology (GO) annotations. The top 10 ranking terms from each list is shown in descending order of adjusted P-value. The “RIBO_UP” class is enriched in signatures related to epithelial–mesenchymal transition (EMT). (D) Dysregulated mRNAs of the Hallmark_EMT signature. Individual log2(FC) of RNAseq or RIBOseq data are shown for the mRNAs belonging to the Hallmark_EMT signature and are higher in hMEC-ZEB1 compared to hMEC at the transcriptional/translational levels (“BOTH_UP”) and at the translational level only (“RIBOseq_UP”).
Fig. 2.
Fig. 2.
Translational readthrough is higher in ZEB1-induced mesenchymal cells compared to mammary epithelial cells independently of any alteration in the tRNAome. (A) In cellulo stop codon readthrough assay. A transient transfection of stop codon readthrough reporter assay was performed to compare translational fidelity of hMEC overexpressing or not ZEB1. Data are shown as box plot (n = 6), and a Student t test was performed. A significant increase in the percentage of stop codon readthrough was observed in hMEC-ZEB1 compared to hMEC. (B) tRNAome. The repertoire of tRNAs was profiled by tRNAseq in epithelial and ZEB1-overexpressing cells. Data are shown as scatter plot (n = 3) and a Pearson’s correlation test was performed. No difference in isodecoders used for stop codon readthrough was observed between the two cell lines. Each differentially expressed tRNA is labeled.
Fig. 3.
Fig. 3.
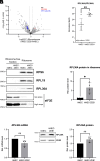
Ribosomes of ZEB1-induced mesenchymal hMEC display increased levels of RPL36A compared to epithelial hMEC. (A and B) Riboproteome. Purified ribosomal particles from hMEC and hMEC-ZEB1 cells were analyzed by mass spectrometry. Differential ratio between hMEC-ZEB1 and hMEC is presented as log2(FC) and −log10(adj. P-value) (A, n = 5). Peptide raw counts of RPL36A/RPL36AL are given, where each dot represents a biological replicate and the horizontal bar the median (B, n = 5). Compared to epithelial hMEC ribosomes, ZEB1-overexpressing mesenchymal ribosomes display decreased levels in 12 subunits of the eIF3 complex and increased levels of RPL36A. RP: ribosomal protein. (C and D) Validation of riboproteome. A representative western blot (C) and quantification (D) are shown on purified ribosomal particles and ribosome-free fraction from hMEC-ZEB1 and hMEC lines. RPS6 and RPL19 were used as loading control proteins from small and large ribosomal subunits, respectively. RPL36A levels were significantly higher in purified ribosomes of mesenchymal hMEC-ZEB1 than epithelial hMEC (D, n = 4). (EG) Expression of RPL36A. Compared to hMEC, hMEC-ZEB1 displayed similar levels of RPL36A at the mRNA (RT-qPCR, E, n = 3) and protein levels (F and G). A representative western blot is shown in (F) and quantification in (G, n = 3). Each dot represents a biological replicate (n = 3). Mann–Whitney t tests were performed. Ns: nonsignificant; *P < 0.05; **P < 0.01.
Fig. 4.
Fig. 4.
RPL36A overexpression promotes a switch in cell morphology. (A and B) Incorporation of overexpressed RPL36A in ribosomal particles. Using HEK293T expressing inducible FLAG-tagged RPL36A protein, composition of purified ribosome was assessed by western blot. A representative gel is shown in (A) and a quantification of protein levels in (B, n = 3). RPS6 and RPL19 were used as loading controls from small and large ribosomal subunits, respectively. FLAG-tagged RPL36A protein was significantly detected only in the doxycycline-induced cell line (1 µg/mL for 72 h). (C) Exogenous RPL36A mRNA levels. Overexpression of exogenous RPL36A was validated 25 d postinfection by RT-qPCR in three pairs of stable MCF10A-empty and -RPL36A cell lines (C2 to C4). Exogenous levels of RPL36A mRNA were detected in MCF10A-RPL36A cell lines compared to MCF10A-empty cell lines. (D) Cell morphology. Phase contrast images showing the morphology of pairs of constitutive MCF10A-empty and -RPL36A cell lines 25 d postinfection. While the MCF10A-empty cell lines conserved an epithelial morphology, the MCF10A overexpressing RPL36A cell lines displayed a fibroblast-like morphology. (Scale bar, 200 µm) (magnification ×10). Each dot represents a replicate (n = 3). Mann–Whitney (B) or paired t tests (C) were performed. *P < 0.05.
Fig. 5.
Fig. 5.
RPL36A overexpression promotes switch in cell dispersion. (A) Immunofluorescence staining. Representative immunofluorescence images stained for epithelial CDH1 (E-cadherin) and mesenchymal VIM (Vimentin) markers are shown for a single pair of constitutive MCF10A-empty and -RPL36A cell lines (clone C4, SI Appendix, Fig. S8 for data of 2 additional pairs of clones). Compared to MCF10A-empty cell line, MCF10A-RPL36A cell line exhibited a loss of CDH1 protein level and a higher level of VIM protein. (Scale bar, 100 µm.) (B and C) Cell dispersion. Cell dispersion was quantified using two geometric models: Voronoï diagram (B) and Delaunay triangulation (C). Representative images are shown in left panels and quantifications in right panels. MCF10A-RPL36A cells were significantly more dispersed than MCF10A-empty cells. Each dot represents a quantification. Paired t tests were performed. ****P < 0.0001.
Fig. 6.
Fig. 6.
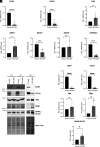
RPL36A overexpression promotes an EMT-related molecular switch. (AG) EMT-related mRNA levels. Levels of EMT markers (AC), EMT-TFs (DF), and miR200c (G) were compared between the three pairs of MCF10A-empty and -RPL36A cell lines by RT-qPCR 25 d postinfection. Compared to MCF10A-empty, constitutive overexpression of RPL36A significantly decreased mRNA levels of epithelial markers (A, B, and G), while it increased mRNA levels of the mesenchymal markers VIM and ZEB1 (C and D). (H and I) EMT-related protein levels. Levels of EMT markers and EMT-TFs were compared between the three pairs of MCF10A-empty and -RPL36A cell lines by western blot. A representative western blot for each pair of clones is shown in (H) and quantification is given in (I). As for mRNA levels, a decrease in epithelial markers and an increase in mesenchymal markers were observed in MCF10A-RPL36A cell lines compared to MCF10A-empty cells. Each dot represents a replicate (n = 4 to n = 7). Paired t tests were performed. Ns: nonsignificant; *P < 0.05; ***P < 0.001; ****P < 0.0001.
Fig. 7.
Fig. 7.
RPL36A overexpression promotes a switch in cell behavior. (A and B) Cell proliferation. Cell proliferation of MCF10A-empty and -RPL36A cell lines was monitored in real time. A representative profile of cell proliferation is shown in (A, mean ± SEM, n = 5) and relative slope index of each replicate is given in (B, mean ± SD, n = 10). Compared to control, RPL36A overexpression significantly reduced cell proliferation. (C and D) Cell invasion. Cell invasion of MCF10A-empty and -RPL36A cell lines was monitored in real time. A representative profile of cell invasion is shown in (C, mean ± SEM, n = 2), and relative slope index of each replicate is given in (D, mean ± SD, n = 5). Compared to control, RPL36A overexpression significantly increased cell invasion. Each dot represents a replicate. Paired t tests were performed. *P < 0.05; ****P < 0.0001.

References

    1. Nieto M. A., Huang R. Y. Y. J., Jackson R. A. A., Thiery J. P. P., EMT: 2016. Cell 166, 21–45 (2016). 10.1016/j.cell.2016.06.028. - DOI - PubMed
    1. Yang J., et al. , Guidelines and definitions for research on epithelial–mesenchymal transition. Nat. Rev. Mol. Cell Biol. 21, 341–352 (2020). 10.1038/s41580-020-0237-9. - DOI - PMC - PubMed
    1. Morin C., Moyret-Lalle C., Mertani H. C., Diaz J.-J., Marcel V., Heterogeneity and dynamic of EMT through the plasticity of ribosome and mRNA translation. Biochim. Biophys. Acta Rev. Cancer 1877, 188718 (2022). 10.1016/J.BBCAN.2022.188718. - DOI - PubMed
    1. Dongre A., Weinberg R. A., New insights into the mechanisms of epithelial–mesenchymal transition and implications for cancer. Nat. Rev. Mol. Cell Biol. 20, 69–84 (2019). 10.1038/s41580-018-0080-4. - DOI - PubMed
    1. Cano A., et al. , The transcription factor Snail controls epithelial–mesenchymal transitions by repressing E-cadherin expression. Nat. Cell Biol. 2, 76–83 (2000). 10.1038/35000025. - DOI - PubMed

MeSH terms

Substances

LinkOut - more resources