Comparative Study
. 2024 Dec 5;19(12):e0315014.
doi: 10.1371/journal.pone.0315014. eCollection 2024.

Gene expression signatures between Limia perugiae (Poeciliidae) populations from freshwater and hypersaline habitats, with comparisons to other teleosts

Affiliations
Comparative Study

Gene expression signatures between Limia perugiae (Poeciliidae) populations from freshwater and hypersaline habitats, with comparisons to other teleosts

Elizabeth J Wilson et al. PLoS One. .

Abstract

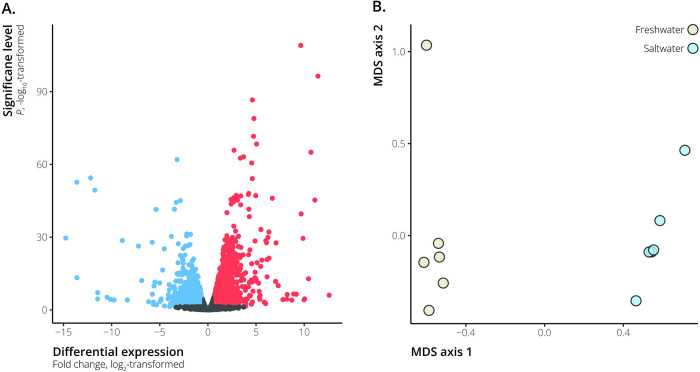
Salinity gradients act as strong environmental barriers that limit the distribution of aquatic organisms. Changes in gene expression associated with transitions between freshwater and saltwater environments can provide insights into organismal responses to variation in salinity. We used RNA-sequencing (RNA-seq) to investigate genome-wide variation in gene expression between a hypersaline population and a freshwater population of the livebearing fish species Limia perugiae (Poeciliidae). Our analyses of gill gene expression revealed potential molecular mechanisms underlying salinity tolerance in this species, including the enrichment of genes involved in ion transport, maintenance of chemical homeostasis, and cell signaling in the hypersaline population. We also found differences in gene expression patterns associated with cell-cycle and protein-folding processes between the hypersaline and freshwater L. perugiae. Bidirectional freshwater-saltwater transitions have occurred repeatedly during the diversification of fishes, allowing for broad-scale examination of repeatable patterns in evolution. Therefore, we compared transcriptomic variation in L. perugiae with other teleosts that have made freshwater-saltwater transitions to test for convergence in gene expression. Among the four distantly related population pairs from high- and low-salinity environments that we included in our analysis, we found only ten shared differentially expressed genes, indicating little evidence for convergence. However, we found that differentially expressed genes shared among three or more lineages were functionally enriched for ion transport and immune functioning. Overall, our results-in conjunction with other recent studies-suggest that different genes are involved in salinity transitions across disparate lineages of teleost fishes.


Conflict of interest statement

The authors have declared that no competing interests exist.

Figures

Fig 1
Fig 1. Differentially expressed genes and gene expression profiles of hypersaline and freshwater Limia perugiae.
A. Volcano plot depicting differentially expressed genes between hypersaline and freshwater Limia perugiae. Genes that were significantly differentially expressed between hypersaline and freshwater populations (FDR < 0.05) are indicated by the blue and red points—blue points represent genes downregulated in the hypersaline populations, while red points represent upregulated genes. B. Multi-dimensional scaling (MDS) plot of hypersaline and freshwater L. perugiae gene expression profiles. MDS axis 1 separated samples by freshwater vs. hypersaline environments.
Fig 2
Fig 2. Weighted gene co-expression network analysis.
A. Average linkage clustering tree based on topological overlap distances in gene expression patterns of L. perugiae from freshwater and saltwater habitats. Branches of the dendrogram correspond to modules, as shown in the color bars below. DC is an abbreviation for Dynamic Tree Cut; MD for Merged Dynamic. B. Correlation between module eigenvalues and habitat type (freshwater vs. saltwater). Each row corresponds to a module of coexpressed genes, and values are Pearson correlation coefficients (left column) and P-values (right column in parentheses). Color coloration scales with the correlation coefficient according to the scale bar to the right.
Fig 3
Fig 3. Gene expression profiles and shared differentially expressed genes across lineages.
A. Multi-dimensional scaling plot (MDS) of the general expression patterns of all the populations included in our analysis. B. Similarity of gene expression profiles of saltwater (SW) and freshwater (FW) populations across different lineages. The majority of variation in gene expression reflects phylogenetic divergence among lineages. C. Shared differentially expressed genes across lineages. The large, central number in each section represents the total number of shared differentially expressed genes among the lineages in that intersection. The top number in each section represents the number of shared up-regulated genes, and the bottom number is the number of shared down-regulated genes in that intersection. Only 10 genes were consistently differentially expressed between all of the SW and FW populations.
Fig 4
Fig 4. Examples of expression variation in shared differentially expressed genes.
Nine of the ten shared differentially expressed genes have annotations, and those genes are included here. Magnitude and direction of differential expression is lineage specific.

Similar articles

References

    1. Davis AM, Unmack PJ, Pusey BJ, Johnson JB, Pearson RG. Marine-freshwater transitions are associated with the evolution of dietary diversification in terapontid grunters (Teleostei: Terapontidae). J Evol Biol. 2012;25: 1163–1179. doi: 10.1111/j.1420-9101.2012.02504.x - DOI - PubMed
    1. Lee CE, Bell MA. Causes and consequences of recent freshwater invasions by saltwater animals. Trends Ecol Evol. 1999;14: 284–288. doi: 10.1016/S0169-5347(99)01596-7 - DOI - PubMed
    1. Corush JB. Evolutionary patterns of diadromy in fishes: more than a transitional state between marine and freshwater. BMC Evol Biol. 2019;19: 168. doi: 10.1186/s12862-019-1492-2 - DOI - PMC - PubMed
    1. Lee CE, Remfert JL, Gelembiuk GW. Evolution of physiological tolerance and performance during freshwater invasions. Integr Comp Biol. 2003;43: 439–449. doi: 10.1093/icb/43.3.439 - DOI - PubMed
    1. Whitehead A, Roach JL, Zhang S, Galvez F. Genomic mechanisms of evolved physiological plasticity in killifish distributed along an environmental salinity gradient. Proc Natl Acad Sci U S A. 2011;108: 6193–6198. doi: 10.1073/pnas.1017542108 - DOI - PMC - PubMed

Publication types

MeSH terms

LinkOut - more resources