. 2024 Dec 5;20(12):e1011502.
doi: 10.1371/journal.pgen.1011502. eCollection 2024 Dec.

Functional investigation suggests CNTNAP5 involvement in glaucomatous neurodegeneration obtained from a GWAS in primary angle closure glaucoma

Affiliations

Functional investigation suggests CNTNAP5 involvement in glaucomatous neurodegeneration obtained from a GWAS in primary angle closure glaucoma

Sudipta Chakraborty et al. PLoS Genet. .

Abstract

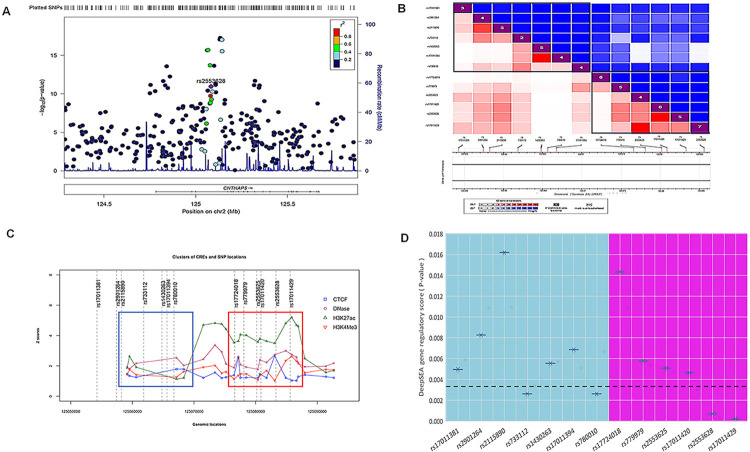
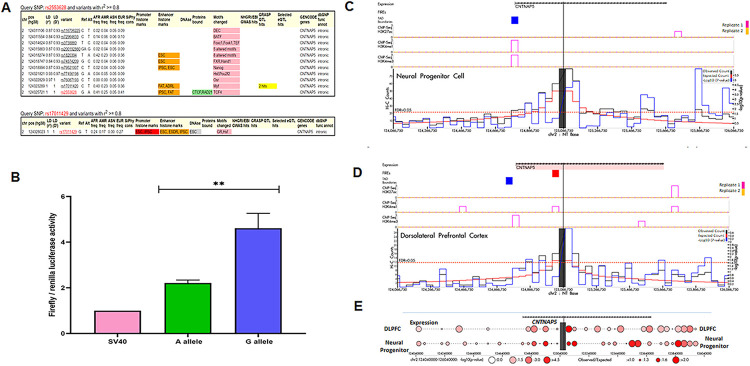
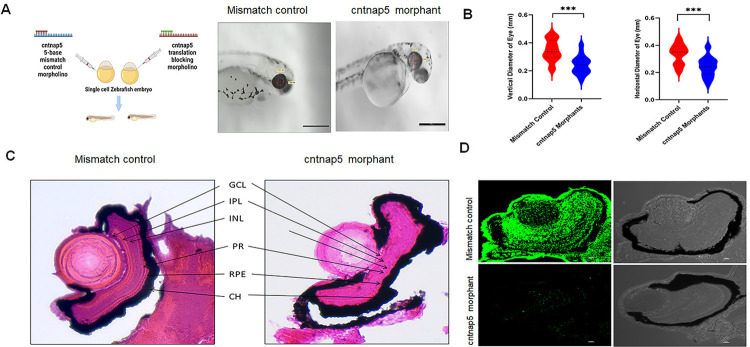
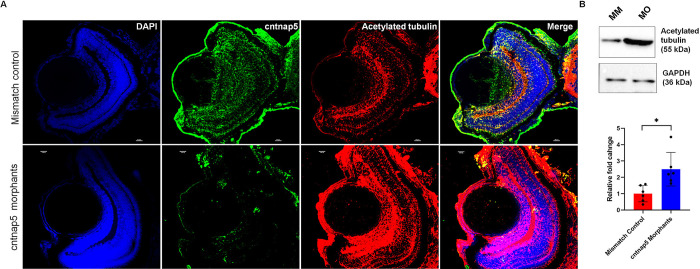
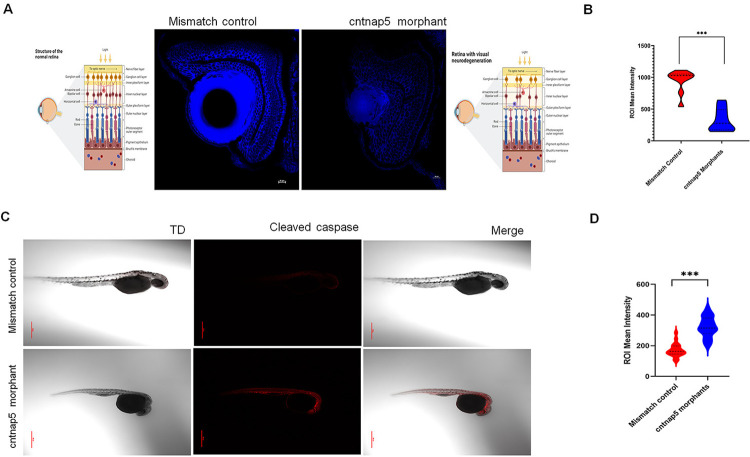
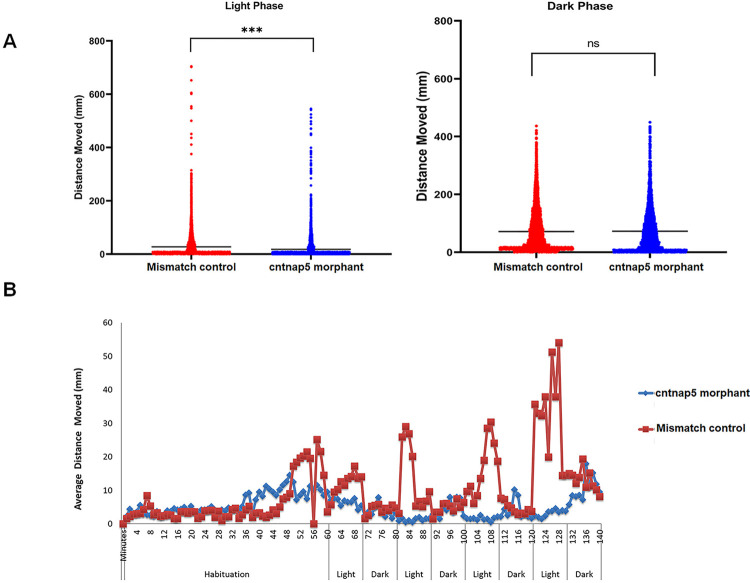
Primary angle closure glaucoma (PACG) affects more than 20 million people worldwide, with an increased prevalence in south-east Asia. In a prior haplotype-based Genome Wide Association Study (GWAS), we identified a novel CNTNAP5 genic region, significantly associated with PACG. In the current study, we have extended our perception of CNTNAP5 involvement in glaucomatous neurodegeneration in a zebrafish model, through investigating phenotypic consequences pertinent to retinal degeneration upon knockdown of cntnap5 by translation-blocking morpholinos. While cntnap5 knockdown was successfully validated using an antibody, immunofluorescence followed by western blot analyses in cntnap5-morphant (MO) zebrafish revealed increased expression of acetylated tubulin indicative of perturbed cytoarchitecture of retinal layers. Moreover, significant loss of Nissl substance is observed in the neuro-retinal layers of cntnap5-MO zebrafish eye, indicating neurodegeneration. Additionally, in spontaneous movement behavioural analysis, cntnap5-MO zebrafish have a significantly lower average distance traversed in light phase compared to mismatch-controls, whereas no significant difference was observed in the dark phase, corroborating with vision loss in the cntnap5-MO zebrafish. This study provides the first direct functional evidence of a putative role of CNTNAP5 in visual neurodegeneration.


Conflict of interest statement

The authors have declared that no competing interests exist.

Figures

Fig 1
Fig 1
A. Regional Association Plot indicating the statistical strength of association among associated genomic region of CNTNAP5 gene with PACG after performing conditional analysis B. Bokeh plot shows the pairwise linkage disequilibrium between the 13 variants around the region of CNTNAP5 in two LD blocks C. CREs and SNPs plotted along with their genomic and epigenomic features of 13 SNPs of CNTNAP5. Based on the features, blue and red boxes are shown that roughly highlight SNP and CRE clusters. The elements and variants belonging to the red box show better likelihood for having functional relevance. D. The Whisker plot shows the DeepSEA gene regulatory score (P-value) of 13 SNPs of CNTNAP5. The plot includes a Bonferroni-corrected significance threshold line at 0.0038, indicating the adjusted significance level after correcting for multiple testing. SNPs below this threshold are considered statistically significant. Based on the features, blue (Cluster I) and pink (Cluster II) boxes are shown, representing different DeepSEA gene regulatory scores (P-values). The elements and variants belonging to the pink square have a better likelihood of having gene regulation potential.
Fig 2
Fig 2
A. Variant detailed view of rs2553658 and rs17011429 in HaploReg. The regulatory motif TCF4 altered in reference and alternative allele of rs2553658. B. The data was drawn for a total of 3 biological replicates considering triplicate technical replicates for each biological experiments representing three different plasmid preparations (pGL3 SV40 minimal promoter vector) transfected in to HEK293T cells grown in 24-well plates. The height of the bar shows the mean value of all the 3 experiments, while error bars are depicting SE. The 4C plot of genomic region of CNTNAP5 (chr2:125,083,095–125,084,384) showing the FIREs, ChIP-Seq data and Hi-C counts in DPLC (C) and NPC (D) from HUGIn. The ratio of observed read counts to expected read counts is higher in NPC and is also statistically more significant than in DPLC (E).
Fig 3
Fig 3
A. Morpholino knockdown of cntnap5a and 5b, left cartoon is created with BioRender.com licensed version. Zebrafish were microinjected with a cntnap5 translation blocking morpholinos. Images taken 96 hpf, eye of a mismatch morphant (left) and an eye cntnap5 morpholino injected zebrafish (right) showing smaller anatomical eye than mismatch control. B. Quantitative gross anatomical diameters along both the nasal-temporal axis (horizontal) and dorsal-ventral axis (vertical) of eyes measured from cntnap5 translation-blocking morpholino injected embryos and mismatch morpholino controls zebrafish at 96 hours post fertilization stage. bars = mean ± SD, ns not significant, ***p < 0.005. C. Histological analysis of zebrafish eye microinjected with mismatch morpholino (left) a cntnap5 translation blocking morpholino (right) using H&E stain at 96 hpf stage showing disrupted retinal layers in cntnap5 morphant. GCL, ganglion cell layer; IPL, inner plexiform layer; INL, inner nuclear layer; PR, photoreceptor layer; RPE, retinal pigment epithelium; CH indicates choroid. D. Representative IF image of tissues stained with anti-cntnap5 showing cntnap5 expression in mismatch morphant (upper left; lower Transmitted Light Differential Interference Contrast (TD) image) but no expression in a cntnap5 translation blocking morphants (lower left: right: TD image).
Fig 4
Fig 4
A. Cntnap5 and Acetylated Tubulin Expression in Zebrafish Eye Tissue (96 hpf): Representative confocal images of cntnap5 and acetylated tubulin expression of eye tissues from mismatch control fish (upper) and cntnap5 morphant (lower) zebrafish at 96 hpf (blue- DAPI, green- cntnap5, red- acetylated tubulin, and merged). B. Acetylated Alpha Tubulin Levels (Whole Embryo) (72 hpf): Western blot image of acetylated tubulin expression of whole zebrafish tissue lysate (72 hpf). MO: cntnap5 morpholino injected fish MM: mismatch control morpholino injected fish. A two-sided t-test. bars = mean ± SD, ns not significant, *p < 0.05.
Fig 5
Fig 5
A. Representative eye tissue images of Nissl granules expression of zebrafish embryos (96 hpf) injected with a mismatch control (left) and cntnap5 morpholino (right). Corresponding cartoons are created using BioRender.com licensed version. B. Comparative analysis of eye mean intensity of eye for both groups. bars = mean ± SE, ns not significant, ***p < 0.005. C. Representative whole mount confocal images of cleaved expression of zebrafish embryos (32 hpf) injected with cntnap5 morpholino (upper) or mismatch control (lower) D. Comparative analysis of mean intensity of eye for the both groups, bars = mean ± SE, ns not significant, ***p < 0.005.
Fig 6
Fig 6. Locomotory movement analysis of zebrafish.
A. Total distance moved (mm) of 96 hpf cntnap5 morpholino injected zebrafish (blue circles) and 96 hpf cntnap5 mismatch control (red circles) zebrafish for the light (left image) and light off (right image) periods. Left image, (light on) p  =  <0.0001, two-sided Mann–Whitney test, n  =  24 cntnap5 morpholino injected zebrafish and n = 24 cntnap5 mismatch control, Right image (light off), p  =  0.5767, bars = mean ± SEM ns not significant, ****p < 0.0001. B. Average distance moved (mm) of 96 hpf cntnap5 morpholino injected zebrafish (blue circles) and 5dpf cntnap5 mismatch control (red circles) zebrafish exposed to four cycles of 10 min light on and 10 min light off after 60-minutes habituation period. Each point represents 1 min, n  =  24 cntnap5 mismatch control zebrafish and n  =  24 cntnap5 morpholino injected zebrafish.

References

    1. Quigley HA, Broman AT. The number of people with glaucoma worldwide in 2010 and 2020. Br J Ophthalmol. 2006;90: 262–267. doi: 10.1136/bjo.2005.081224 - DOI - PMC - PubMed
    1. Weinreb RN, Aung T, Medeiros FA. The pathophysiology and treatment of glaucoma: a review. JAMA. 2014;311: 1901–1911. doi: 10.1001/jama.2014.3192 - DOI - PMC - PubMed
    1. Chakraborty S, Sharma A, Bagchi I, Pal S, Bhattacharyya C, Gupta V, et al.. A genomewide association study on individuals with occludable angles identifies potential risk loci for intraocular pressure. J Genet. 2021;100: 69. doi: 10.1007/s12041-021-01321-2 - DOI - PubMed
    1. Carelli V, La Morgia C, Ross-Cisneros FN, Sadun AA. Optic neuropathies: the tip of the neurodegeneration iceberg. Hum Mol Genet. 2017;26: R139–R150. doi: 10.1093/hmg/ddx273 - DOI - PMC - PubMed
    1. Lowe RF. Aetiology of the anatomical basis for primary angle-closure glaucoma. Biometrical comparisons between normal eyes and eyes with primary angle-closure glaucoma. Br J Ophthalmol. 1970;54: 161–169. doi: 10.1136/bjo.54.3.161 - DOI - PMC - PubMed

LinkOut - more resources