. 2024 Dec 11;4(12):100722.
doi: 10.1016/j.xgen.2024.100722. Epub 2024 Dec 4.

Characterizing the genetic architecture of drug response using gene-context interaction methods

Affiliations

Characterizing the genetic architecture of drug response using gene-context interaction methods

Michal Sadowski et al. Cell Genom. .

Abstract

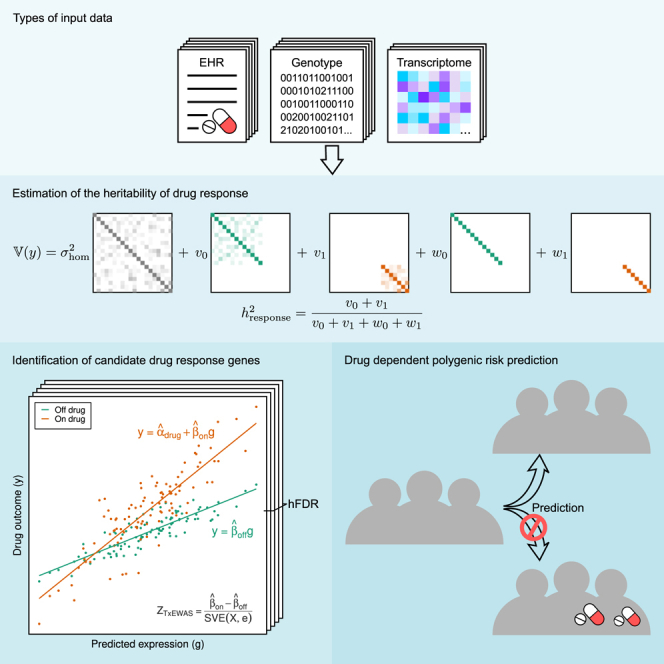
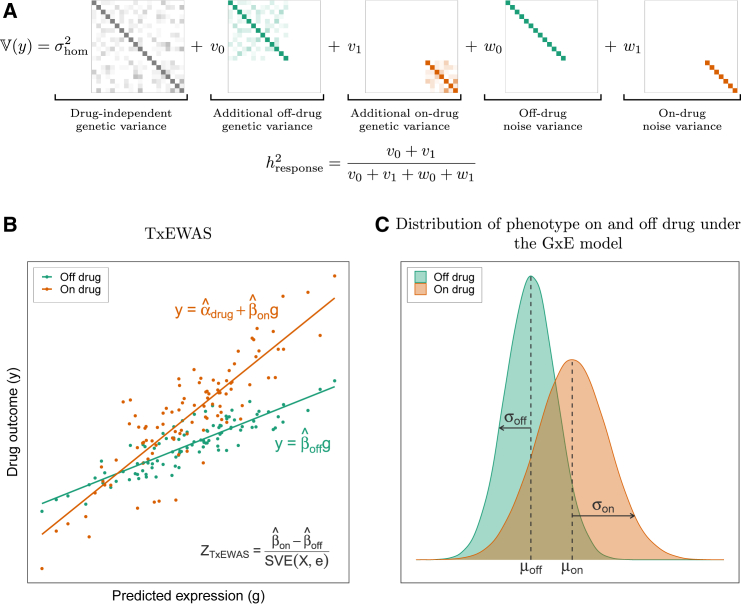
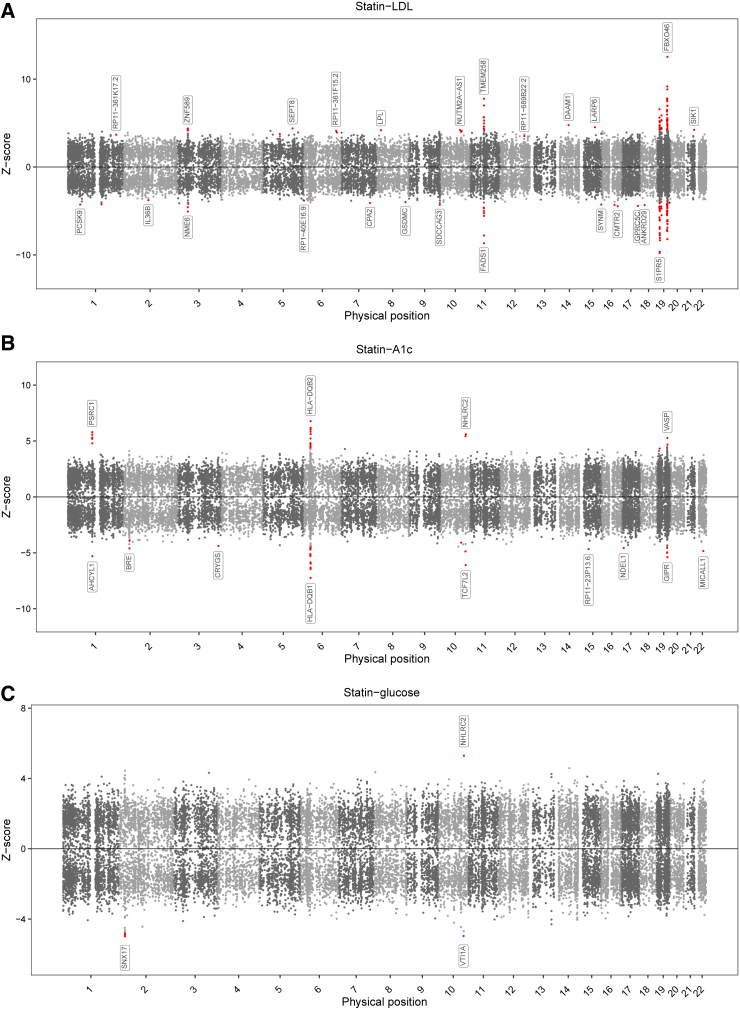
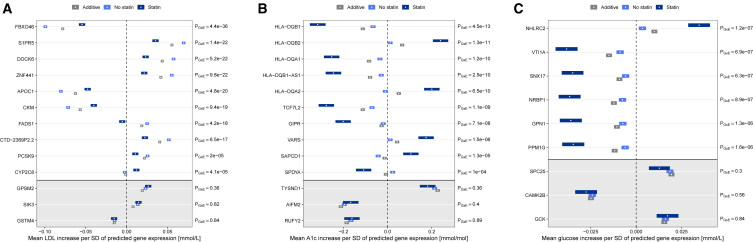
Identifying factors that affect treatment response is a central objective of clinical research, yet the role of common genetic variation remains largely unknown. Here, we develop a framework to study the genetic architecture of response to commonly prescribed drugs in large biobanks. We quantify treatment response heritability for statins, metformin, warfarin, and methotrexate in the UK Biobank. We find that genetic variation modifies the primary effect of statins on LDL cholesterol (9% heritable) as well as their side effects on hemoglobin A1c and blood glucose (10% and 11% heritable, respectively). We identify dozens of genes that modify drug response, which we replicate in a retrospective pharmacogenomic study. Finally, we find that polygenic score (PGS) accuracy varies up to 2-fold depending on treatment status, showing that standard PGSs are likely to underperform in clinical contexts.

Keywords: gene-environment interactions; genetic heterogeneity; genetic testing; heritability; heteroskedasticity; personalized medicine; pharmacogenomics.


Conflict of interest statement

Declaration of interests The authors declare no competing interests.

Figures

None
Graphical abstract
Figure 1
Figure 1
Schematic of the GxE framework to analyze treatment response in cross-sectional data (A) We use GxEMM to estimate the heritability of treatment response (hresponse2) based on the genetic (v) and nongenetic (w) variances specific to treatment status (STAR Methods). (B) We identify genes that modify treatment response using TxEWAS, a new method to estimate gene-level GxE interaction. TxEWAS genetically imputes gene expression and tests if this gene’s effect interacts with some “E.” (C) Statistical interactions with treatment status induce treatment-dependent heteroscedasticity that must be modeled in GxEMM and TxEWAS.
Figure 2
Figure 2
Manhattan plots of gene-statin interactions for low-density lipoprotein cholesterol and for hemoglobin A1c and blood glucose (A) Manhattan plot of gene-statin interaction effects for LDL cholesterol (primary effect). Each point represents a single gene, with physical position plotted on the x axis and standardized effect size plotted on the y axis. The most extreme effect across tissues is shown for each gene. Significant associations are highlighted in red, and the strongest associations on each chromosome are labeled. (B and C) Same as (A), but for A1c and blood glucose (side effects).
Figure 3
Figure 3
Gene-statin interaction effect sizes for low-density lipoprotein cholesterol, hemoglobin A1c, and blood glucose (A) Estimated effect sizes of selected genes on LDL cholesterol in statin users and non-users and from a standard additive model. Color boxes depict standard errors around effect size estimates. Reported p values P{GxE} are for the gene-statin interaction effects. The top 10 genes have significant interaction effects; for comparison, the bottom three genes are only additively significant. (B and C) Same as (A), but for A1c and blood glucose. See also Figures S5 and S7.

Similar articles

Cited by

References

    1. Exner D.V., Dries D.L., Domanski M.J., Cohn J.N. Lesser Response to Angiotensin-Converting–Enzyme Inhibitor Therapy in Black as Compared with White Patients with Left Ventricular Dysfunction. N. Engl. J. Med. 2001;344:1351–1357. doi: 10.1056/NEJM200105033441802. - DOI - PubMed
    1. Mega J.L., Simon T., Collet J.-P., Anderson J.L., Antman E.M., Bliden K., Cannon C.P., Danchin N., Giusti B., Gurbel P., et al. Reduced-Function CYP2C19 Genotype and Risk of Adverse Clinical Outcomes Among Patients Treated With Clopidogrel Predominantly for PCI: A Meta-analysis. JAMA. 2010;304:1821–1830. doi: 10.1001/jama.2010.1543. - DOI - PMC - PubMed
    1. Riaz N., Havel J.J., Kendall S.M., Makarov V., Walsh L.A., Desrichard A., Weinhold N., Chan T.A. Recurrent SERPINB3 and SERPINB4 mutations in patients who respond to anti-CTLA4 immunotherapy. Nat. Genet. 2016;48:1327–1329. doi: 10.1038/ng.3677. - DOI - PMC - PubMed
    1. Pirmohamed M. Personalized Pharmacogenomics: Predicting Efficacy and Adverse Drug Reactions. Annu. Rev. Genom. Hum. Genet. 2014;15:349–370. doi: 10.1146/annurev-genom-090413-025419. - DOI - PubMed
    1. Spear B.B., Heath-Chiozzi M., Huff J. Clinical application of pharmacogenetics. Trends Mol. Med. 2001;7:201–204. doi: 10.1016/S1471-4914(01)01986-4. - DOI - PubMed

MeSH terms