. 2025 Apr 14;35(4):653-670.
doi: 10.1101/gr.279041.124.

Rearrangements of viral and human genomes at human papillomavirus integration events and their allele-specific impacts on cancer genome regulation

Affiliations

Rearrangements of viral and human genomes at human papillomavirus integration events and their allele-specific impacts on cancer genome regulation

Vanessa L Porter et al. Genome Res. .

Abstract

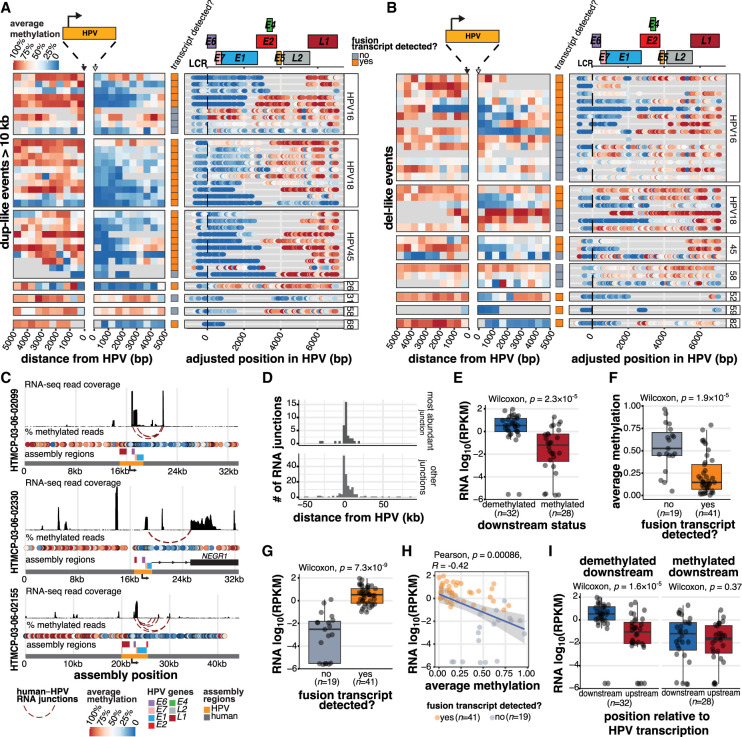
Human papillomavirus (HPV) integration has been implicated in transforming HPV infection into cancer. To resolve genome dysregulation associated with HPV integration, we performed Oxford Nanopore Technologies long-read sequencing on 72 cervical cancer genomes from a Ugandan data set that was previously characterized using short-read sequencing. We find recurrent structural rearrangement patterns at HPV integration events, which we categorize as del(etion)-like, dup(lication)-like, translocation, multi-breakpoint, or repeat region integrations. Integrations involving amplified HPV-human concatemers, particularly multi-breakpoint events, frequently harbor heterogeneous forms and copy numbers of the viral genome. Transcriptionally active integrants are characterized by unmethylated regions in both the viral and human genomes downstream from the viral transcription start site, resulting in HPV-human fusion transcripts. In contrast, integrants without evidence of expression lack consistent methylation patterns. Furthermore, whereas transcriptional dysregulation is limited to genes within 200 kb of an HPV integrant, dysregulation of the human epigenome in the form of allelic differentially methylated regions affects megabase expanses of the genome, irrespective of the integrant's transcriptional status. By elucidating the structural, epigenetic, and allele-specific impacts of HPV integration, we provide insight into the role of integrated HPV in cervical cancer.


Figures

Figure 1.
Figure 1.
Detection and categorization of HPV integration events in cervical cancers. (A) The number of HPV integration events detected in the DNA (# of events) and detected in DNA and RNA (# of expressed events) across the HTMCP samples, as well as clinical and molecular characteristics. (B) Schematic illustrations of integration event categories. Orange segments indicate the insertion of HPV integrants. (C) Decision chart for categorizing HPV integration events (“bps” = breakpoints). (D) The frequency of the HPV integration categories across the samples. The percentage of events that produce an HPV–human fusion transcript is indicated for each integration type. (E) The percentage of events belonging to each integration category for HPV16, HPV18, HPV45, and all other HPV types. (F) The genomic locations of integration events across the cohort, colored by the transcriptional status of the event. Bins with 2+ integration events are highlighted with boxes. Notable cancer genes within bins recurrently affected by integration are indicated. (G) Gene expression differences between samples with HPV integration within 1 Mb of MYC, TP63, and KLF5 compared to the remaining samples in the data set. Box plots represent the median and upper and lower quartiles of the distribution; whiskers represent the limits of the distribution (1.5 IQR below Q1 or 1.5 IQR above Q3). P-values were calculated using the Wilcoxon rank-sum test.
Figure 2.
Figure 2.
Heterologous structures of the HPV genome before and after integration. (A) Schematic of possible HPV integrant structures. The spirals in structures A–E show the portion(s) of the HPV genome that could be contained within an integrant. (B) Schematic showing how several heterologous integrants can exist between a single breakpoint pair, with the size of the integrant varying by n HPV copies. The colors correspond to the regions of the HPV genome as depicted in A. (C) The number of integrant structures between all identified breakpoint pairs within the cohort. Integrants with 2+ identified structures were classified as heterologous. (D) The sizes of the HPV integrants in a multi-breakpoint event with schematics depicting the various integrant structures detected. The HPV genome, in this case, was broken into two segments A and B, and the A segment was further broken into three segments (A.1, A.2, and A.3). These segments were variably rearranged into new structures across the breakpoint pairs. Each point represents the size of an HPV integrant contained on an individual read, which is then grouped together by color (e.g., blue, red, green, light blue) if they do not differ in size by more than 300 bp. Each color in a breakpoint pair thus represents one unique integrant structure, as indicated in the accompanying schematics. (E) The lengths of HPV-aligned reads in four predominantly episomal samples. The existence of HPV episomes and episome concatemers is supported by the accumulation of read counts in bin sizes corresponding to one or more HPV genome copies, as indicated by the dotted lines. (F) Frequency of heterologous integrants in the different integration categories. Only categories harboring heterologous integrants are shown. (G) The percentage of integrants from different HPV types that form single or heterologous structures. (H) The maximum size of the integrant structure in each breakpoint pair in HPV16 and HPV18 integrants, represented as the number of HPV genome copies. (I) Distribution showing the maximum number of HPV copies found in the longest spanning read for each incomplete integrant. The x-axis shows the length of the longest spanning read. Box plots represent the median and upper and lower quartiles of the distribution; whiskers represent the limits of the distribution (1.5 IQR below Q1 or 1.5 IQR above Q3). P-values were calculated using the Wilcoxon rank-sum test and the Fisher's exact test, as indicated in the figure.
Figure 3.
Figure 3.
The characteristics of two-breakpoint events and potential ecDNAs. (A) Examples of read coverage patterns from a del-like event, a dup-like event, and a potential ecDNA dup-like event. Orange lines indicate the integration breakpoints. (B) Circular assemblies from three potential ecDNA integration events. The orange portions show the integrated HPV segment, including the viral genes. The direction of HPV gene transcription is shown by a black arrow. The right-most example depicts a complex event in which three nonadjacent human segments have been combined in the potential ecDNA. (C) The size distribution of potential HPV–human hybrid ecDNAs (n = 8). (D) The genomic distance between breakpoints in del-like versus dup-like events. Box plots represent the median and upper and lower quartiles of the distribution; whiskers represent the limits of the distribution (1.5 IQR below Q1 or 1.5 IQR above Q3). (E) The percentage of events occurring in genic (>90% within a gene), intergenic (<10% within a gene), and partially genic (10%–90% within a gene) regions, plotted by integration category. The P-value in D was calculated using a Wilcoxon ranked-sum test. The P-value in E was calculated using a Fisher's exact test.
Figure 4.
Figure 4.
Complex structural variation is associated with multi-breakpoint integrations. (A) The number of human–HPV and human–human SV breakpoints across multi-breakpoint integration events, and the HPV type and clade in each. (B) The number of breakpoints per event in transcribed and nontranscribed multi-breakpoint events. Box plots represent the median and upper and lower quartiles of the distribution; whiskers represent the limits of the distribution (1.5 IQR below Q1 or 1.5 IQR above Q3). (C) Spearman's correlation between the number of HPV–human breakpoints and the number of human–human SV breakpoints in multi-breakpoint events. (D) Examples illustrating the connectivity between HPV breakpoint pairs in five multi-breakpoint events: three from the MYC-associated locus on Chromosome 8 and the two most rearranged multi-chromosomal events. Dots denote HPV breakpoints along the event, and dotted lines represent the HPV integrants that connect the breakpoints. The dots are colored according to the number of connections that converge at that position in the event. The integrants are colored according to whether single (orange) or heterologous (blue) integrant structures connect the breakpoints. (E) An example breaking down the copy number changes and the proposed structure of an event overlapping MYC. Each color represents a genomic segment on Chromosome 8 in between two human–HPV breakpoints. P-values in B and C were calculated using the Wilcoxon rank-sum test and Spearman's correlation test.
Figure 5.
Figure 5.
The production of HPV fusion transcripts correlates with distinct methylation patterns adjacent to and within the HPV integrant. (A,B) The proportion of HPV-containing reads showing methylation at positions within and adjacent to HPV integrants in (A) dup-like events (amplified region >10 kb) and (B) del-like events. The regions 5 kb upstream of and downstream from (relative to the direction of HPV transcription) are divided into 500 bp bins, and the average methylation frequency for all the CpGs within each bin is shown. Within HPV, the methylation of each CpG bin is shown as a colored dot. The transcriptional status is also indicated for each event (row). All the events are aligned to the start of the genic region (E6 start) for each respective HPV type. The gene model for HPV16 is shown above for general reference. (C) The assemblies of three representative HPV integration events, including their human and HPV gene positions, RNA-seq coverage, and HPV–human fusion junctions. (D) The position of HPV–human RNA fusion points relative to the nearest DNA HPV breakpoint, oriented by the strand of the HPV integrant. The most abundantly expressed junctions (n = 36) are contrasted with all other identified junctions (n = 163). (E) The normalized expression (RPKM) within the 5 kb region downstream from the HPV integrant, stratified by the downstream methylation status. (F) The average downstream methylation (0 to 2500 bp), stratified by HPV transcription status. (G) The normalized expression in reads per kilobase per million (RPKM) within the 5 kb region downstream from the HPV integrant, stratified by the HPV transcription status. (H) Pearson's correlation between downstream methylation and expression in transcribed and nontranscribed events. (I) The difference in the expression (RPKM) upstream of and downstream from (±5 kb) the HPV integrant in events stratified by the downstream methylation status. In all cases, box plots represent the median and upper and lower quartiles of the distribution; whiskers represent the limits of the distribution (1.5 IQR below Q1 or 1.5 IQR above Q3). P-values were calculated using the Wilcoxon rank-sum test and Pearson's correlation, as indicated in the figures. The data points in E–I and the accompanying statistics are from the dup-like and del-like events shown in A and B.
Figure 6.
Figure 6.
HPV integration is associated with dysregulation of the methylome and nearby genes on the integrated haplotype. (A) The distribution of DMRs across 10 Mb on either side of HPV integrations in the 33 events that overlapped a DMR hotspot. Each tick represents a DMR. Some event loci were situated <10 Mb from the end of the chromosome or from an unmappable region, resulting in a gap in DMRs before the end of the window (#7, 8, 12, 15, 19, 20, 23, 25, 26, and 29). (B) The direction of methylation changes in the HPV-containing haplotype with respect to the unintegrated haplotype within the phase block containing HPV integration. Adjacent phase blocks are shown as flanking gray bars. Events are ordered identically in A and B. The color of event numbers (center column) indicates the transcriptional status of the event. Events within the red (bottom) and blue (top) boxes show significant DMR enrichment (P adj < 0.05) either unidirectionally (blue box) or bidirectionally (red box) relative to the HPV integration event, as determined by a permutation test of the 500 kb bins flanking the event. (C) The significance of the association between HPV integration and high DMR density at all 147 HPV-integrated regions, using window sizes of 100,000 bp, 500,000 bp, 1,000,000 bp, 2,000,000 bp, and 5,000,000 bp around HPV. (D) The fold change and allele-specific expression (ASE) status of outlier genes (1.5 IQR below Q1 or 1.5 IQR above Q3) within 1 Mb of integration events. The log2 fold change (log2FC) of the integrated sample is relative to the median of the cohort. (E) The position of genes with outlier expression (1.5 IQR below Q1 or 1.5 IQR above Q3) relative to sites of HPV integration. Color indicates expression fold change in the integrated sample relative to the median of the cohort. The ASE status, integration event type, and transcriptional status of the event are also indicated. (F) The difference in gene expression fold change (integrated sample/median) at transcribed (yes) and nontranscribed (no) integration events. All box plots represent the median and upper and lower quartiles of the distribution; whiskers represent the limits of the distribution (1.5 IQR below Q1 or 1.5 IQR above Q3). Adjusted P-values in F were calculated using Benjamini–Hochberg-corrected Wilcoxon rank-sum tests. (G) Integrative Genomics Viewer snapshots showing wide (top) and zoomed (bottom) views of the haplotype-specific methylation changes around NR4A3 and HPV integration in HTMCP-03-06-02428 (#31), with reads separated into the two haplotypes (HP1 and HP2). The sample's DMRs, phase blocks, and HPV integration breakpoints are also indicated in the top three tracks. Reads are colored by CpG methylation status, with red indicating methylated and blue indicating unmethylated.

Update of

References

    1. Adey A, Burton JN, Kitzman JO, Hiatt JB, Lewis AP, Martin BK, Qiu R, Lee C, Shendure J. 2013. The haplotype-resolved genome and epigenome of the aneuploid HeLa cancer cell line. Nature 500: 207–211. 10.1038/nature12064 - DOI - PMC - PubMed
    1. Akagi K, Li J, Broutian TR, Padilla-Nash H, Xiao W, Jiang B, Rocco JW, Teknos TN, Kumar B, Wangsa D, et al. 2014. Genome-wide analysis of HPV integration in human cancers reveals recurrent, focal genomic instability. Genome Res 24: 185–199. 10.1101/gr.164806.113 - DOI - PMC - PubMed
    1. Akagi K, Symer DE, Mahmoud M, Jiang B, Goodwin S, Wangsa D, Li Z, Xiao W, Dunn JD, Ried T, et al. 2023. Intratumoral heterogeneity and clonal evolution induced by HPV integration. Cancer Discov 13: 910–927. 10.1158/2159-8290.CD-22-0900 - DOI - PMC - PubMed
    1. Akbari V, Garant J-M, O'Neill K, Pandoh P, Moore R, Marra MA, Hirst M, Jones SJM. 2021. Megabase-scale methylation phasing using nanopore long reads and NanoMethPhase. Genome Biol 22: 68. 10.1186/s13059-021-02283-5 - DOI - PMC - PubMed
    1. Blazkova J, Trejbalova K, Gondois-Rey F, Halfon P, Philibert P, Guiguen A, Verdin E, Olive D, Van Lint C, Hejnar J, et al. 2009. Cpg methylation controls reactivation of HIV from latency. PLoS Pathog 5: e1000554. 10.1371/journal.ppat.1000554 - DOI - PMC - PubMed

LinkOut - more resources