. 2024 Dec 5;15(1):10603.
doi: 10.1038/s41467-024-55004-4.

The Greatwall-Endosulfine-PP2A/B55 pathway regulates entry into quiescence by enhancing translation of Elongator-tunable transcripts

Affiliations

The Greatwall-Endosulfine-PP2A/B55 pathway regulates entry into quiescence by enhancing translation of Elongator-tunable transcripts

Javier Encinar Del Dedo et al. Nat Commun. .

Abstract

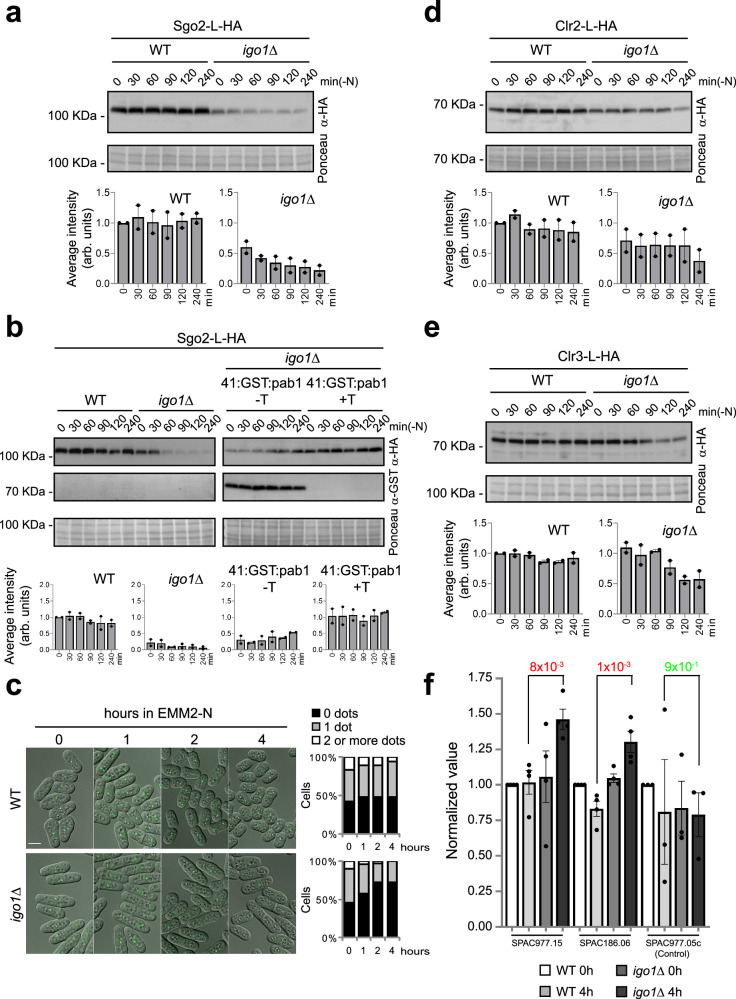
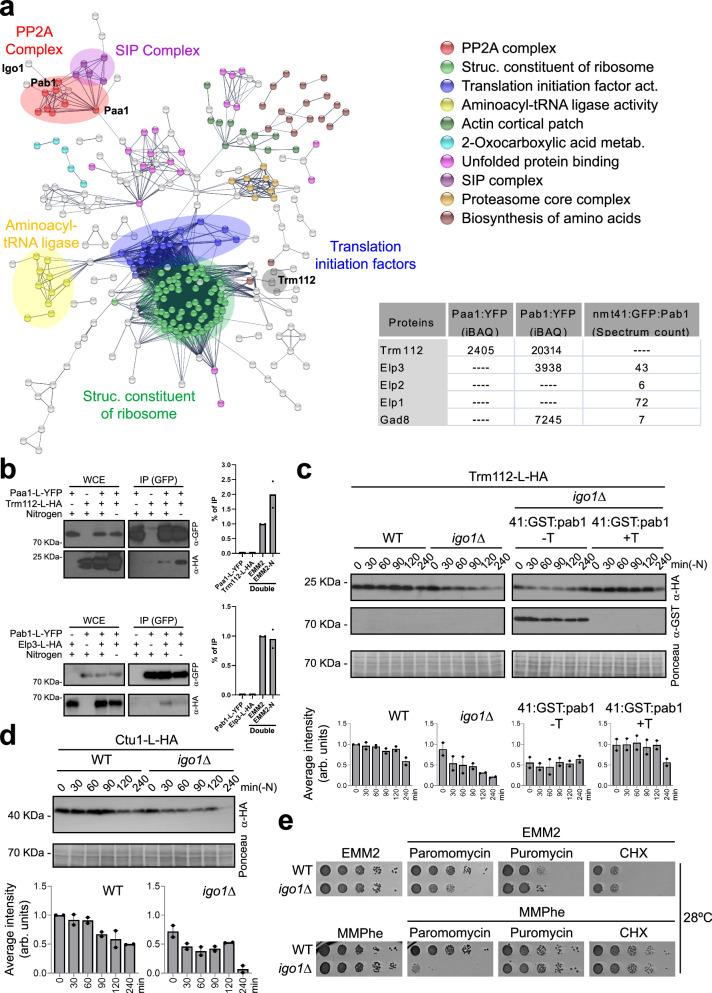
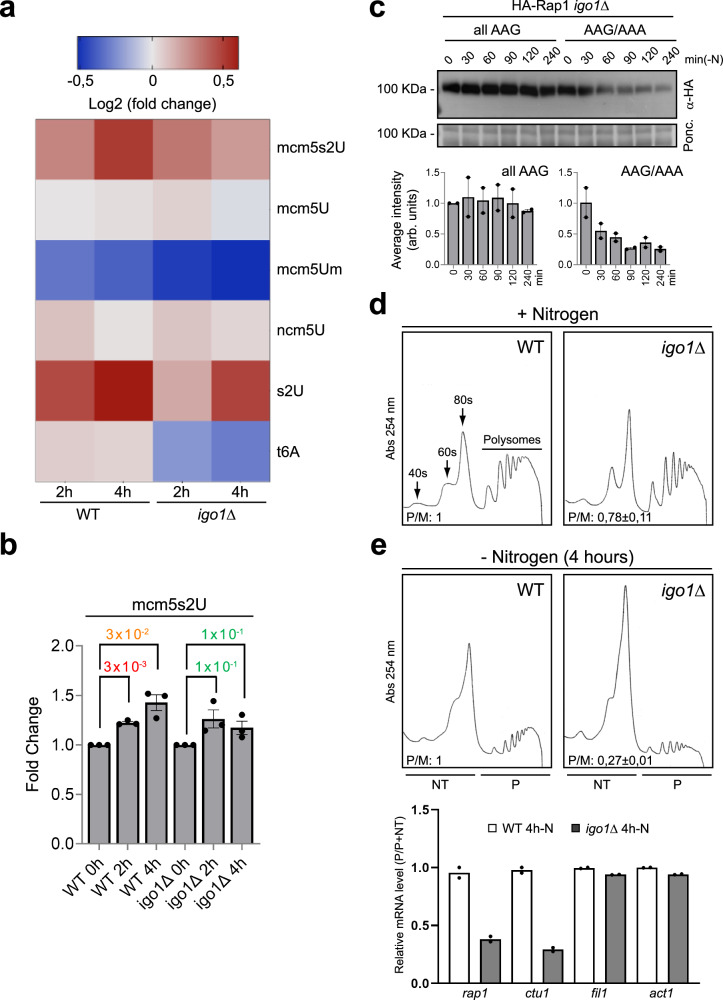
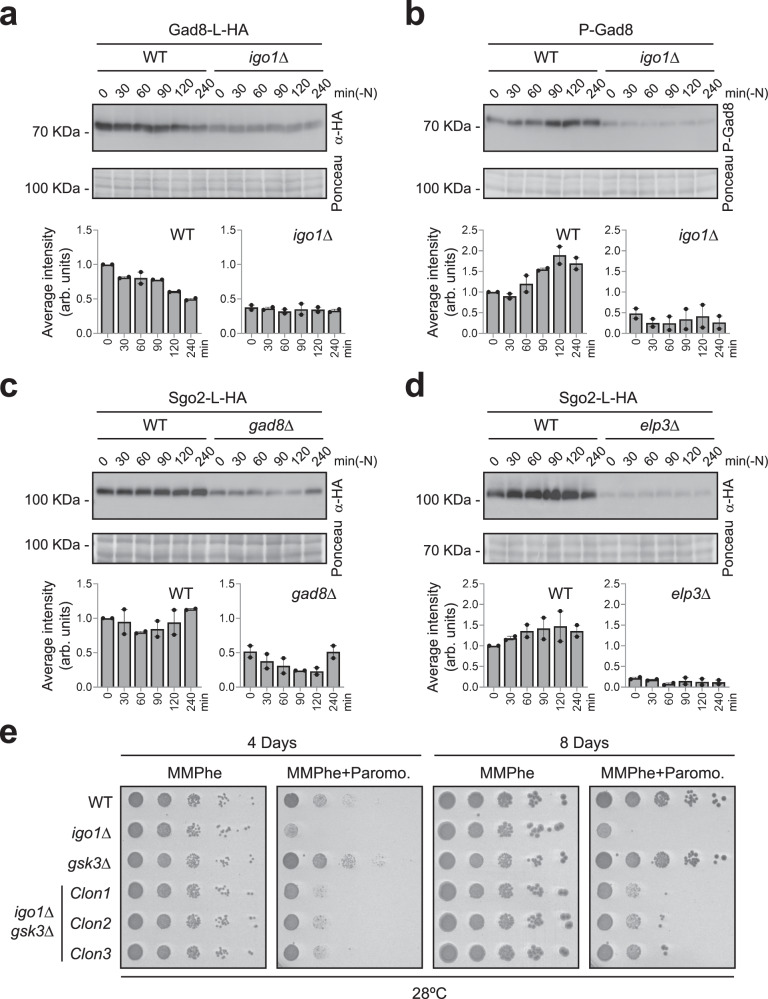
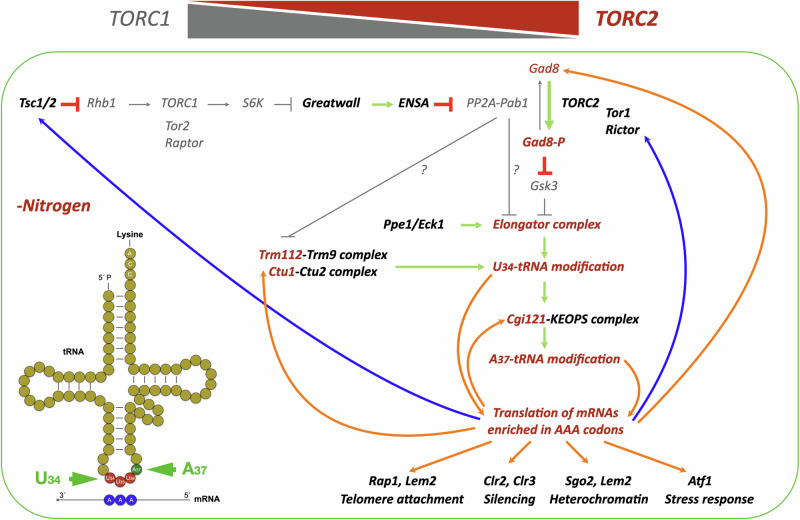
Quiescent cells require a continuous supply of proteins to maintain protein homeostasis. In fission yeast, entry into quiescence is triggered by nitrogen stress, leading to the inactivation of TORC1 and the activation of TORC2. In this study, we demonstrate that the Greatwall-Endosulfine-PPA/B55 pathway connects the downregulation of TORC1 with the upregulation of TORC2, resulting in the activation of Elongator-dependent tRNA modifications crucial for sustaining the translation programme during entry into quiescence. This mechanism promotes U34 and A37 tRNA modifications at the anticodon stem loop, enhancing translation efficiency and fidelity of mRNAs enriched for AAA versus AAG lysine codons. Notably, several of these mRNAs encode TORC1 inhibitors, TORC2 activators, tRNA modifiers, and proteins necessary for telomeric and subtelomeric functions. Therefore, we propose a mechanism by which cells respond to nitrogen stress at the level of translation, involving a coordinated interplay between tRNA epitranscriptome and biased codon usage.


Conflict of interest statement

Competing interests: The authors declare no competing interests.

Figures

Fig. 1
Fig. 1. The Greatwall-Endosulfine switch regulates subtelomeric gene silencing and telomeric anchoring to the nuclear envelope.
a Schematic representation of transcriptionally upregulated genes in the Endosulfine (igo1Δ) mutant. Genes overexpressed more than 10-fold in igo1∆ cells compared to the wild-type after 4 h in nitrogen-free EMM2 medium. Subtelomeric genes are highlighted in red. n = 3. b Schematic illustration of S. pombe subtelomeric chromatin structure (modified from). c Representative Super-Resolution Radial Fluctuations (SRRF) micrographs of wild-type (WT) and igo1Δ cells expressing Cut11:mCherry, Sad1:CFP and Taz1:YFP in nitrogen-rich EMM2 media (0 h) and after 8 h of nitrogen starvation in EMM2-N. The merged image and a detail view are shown. Bar: 2 μm. d Radial Profile Analysis for WT and igo1Δ cells after 0, 4 or 8 h of nitrogen deprivation (see details in Supplementary Fig. 1b). The average projection signals for the NE (in red), the SPB (in cyan) and the telomeres (in yellow) are shown. The graphs represent the normalized integrated intensity as a function of distance in microns. The red lines correspond to the NE signal, the cyan lines correspond to the SPB signal and the yellow lines correspond to the telomeric signal. Over 100 nuclei were analysed at each time point, n = 3. e Overlay between the average projection signals for Cut11/Sad1 or Cut11/Taz1 in WT and igo1Δ cells during entry into quiescence. The images were generated by projecting at least 100 nuclei, n = 3. f Colocalisation between Cut11/Sad1 and Cut11/Taz1 signals was quantified as Pearson correlation coefficients using ImageJ software. ANCOVA p-values are indicated, with significant differences shown in red. The box extends from the 25th to the 75th percentiles, with the horizontal line indicating the median. The whiskers extend to the minimum and maximum values. n = 5 (with at least 20 nuclei analysed per assay). Source data are provided as a Source data file.
Fig. 2
Fig. 2. Telomeric detachment from the nuclear envelope in igo1Δ cells is mediated by reduced Rap1 protein levels.
a Extracts from rap1:L:HA and ccq1:L:HA cells in a WT and igo1∆ background were collected at 0, 1, 2, 4 and 8 h of nitrogen starvation. These extracts were analysed by SDS-PAGE and western blotting using anti-HA antibodies. Ponceau staining was used as the loading control. b Extracts from rap1:L:HA cells in a WT and igo1∆ background, collected every 30 min during the first 2 h and then at 4 h of nitrogen starvation. These extracts were analysed by SDS-PAGE and western blotting using anti-HA antibodies. Ponceau staining was used as the loading control. c Extracts from rap1:L:HA and rap1:L:HA Pnmt41x:GST:pab1 cells in a WT and igo1∆ background were collected during nitrogen starvation and analysed by SDS-PAGE and western blot using anti-HA and anti-GST antibodies. Strains were grown with or without thiamine (+T or -T) to repress or induce the pab1 gene, encoding the B55 regulatory subunit of PP2A. Ponceau staining was used as the loading control. d Immunoblot quantification of c was performed using Image Studio Lite software, n = 3 of a total of 8 for igo1∆, n = 2 of a total of 6 for igo1∆ Pnmt41x:GST:pab1. Data are presented as the mean±S.E.M. e Radial Profile Analysis of WT, igo1∆ and igo1∆ Pnmt41x:GST:pab1 cells bearing Cut11 (in red), Sad1 (in cyan) or Taz1 (in yellow) in EMM2 (0 h) and after 8 h of nitrogen starvation. The igo1∆ Pnmt41x:GST:pab1 cells were grown with or without thiamine (+T or -T) to repress or induce the expression of pab1. Over 100 nuclei were projected to generate the images and graphics, n = 3. f Colocalisation between Cut11/Sad1 and Cut11/Taz1 signals of e was quantified as Pearson correlation coefficients using ImageJ software. ANCOVA p-values are indicated, significant differences are shown in red. The box extends from the 25th to the 75th percentiles, with the horizontal line indicating the median. The whiskers extend to the minimum and maximum values. n = 5 (with at least 20 nuclei analysed per assay). Raw gel images are provided in Supplementary Fig. 9. Source data are provided as a Source data file.
Fig. 3
Fig. 3. Crucial proteins required for silencing subtelomeric gene expression are downregulated in igo1Δ cells.
a Extracts from sgo2:L:HA cells in a WT and igo1∆ backgrounds were collected every 30 min during the first 2 h and then at 4 h of nitrogen starvation. These extracts were analysed by SDS-PAGE and western blotting using anti-HA antibodies. Ponceau staining was used as the loading control. Immunoblot quantification was performed using Image Studio Lite software, n = 2 of a total of 4 for igo1∆. Data are presented as the mean ± S.E.M. b Extracts from strains bearing sgo2:L:HA or sgo2:L:HA Pnmt41x:GST:pab1, were analysed by SDS-PAGE and western blotting with anti-HA and anti-GST antibodies. The igo1∆ Pnmt41x:GST:pab1 cells were grown with or without thiamine (+T or -T) to repress or induce the expression of pab1. Ponceau staining was used as the loading control. Immunoblot quantification was performed using Image Studio Lite software, n = 2 of a total of 4 for igo1∆, n = 2 of a total of 6 for igo1∆ Pnmt41x:GST:pab1. Data are presented as the mean ± S.E.M. c Representative micrographs of WT or igo1Δ cells expressing sgo2:L:GFP during entry into quiescence. The overlay of fluorescence and DIC images is shown. Quantification was carried out using ImageJ software from two independent experiments involving more than 150 cells. Bar: 5 μm. d Similar to (a), clr2:L:HA protein was analysed in both WT and igo1Δ backgrounds. Immunoblot quantification was performed using Image Studio Lite software, n = 2. Data are presented as the mean ± S.E.M. e Similar to (a), clr3:L:HA protein was analysed in both WT and igo1Δ backgrounds. Immunoblot quantification was performed using Image Studio Lite software, n = 2. Data are presented as the mean ± S.E.M. f ChIP-qPCR was performed with anti-H3K14-acetyl antibodies and quantified with primer pairs at the indicated ORFs. WT and igo1∆ cells grown in nitrogen-rich media (EMM2) or after 4 h of nitrogen starvation were analysed. The graphs represent normalized values, and error bars (SEM) for all ChIP-qPCR experiments were calculated from at least biological triplicates (n ≥ 3). A two-way ANOVA was performed, p-values are indicated, with significant differences shown in red. For gel source data, see Supplementary Fig. 9. Source data are provided as a Source data file.
Fig. 4
Fig. 4. PP2A interacts with proteins involved in tRNA modification.
a Interacting network resulting from mass-spectrometry analysis for paa1:L:YFP in EMM2-N. Cellular processes or protein complexes with a significant enrichment are colour-coded. Two experimental replicas of the mass spectrometry were performed, n = 2. Extracts from the untagged wild-type strain were used as negative control in the immunopurification experiment. Summary table showing the main PP2A interactors analysed in this manuscript. b top, Interaction between Paa1:L:YFP and Trm112:L:HA. Protein extracts from cells expressing paa1:L:YFP, trm112:L:HA or paa1:L:YFP trm112:L:HA cultured in nitrogen-rich or nitrogen-depleted media were immunoprecipitated with anti-GFP beads and probed with anti-GFP and anti-HA antibodies. Extracts (WCE) were assayed for levels of paa1:L:YFP and trm112:L:HA by western blot. Bottom, Interaction between Pab1:L:YFP and Elp3:L:HA. Protein extracts from cells expressing pab1:L:YFP, elp3:L:HA or pab1:L:YFP elp3:L:HA cultured in nitrogen-rich or nitrogen-depleted media were immunoprecipitated with anti-GFP beads and probed with anti-GFP and anti-HA antibodies. Extracts (WCE) were assayed for levels of Pab1:L:YFP and Elp3:L:HA by western blot. n = 2. Data are presented as the mean ± S.E.M. c Extracts from cells expressing trm112:L:HA or trm112:L:HA Pnmt41x:GST:pab1, were analysed by SDS-PAGE followed by immunoblotting with anti-HA and anti-GST antibodies. The igo1∆ Pnmt41x:GST:pab1 cells were grown in EMM2 with or without thiamine (+T or -T) to repress or induce the expression of pab1. Ponceau staining was used as the loading control. Immunoblot quantification was performed using Image Studio Lite software, n = 2 of a total of 4 for igo1∆, n = 2 of a total of 6 for igo1∆ Pnmt41x:GST:pab1. Data are presented as the mean ± S.E.M. d Extracts from Ctu1:L:HA cells in a WT and igo1∆ backgrounds were collected every 30 minutes during the first 2 h and then at 4 h of nitrogen starvation. These extracts were analysed by SDS-PAGE and immunoblotting using anti-HA antibodies. Ponceau staining was used as the loading control. Immunoblot quantification was performed using Image Studio Lite software, n = 2 of a total of 4 for igo1∆. Data are presented as the mean ± S.E.M. e Serial dilutions from WT and igo1Δ cultures were spotted onto EMM2 (Minimal Media containing NH4Cl) or MMPhe (Minimal Media containing Phenylalanine) plates without or with paromomycin (0.5 mg/ml), puromycin (0.5 mg/ml) or cycloheximide (CHX, 2.5 μg/ml). For gel source data, see Supplementary Fig. 9. Source data are provided as a Source data file.
Fig. 5
Fig. 5. Igo1 regulates tRNA modifications.
a Heat map (log2 fold-change) analysis from three biological replicas of the relative levels of tRNA ribonucleoside modifications in WT and igo1∆ cells. The side colour bar displays the range of log2 (fold-change) values. The heat map shows changes at 2 and 4 h of nitrogen starvation compared to exponentially growing cells (t = 0), with the igo1∆ mutant showing a decrease in mcm5s2U34 and t6A37 modification relative to the WT. b Fold-change values of mcm5s2U34 modification in WT and igo1∆ mutant cells. A two-way ANOVA was performed, p-values were calculated from biological triplicates, with significant differences shown in red and orange. Data are presented as the mean ± S.E.M. c Extracts from igo1Δ mutant cells transformed with episomal plasmids Pnmt41x:HA:rap1 (AAA/AAG) or mutated version Pnmt41x:HA:rap1 (all AAG) were analysed by SDS-PAGE followed by immunoblotting with anti-HA antibodies during nitrogen starvation. Ponceau staining was used as a loading control. Immunoblot quantification was performed using Image Studio Lite software, n = 2 of a total of 4 for igo1∆. Data are presented as the mean ± S.E.M. d Polysome analysis using sucrose gradient fractionation of WT and igo1∆ extracts from cells cultured in EMM2 (+ Nitrogen). Two replicas of the experiment were performed and the polysome/monosome ratio (P/M ratio) was calculated. e Polysome analysis using sucrose fractionation of WT and igo1∆ extracts from cells cultured in EMM2 lacking nitrogen for 4 h (-Nitrogen 4 h). Two replicas of the experiment were performed and the polysome/monosome ratio (P/M ratio) was calculated. Total RNA was purified from the different fractions, resuspended in DEPC-H2O, combining RNA from two consecutive fractions. cDNA was synthesised and pooled into, non-translating/poorly translating mRNAs (NT), corresponding to mRNAs associated to low molecular weight fractions, free ribosomal subunits and vacant ribosomes, and actively translating mRNAs found associated with the polysomal fractions (P). The mRNA levels (P/P + NT) for rap1, ctu1, fil1 and act1 were determined in the igo1∆ mutant relative to the WT, with an assigned value of 1 by qPCR. Source data are provided as a Source data file.
Fig. 6
Fig. 6. Endosulfine, Gad8 and Elongator are required for efficient translation of certain mRNAs during quiescence entry.
a Extracts from WT and igo1∆ cells expressing gad8:L:HA, were analysed by SDS-PAGE and immunoblotting with anti-HA antibodies during nitrogen starvation. Ponceau stain was used as a loading control. Immunoblot quantification was performed using Image Studio Lite software, n = 2. Data are presented as the mean ± S.E.M. b Same as in (a), Gad8 phosphorylation state was analysed in WT and igo1Δ cell extracts. Immunoblot quantification was performed using Image Studio Lite software, n = 2. Data are presented as mean ± S.E.M. c Same as in (a), sgo2:L:HA protein was analysed in a WT and gad8Δ cell extracts. Immunoblot quantification was performed using Image Studio Lite software, n = 2. Data are presented as the mean ± S.E.M. d Same as in (a), sgo2:L:HA protein was analysed in a WT and elp3Δ cell extracts. Immunoblot quantification was performed using Image Studio Lite software, n = 2. Data are presented as the mean ± S.E.M. e Serial dilutions from cultures of WT, igo1Δ, gsk3Δ and igo1Δ gsk3Δ were spotted onto MMPhe (Minimal Media with Phenylalanine) plates without or with paromomycin (0.5 mg/ml). For gel source data, see Supplementary Fig. 9. Source data are provided as a Source data file.
Fig. 7
Fig. 7. Activation of TORC2-Gad8 signalling in quiescent cells promotes the translation of mRNAs with a high AAALys codon usage.
This model is based on previous work in fission yeast, demonstrating that nitrogen starvation induces the inactivation of TORC1 and the activation of TORC2 signalling through the Greatwall-Endosulfine-PP2A/B55 pathway. Phosphorylation of Gad8 at S546 leads to the inhibition of Gsk3 and the activation of Elongator, which promotes U34 tRNA modification and translation of Tsc1, an inhibitor of TORC1, as well as activators of TORC2, such as Tor1 and Rictor (depicted by blue arrows). In this study, we present additional feedback loops (indicated by orange arrows) that enhance the translation of Gad8, Trm112, Ctu1 and Cgi121, further increasing the U34 and A37 tRNA modifications necessary for the efficient translation of mRNAs enriched in AAAlys codons. Such mRNAs include rap1, lem2, clr2, clr3 and sgo2 which encode proteins required for the correct attachment of telomeres to the NE and for subtelomeric gene silencing, and atf1, which encodes the master regulator of the Core Environmental Stress Response (CESR) genes in fission yeast.

Update of

Similar articles

Cited by

  • The balance between B55α and Greatwall expression levels predicts sensitivity to Greatwall inhibition in cancer cells.
    Zach R, Annis M, Martin-Guerrero SM, Alatawi A, Chia KH, Meredith M, Osborn K, Peter N, Pearce W, Booth J, Rajasekaran M, Dias S, Coleman-Evans L, Foster WR, Harper JA, Herbert AD, Tighe C, Reuillon T, West R, Busby O, Burdova K, Crepin D, Ortoll S, Vaeteewoottacharn K, Dejsuphong D, Spencer J, Patel H, Le Grand D, Hunt TA, Andrews DM, Yamano H, Cutillas PR, Oliver AW, Ward SE, Hochegger H. Zach R, et al. Nat Commun. 2025 Aug 27;16(1):8016. doi: 10.1038/s41467-025-62943-z. Nat Commun. 2025. PMID: 40866357 Free PMC article.

References

    1. Gonzalez, A. & Hall, M. N. Nutrient sensing and TOR signaling in yeast and mammals. EMBO J.36, 397–408 (2017). - PMC - PubMed
    1. Gonzalez, A., Hall, M. N., Lin, S. C. & Hardie, D. G. AMPK and TOR: the Yin and Yang of cellular nutrient sensing and growth control. Cell Metab.31, 472–492 (2020). - PubMed
    1. Bontron, S. et al. Yeast endosulfines control entry into quiescence and chronological life span by inhibiting protein phosphatase 2A. Cell Rep.3, 16–22 (2013). - PubMed
    1. Chica, N. et al. Nutritional control of cell size by the Greatwall-Endosulfine-PP2A.B55 pathway. Curr. Biol.26, 319–330 (2016). - PubMed
    1. Aono, S., Haruna, Y., Watanabe, Y. H., Mochida, S. & Takeda, K. The fission yeast Greatwall-Endosulfine pathway is required for proper quiescence/G(0) phase entry and maintenance. Genes Cells24, 172–186 (2019). - PubMed

Publication types

MeSH terms

Associated data