. 2024 Dec 5;15(1):10607.
doi: 10.1038/s41467-024-54996-3.

SARS-CoV-2 N protein recruits G3BP to double membrane vesicles to promote translation of viral mRNAs

Affiliations

SARS-CoV-2 N protein recruits G3BP to double membrane vesicles to promote translation of viral mRNAs

Siwen Long et al. Nat Commun. .

Abstract

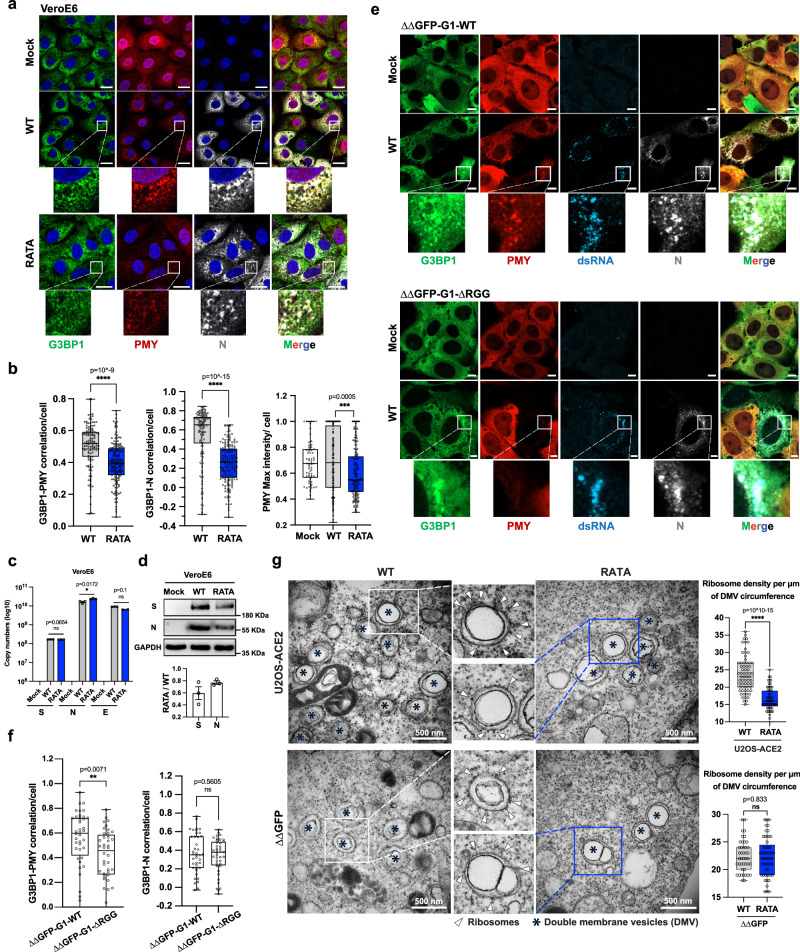
Ras-GTPase-activating protein SH3-domain-binding proteins (G3BP) are critical for the formation of stress granules (SGs) through their RNA- and ribosome-binding properties. SARS-CoV-2 nucleocapsid (N) protein exhibits strong binding affinity for G3BP and inhibits infection-induced SG formation soon after infection. To study the impact of the G3BP-N interaction on viral replication and pathogenesis in detail, we generated a mutant SARS-CoV-2 (RATA) that specifically lacks the G3BP-binding motif in the N protein. RATA triggers a stronger and more persistent SG response in infected cells, showing reduced replication across various cell lines, and greatly reduced pathogenesis in K18-hACE2 transgenic mice. At early times of infection, G3BP and WT N protein strongly colocalise with dsRNA and with non-structural protein 3 (nsp3), a component of the pore complex in double membrane vesicles (DMVs) from which nascent viral RNA emerges. Furthermore, G3BP-N complexes promote highly localized translation of viral mRNAs in the immediate vicinity of the DMVs and thus contribute to efficient viral gene expression and replication. In contrast, G3BP is absent from the DMVs in cells infected with RATA and translation of viral mRNAs is less efficient. This work provides a fuller understanding of the multifunctional roles of G3BP in SARS-CoV-2 infection.


Conflict of interest statement

Competing interests: The authors declare no competing interests.

Figures

Fig. 1
Fig. 1. SARS-CoV-2 infection inhibited SGs formation independent of eIF2α.
a VeroE6 cells were mock infected or infected with SARS-CoV-2 WT at 0.5 MOI. Cells were fixed at 6, 12, and 24 hpi and stained for G3BP1 (green), eIF4G (red), N (gray), and Hoechst (blue). White arrows indicate SGs. Representative images from three independent experiments are shown. Scale bar = 10 µm. Quantification of SG foci and N protein intensity were analyzed by CellProfiler (b) Bars represent mean ± SEM for three independent experiments shown as hollow dots (each dot representing the mean of 30 cells). c The line indicates the inverse correlation of N protein level and SG numbers per cell (n = 320 cells). The correlation was calculated by Pearson correlation coefficient r = –0.2, p = 0.0004 (two-tailed). d VeroE6 cells were infected as in (a). Cell lysates were separated by SDS-PAGE and probed with indicated antibodies. e VeroE6 cells were infected as in (a) and at 6 hpi were stressed with SA or PAT for 1 h before fixation and staining. Images are shown in Supplementary Fig. 1a. Quantification of SG foci was performed using CellProfiler. Bars represent mean ± SEM for three independent experiments, shown as hollow dots (each dot representing the mean of 30 cells). f Cells were lysed for immunoblotting with indicated antibodies.
Fig. 2
Fig. 2. SARS-CoV-2 N in founder stain and variants, binds G3BP.
a Schematic of SARS-CoV-2 genome and N protein, created in BioRender. b VeroE6 cells were mock infected or infected with SARS-CoV-2 WT (founder strain) at 0.01 MOI for 24 h. Cells were lysed and immunoprecipitated with G3BP1 or N antibodies and analyzed by immunoblot for indicated proteins. c Amino acid sequence of N (aa 12-20) in different variants. d VeroE6 cells were mock infected or infected with WA-1, Delta, Omicron or XBB.1.5 at 0.01 MOI for 24 h. Cells were lysed and immunoprecipitated using G3BP1 or N antibody to determine the interaction of G3BP and N. Quantification of western blot was performed using Image J and data are presented as mean values ± SEM from three independent experiments. e VeroE6 cells were mock infected or infected with WA-1 or XBB.1.5 at 0.5 MOI. At 6 hpi, cells were stressed with SA or PAT for 1 h before fixation and staining with indicated antibodies. Representative images from three independent experiments are shown. Scale bar = 10 µm. f Quantification of SG foci was performed using CellProfiler. Bars represent mean ± SEM for three independent experiments, shown as hollow dots (each dot representing the mean of 30 cells).
Fig. 3
Fig. 3. SARS-CoV-2 RATA is defective in SG inhibition and is attenuated in multiple cell lines.
a Structure of G3BP1 NTF2L bound to N-WT (aa1-25) (PDB: 7SUO). b Schematic of SARS-CoV-2 WT and RATA mutant, created in BioRender. RNA sequencing confirmed no reversion at positions 15 or 17 in RATA clones, indicating successful recovery of infectious virus (Supplementary Fig. 2a, b) c VeroE6 cells were infected with WT virus or RATA mutant at 0.01 MOI for 24 h. Cells were lysed and immunoprecipitated with G3BP1 or N antibody for immunoblotting. d VeroE6 cells were infected with SARS-CoV-2 WT or RATA at 0.5 MOI for 6 h. Images are shown in Supplementary Fig. 2d. Quantification of SG foci was performed using CellProfiler. Bars represent mean ± SEM for four independent experiments shown as hollow dots (each dot representing the mean of 20 or 99 cells). e VeroE6 cells were infected as in (d) and stressed at 6 hpi with SA or PAT for 1 h. Images are shown in Supplementary Fig. 2e. Quantification of SG foci intensity was performed using CellProfiler. Bars represent mean ± SEM for three independent experiments shown as hollow dots (each dot representing the mean of 30 cells). f VeroE6 and MA104 – two SARS-CoV-2 permissive cell lines, and U2OS cells transduced with ACE2 and TMPRSS2 were infected with SARS-CoV-2 WT or RATA until plaques were visible. Representative images on left show relative plaque sizes in indicated cell lines. Right, plaque sizes were measured by Image J (n = 17 plaques per condition). The box plots bound the interquartile range divided by the median, with the whiskers extending from the minimum to the maximum values, each dot represents the plaque size of an individual plaque. g Viral titer from indicated cell lines infected with SARS-CoV-2 WT or SARS-CoV-2 RATA at 0.05 MOI. Data are presented as mean values ± SD as appropriate (n = 3 biological replicates).
Fig. 4
Fig. 4. Infection of K18-hACE2 transgenic mice with SARS-CoV-2 WT or RATA mutant.
a Schematic of SARS-CoV-2 challenge and rechallenge experiments, created in BioRender. b For primary challenge, mice were inoculated with 100 PFU of SARS-CoV-2 WT or RATA and evaluated for weight loss (n = 4 in each group). c RT-qPCR of N protein and E protein expression in mice lungs after primary challenge (n = 3 mice). Data are presented as mean values ± SEM as appropriate in (b, c). d Lung histopathology and N protein immunohistochemistry staining in the lungs at 7 dpi from mock, SARS-CoV-2 WT and RATA infected mice. Scale bar = 50 µm. e mice 21 days after the primary infection, or naive mice were rechallenged with 1000 PFU of SARS-CoV-2 WT and evaluated for weight loss (n = 4 in each group). f RT-qPCR of N protein and E protein expression in mice lungs after rechallenge (n = 3 mice). Data are presented as mean values ± SEM as appropriate in (e, f). g Lung histopathology and N protein immunohistochemistry staining from mock and rechallenged mice. Images are representative of lung sections from four mice, scale bar = 50 µm.
Fig. 5
Fig. 5. G3BP1 facilitates LLPS of N and G3BP-N induces distinct lysate granules.
a Purified N-WT or N-RATA protein was added at varying concentrations to lysates from U2OS cells lacking both G3BP1 and G3BP2, and stably expressing GFP-G3BP1 (∆∆GFP-G1-WT). N-specific antibodies conjugated to Alexa Fluor 647 secondary antibody were used to visualize N protein. Representative images from three independent experiments are shown. b Summary of the phase separation behaviors of the N-WT or N-RATA with increasing concentrations of purified G3BP1 protein in ∆∆GFP-G1-WT cell lysate. Corresponding images are shown in Supplementary Fig. 4b. c Purified G3BP1 (20 µM) with or without N-WT (10 µM) or N-RATA (10 µM) to was added to ∆∆GFP-G1-WT cell lysates. Fluor-conjugated antibodies were used to visualize N (red), eIF4G/Actin/Caprin1 (yellow), or GFP (green) indicated GFP-G3BP1. Representative images from three independent experiments are shown. Scale bar = 10 µm.
Fig. 6
Fig. 6. N recruits G3BP1 to RTC early in infection via interaction with pore protein nsp3.
a VeroE6 cells were infected with WT SARS-CoV-2 at 0.5 MOI. Cells were fixed at 6 h and stained for G3BP1 (green), dsRNA (red) and N (gray), Hoechst (blue). Representative images from three independent experiments are shown. Scale bar = 5 µm b Schematic of GFP-G3BP1 constructs used for reconstitution of G3BP1/2 double KO cell lines. All lines were subsequently transduced with ACE2 receptor and TMPRSS2. c ΔΔGFP-G1-WT cells were infected with WT SARS-CoV-2 WT or RATA at 0.5 MOI for 6 h. Cells were fixed and stained for dsRNA (blue), N (gray) and eIF4A (c) or nsp3 (e) (red). Representative images from three independent experiments are shown. White arrows indicate SGs. Scale bar = 5 µm. d Pearson’s correlation coefficients for colocalization of G3BP1 and dsRNA in indicated cells were calculated in CellProfiler (n = 71 for VeroE6 cells, n = 20 dsRNA-positive fields for ΔΔGFP-G1-WT cells). Box plots bound the interquartile range divided by the median, with the whiskers extending from the minimum to the maximum values. f ΔΔGFP-G1-WT cells were infected with WT virus or RATA mutant at 0.01 MOI for 24 h. Cells were lysed and immunoprecipitated with GFP or N antibody for immunoblotting as indicated.
Fig. 7
Fig. 7. G3BP1 recruits 40S ribosomal subunit to viral factories.
a VeroE6 cells were infected with WT SARS-CoV-2 or RATA mutant at 0.5 MOI for 6 h. Cells were incubated with PMY (20 µg/mL) for 2 min before fixation and stained for G3BP1 (green), PMY (red), N (gray), Hoechst (blue). Representative images from three independent experiments are shown. Scale bar = 20 µm. b Correlations of G3BP1-PMY, or G3BP1-N, and PMY max intensity were calculated in CellProfiler based on Pearson’s correlation coefficient for infected cells (n = 126 in WT, n = 160 in RATA, n = 66 in Mock). Box plots bound the interquartile range divided by the median, with the whiskers extending from the minimum to the maximum values c VeroE6 cells were infected with SARS-CoV-2 WT or RATA mutant at 0.05 MOI for 6 h, cells were collected for RT-qPCR to quantify viral RNA expression (n = 3 biological replicates) and d for immunoblotting with indicated antibodies. Representative images from three independent experiments are shown. Quantification of western blot was performed using Image J. Bar chart in (c, d) are presented as mean values ± SEM as appropriate. e Indicated cell lines were infected with SARS-CoV-2 WT at 0.5 MOI for 6 h. Cells were incubated with PMY (20 µg/mL) for 2 min before fixation and stained for PMY (red), N (gray), dsRNA (blue). Representative images from three independent experiments are shown. Scale bar = 5 µm. f Correlations of GFP-G3BP1-PMY, or GFP-G3BP1-N were calculated in CellProfiler based on Pearson’s correlation coefficient for n = 40 infected cells. Box plots bound the interquartile range divided by the median, with the whiskers extending from the minimum to the maximum values g Indicated cells were infected with SARS-CoV-2 WT or RATA mutant at 0.5 MOI for 10 h and processed for transmission electron microscopy. DMV are indicated with asterisks and DMV-associated ribosomes by white triangles. Scale bar = 500 nm. Quantification of ribosome density per DMV (the number of ribosomes attached to DMV divided by length of DMV perimeter) was calculated in Image J. Each dot represents a DMV (U2OS WT = 66, U2OS RATA = 57, ∆∆ WT = 43, ∆∆ RATA = 53). Box plots bound the interquartile range divided by the median, with the whiskers extending from the minimum to the maximum values.
Fig. 8
Fig. 8. The antiviral and proviral roles of G3BP in SARS-CoV-2 infected cells.
SARS-CoV-2 infection activated PKR/PERK-eIF2α serves as a protective mechanism in host cells, leading to the G3BP dependent SGs assembly. However, SARS-CoV-2 N protein hijacks G3BP, contributing to the enhancement of SARS-CoV-2 replication across multiple stages of the replication cycle: (1) G3BP-N interaction mediates the disassembly of SGs. (2) Early in infection, the N protein recruits G3BP to nsp3 at the RTC, potentially aiding in viral RNA synthesis and transcription; (3) The G3BP-N complex recruits 40S ribosomal subunits to viral factories for efficient viral protein translation; (4) G3BP promote the LLPS of N, facilitating SARS-CoV-2 virus assembly. Created in BioRender.

Similar articles

Cited by

References

    1. V’kovski, P., Kratzel, A., Steiner, S., Stalder, H. & Thiel, V. Coronavirus biology and replication: implications for SARS-CoV-2. Nat. Rev. Microbiol.19, 155–170 (2021). - PMC - PubMed
    1. Steiner, S. et al. SARS-CoV-2 biology and host interactions. Nat. Rev. Microbiol.22, 206–225 (2024). - PubMed
    1. Kedersha, N. et al. G3BP-Caprin1-USP10 complexes mediate stress granule condensation and associate with 40S subunits. J. Cell Biol.212, 845–860 (2016). - PMC - PubMed
    1. Protter, D. S. W. & Parker, R. Principles and properties of stress granules. Trends Cell Biol.26, 668–679 (2016). - PMC - PubMed
    1. McCormick, C. & Khaperskyy, D. A. Translation inhibition and stress granules in the antiviral immune response. Nat. Rev. Immunol.17, 647–660 (2017). - PubMed

Publication types

MeSH terms