. 2024 Dec 5;14(1):30290.
doi: 10.1038/s41598-024-81983-x.

Monitoring individualized glucose levels predicts risk for bradycardia in type 2 diabetes patients with chronic kidney disease: a pilot study

Affiliations

Monitoring individualized glucose levels predicts risk for bradycardia in type 2 diabetes patients with chronic kidney disease: a pilot study

Pejman Farhadi Ghalati et al. Sci Rep. .

Abstract

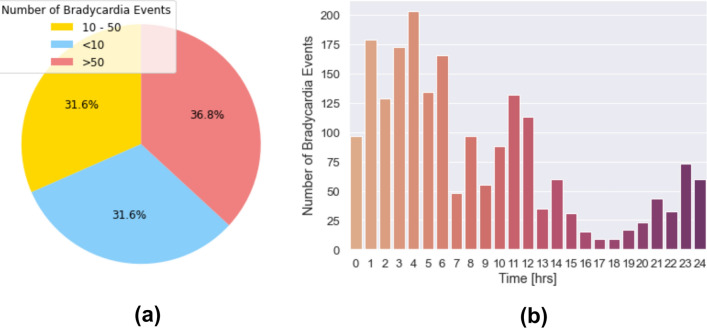
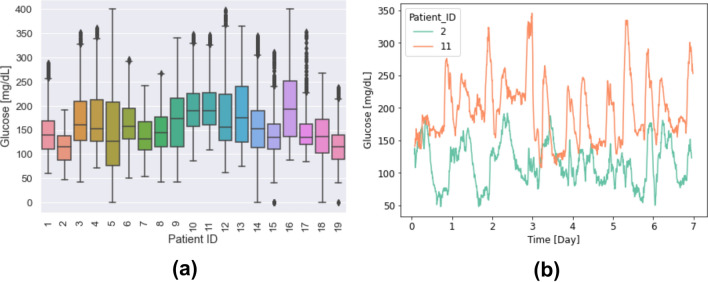
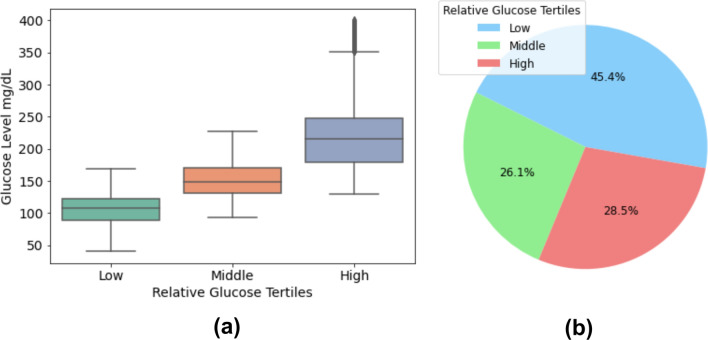
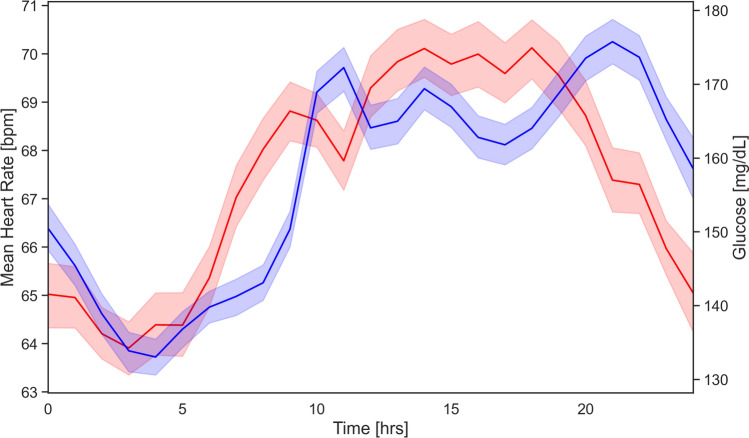
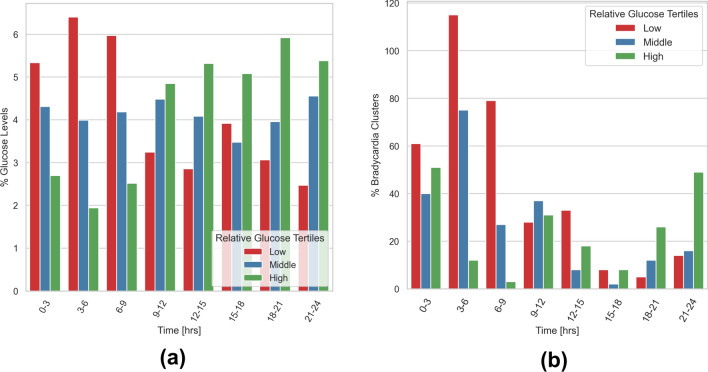
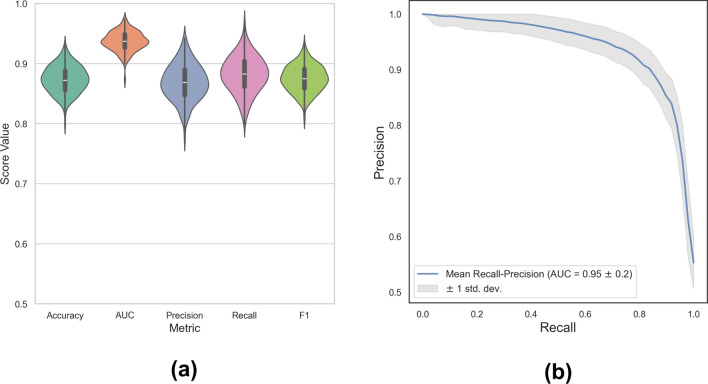
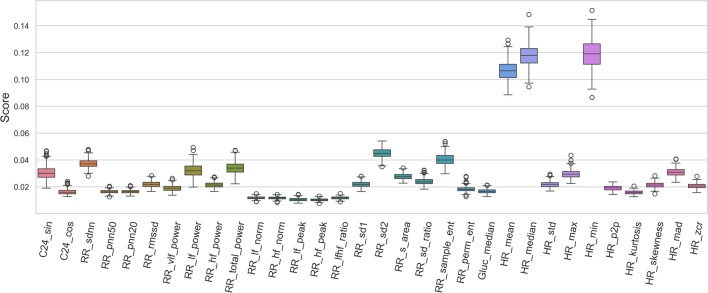
Patients with diabetes mellitus (DM) and chronic kidney disease (CKD) exhibit an elevated risk for cardiac arrhythmias, such as bradycardia, which may potentially lead to sudden cardiac death (SCD). While hypoglycemia, defined as a critical drop in glucose levels below the normal range, has long been associated with adverse cardiovascular events, recent studies have highlighted the need for a comprehensive reevaluation of its direct impact on cardiovascular outcomes, particularly in high-risk populations such as those with DM and CKD. In this study, we investigated the association between glucose levels and bradycardia by simultaneously monitoring interstitial glucose (IG) and ECG for 7 days in insulin-treated patients with DM and CKD. We identified bradycardia episodes in 19 of 85 patients (22%) and associated these episodes with personalized low, medium, and high relative glucose levels. Our analysis revealed a significant increase in bradycardia frequency during periods of lowest relative glucose, particularly between 06:00-09:00 and 12:00-15:00. Furthermore, leveraging a Random Forests classifier, we achieved a promising area under the curve (AUC) of 0.94 for predicting bradyarrhythmias using glucose levels and heart rate variability features. Contrary to previous findings, only 4% of bradycardia episodes in our study population occurred at glucose levels of 70 mg/dL or lower, with 28% observed at levels exceeding 180 mg/dL. Our findings not only highlight the strong correlation between relative glucose levels, heart rate parameters, and bradycardia onset but also emphasize the need for a more personalized definition of hypoglycemia to understand its relationship with bradyarrhythmias in high-risk DM and CKD patient populations.

Keywords: Bradycardia; Chronic kidney disease; Diabetes mellitus; Glucose monitoring; Hypoglycemia; Machine learning; Personalized medicine.


Conflict of interest statement

Declarations. Competing interests: The authors declare no competing interests.

Figures

Fig. 1
Fig. 1
Distribution and number of bradycardia episodes. (a) Distribution of bradycardia episodes per patient, based on three frequency levels: less than 10 episodes, from 10 to 50 episodes, and more than 50 episodes. (b) Number of bradycardia episodes in all patients at every hour of the day.
Fig. 2
Fig. 2
Absolute glucose range and example profiles. (a) Absolute glucose range in each of the 19 patients with bradycardia episodes. (b) Example of glucose profile of two patients with bradycardia episodes, which shows a clear difference in glucose level range in these two patients.
Fig. 3
Fig. 3
Relative glucose levels distribution and percentage. (a) Distribution of glucose levels in each relative individualized glucose tertile. (b) Percentage of bradycardia events at different glucose levels.
Fig. 4
Fig. 4
Association of glucose individualizes relative glucose levels and heart rate. The red line represents the mean heart rate of all patients over a full day, with a 95% confidence interval. The blue line shows the mean glucose levels for all patients during the same period, also with a 95% confidence interval. The correlation between glucose and heart rate is strong, with a coefficient of 0.704 and a highly significant P value of 8.48×10⁻⁵.
Fig. 5
Fig. 5
Tertiles data points percentage and three hours bradycardia percentage. (a) Percentage of data points at different glucose tertiles in 3-hour time intervals. (b) Percentage of bradycardia events at different glucose tertiles in 3-hour time intervals.
Fig. 6
Fig. 6
The ratio of bradycardia episodes in relation to low and high relative glucose tertiles. The figure shows the distribution of P values multiplied by the expression direction of bradycardia events at low and high relative glucose tertiles in 3-hour intervals, obtained using Fisher’s exact test in a bootstrap sampling strategy. Positive values indicate an increase in bradycardia events, while negative values indicate a decrease.
Fig. 7
Fig. 7
HRV features significance test in differentiating bradycardia events. A statistical significance test was performed to explore whether HRV feature values were able to differentiate the data points with bradycardia events from time points without bradyarrhythmia. In a bootstrapping approach, the distribution of P values was computed and multiplied by the difference between the two groups’ mean values for each HRV feature.
Fig. 8
Fig. 8
Bradycardia risk zone and normal zone schema. Bradycardia risk zone and normal zone identification: Black windows, with the length m, are the normal data points, and the gray one is the risk data point that occurred d minutes before the bradycardia event.
Fig. 9
Fig. 9
Classification measures. (a) The distribution of classification measures of bradycardia risk prediction using Random Forests. (b) The recall-precision curve of Random Forests classifier trained on the HRV features.
Fig. 10
Fig. 10
Feature Importance. A Random Forests classifier was utilized to predict the bradycardia risk in diabetic patients in a bootstrapping manner. The model returns a score showing the percentage of each feature’s involvement in the prediction. Accordingly, the distribution of each feature’s score was obtained.

References

    1. Carrero, J. J. et al. Sex differences in the impact of diabetes on mortality in chronic dialysis patients. Nephrology Dialysis Transplantation26, 270–276 (2011). - PubMed
    1. Bergner, D. W. & Goldberger, J. J. Diabetes mellitus and sudden cardiac death: what are the data?. Cardiology journal17, 117–129 (2010). - PubMed
    1. Pun, P. H. et al. Chronic kidney disease is associated with increased risk of sudden cardiac death among patients with coronary artery disease. Kidney international76, 652–658 (2009). - PMC - PubMed
    1. Myerburg, R. J. & Junttila, M. J. Sudden cardiac death caused by coronary heart disease. Circulation125, 1043–1052 (2012). - PubMed
    1. Grisanti, L. A. Diabetes and arrhythmias: pathophysiology, mechanisms and therapeutic outcomes. Frontiers in physiology9, 409132 (2018). - PMC - PubMed

LinkOut - more resources