. 2025 Apr;50(5):828-840.
doi: 10.1038/s41386-024-02034-7. Epub 2024 Dec 5.

The activation of the piriform cortex to lateral septum pathway during chronic social defeat stress is crucial for the induction of behavioral disturbance in mice

Affiliations

The activation of the piriform cortex to lateral septum pathway during chronic social defeat stress is crucial for the induction of behavioral disturbance in mice

Yuki Okuda et al. Neuropsychopharmacology. 2025 Apr.

Abstract

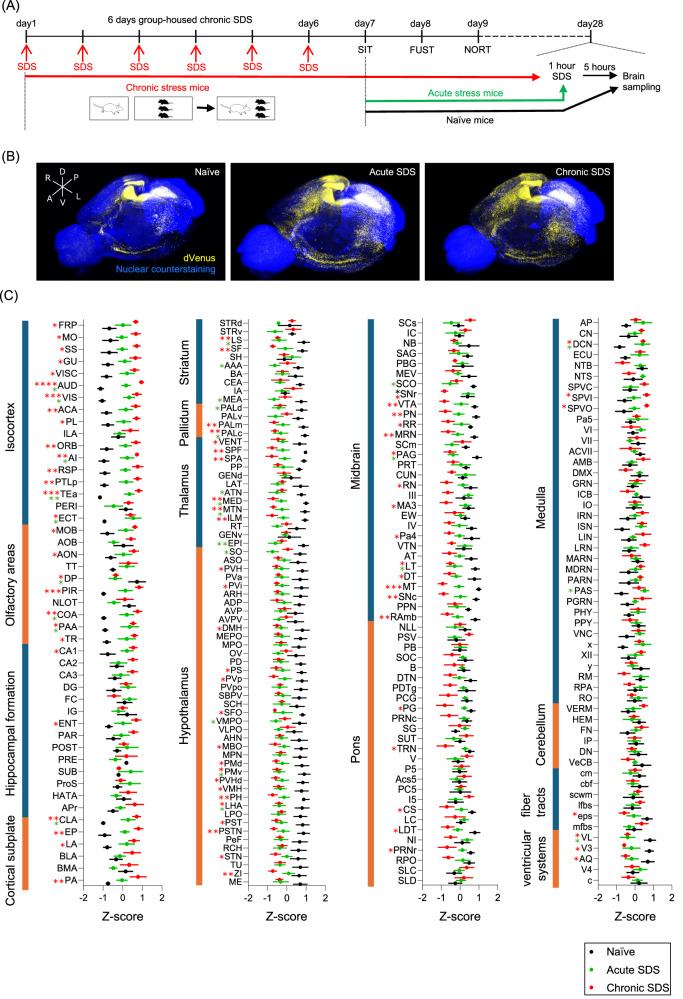
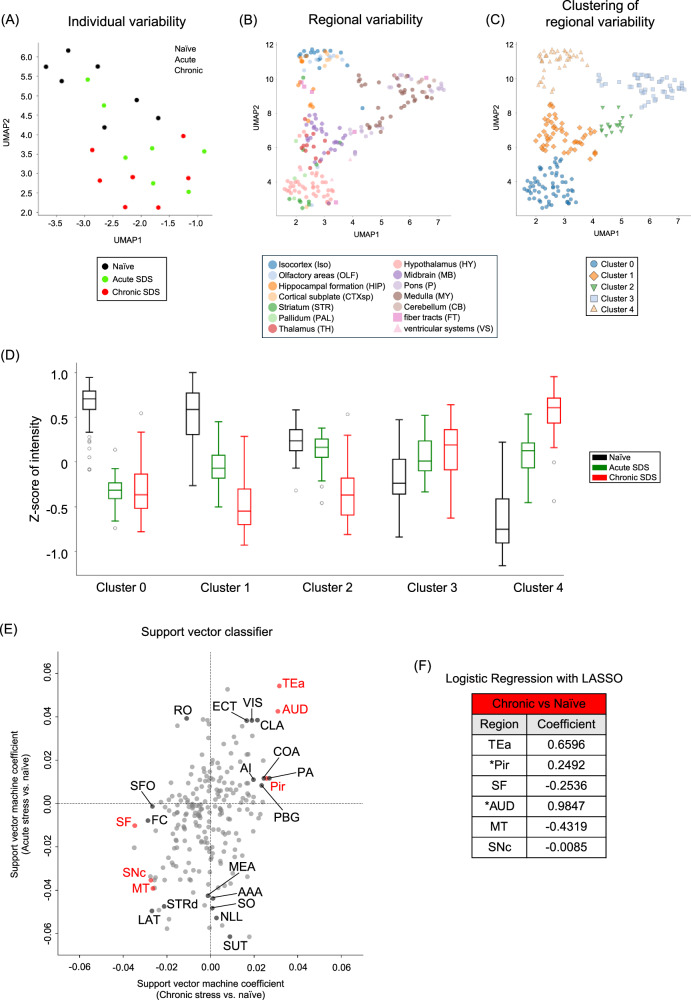
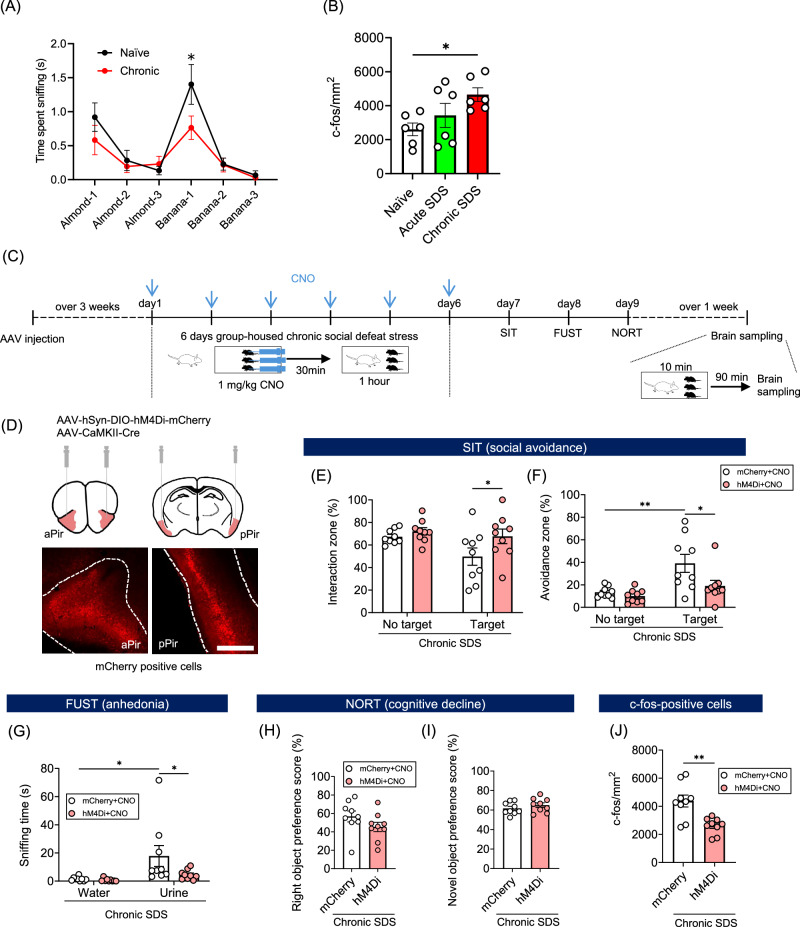
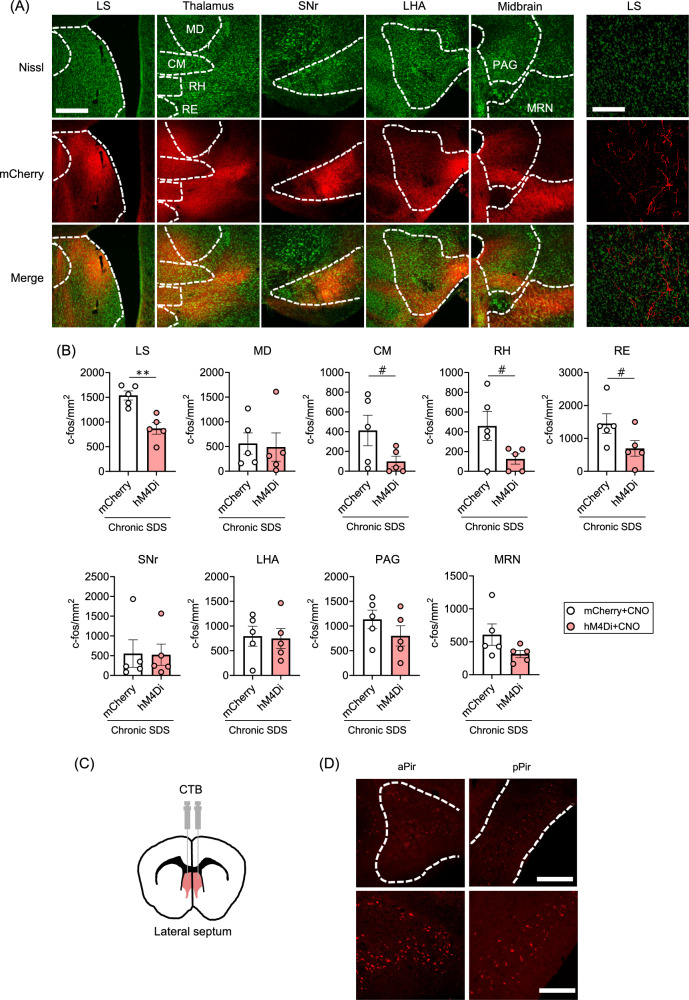
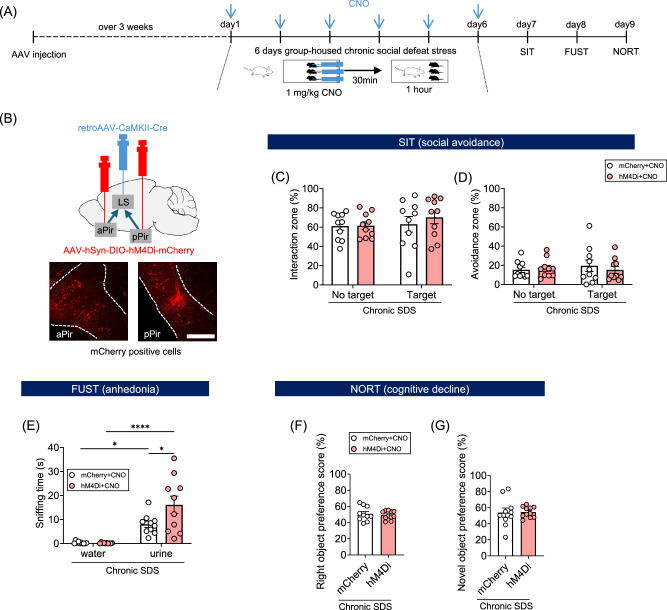
Chronic stress induces neural dysfunctions and risks mental illnesses. Clinical and preclinical studies have established the roles of brain regions underlying emotional and cognitive functions in stress and depression. However, neural pathways to perceive sensory stimuli as stress to cause behavioral disturbance remain unknown. Using whole-brain imaging of Arc-dVenus neuronal response reporter mice and machine learning analysis, here we unbiasedly demonstrated different patterns of contribution of widely distributed brain regions to neural responses to acute and chronic social defeat stress (SDS). Among these brain regions, multiple sensory cortices, especially the piriform (olfactory) cortex, primarily contributed to classifying neural responses to chronic SDS. Indeed, SDS-induced activation of the piriform cortex was augmented with repetition of SDS, accompanied by impaired odor discrimination. Axonal tracing and chemogenetic manipulation showed that excitatory neurons in the piriform cortex directly project to the lateral septum and activate it in response to chronic SDS, thereby inducing behavioral disturbance. These results pave the way for identifying a spatially defined sequence of neural consequences of stress and the roles of sensory pathways in perceiving chronic stress in mental illness pathology.


Conflict of interest statement

Competing interests: The authors declare no competing interests.

Figures

Fig. 1
Fig. 1. Whole brain imaging revealed the effects of acute and chronic social defeat stress on brain-wide neural activities.
A Experimental schedule of acute and chronic social defeat stress (SDS), behavioral tests, and whole brain imaging with Arc-dVenus mice. SDS was applied by introducing a male ICR mouse (white) into the home cage of three male Arc-dVenus mice (black). Mice with chronic SDS received SDS for 1 h daily for six consecutive days (Day 1 to Day 6) followed by the social interaction test (SIT, Day 7), female urine sniffing test (FUST, Day 8), and novel object recognition test (NORT, Day 9). After 3 weeks to minimize possible interference from the behavioral tests, the mice received an additional SDS 5 h before sacrifice for whole brain imaging (Day 28). Mice with acute SDS or naïve mice were sacrificed for whole brain imaging with or without SDS, respectively (Day 28), after the behavioral tests (Day 7 to Day 9). B Representative whole brain images of Arc-dVenus mice without SDS (Naïve) or with acute or chronic SDS. dVenus fluorescent signals were shown in yellow. Nuclear counterstaining with Hoechst 33342 was shown in blue. A: anterior, P: posterior, D: dorsal, V: ventral, L: left, and R: right. C Z-scores of dVenus fluorescent intensities in the brain of Arc-dVenus mice without SDS (Naïve, black circle) or with acute or chronic SDS (green or red circle, respectively). dVenus intensities measured from designated brain regions were normalized to the distribution among individual mice to calculate z-scores. N = 7 in each group. Brain regions were grouped into broader brain structures according to the Allen Mouse Brain Atlas. Abbreviations for brain regions are shown in Supplementary Table S1. Two-way ANOVA results are shown in Supplementary Table S3. *P < 0.05, **P < 0.01, ***P < 0.001, ****P < 0.0001 for Tukey’s multiple comparisons test between naïve mice and those with acute or chronic SDS (green or red, respectively) or between those with acute and chronic SDS (black). Error bars represent means ± SEM.
Fig. 2
Fig. 2. Widely distributed brain regions differently contribute to neural responses to acute and chronic social defeat stress.
A UMAP plot to visualize the variability of brain-wide neural activities among naïve (black), acute SDS (green), and chronic SDS (red) individual mice, based on fluorescent intensities of Arc-dVenus mice. B UMAP plot to visualize the variability of neural activities among 223 brain regions. The color of a data point represents the brain structure which each brain region belongs to, as indicated below. C Five clusters of brain regions defined with UMAP clustering analysis. D Box plots of z-scores of neural activities in brain regions categorized to the indicated clusters defined in (C) for naïve (black), acute SDS (green), and chronic SDS (red) mice. Each box shows the interquartile range (IQR) with the median in the middle. The whiskers cover the datapoints outside, except outliers that were distant from the IQR by more than its 1.5 times. E Plots of support vector machine coefficients for respective brain regions to classify neural activities in acute SDS or chronic SDS mice from those in naïve mice in the vertical or horizontal axis, respectively. F Brain regions whose contributions were selected by LASSO analysis to classify neural activities in chronic SDS mice from those in naïve mice and their LASSO coefficients. Asterisks indicate sensory cortices (i.e., Pir and AUD). These brain regions are highlighted in red in (E). Abbreviations for brain areas are shown in Supplementary Table S1.
Fig. 3
Fig. 3. The activation of excitatory neurons in the piriform cortex during chronic social defeat stress is crucial for the induction of behavioral disturbance.
A Odor discrimination deficit after chronic SDS. Naïve mice (black) or chronic SDS mice (red) were presented with either almond or banana extract for 2 min, with the same odor repeated three times (i.e., Almond-1 to Almond-3 and Banana-1 to Banana-3). The time spent sniffing odorants during each session for 2 min was plotted. The increase in the sniffing time upon odor switching is considered as a behavioral index of odor discrimination. N = 9 for naïve mice, and N = 11 for chronic SDS mice. *P < 0.05 for Bonferroni’s multiple comparisons test. Error bars represent means ± SEM. B The density of c-Fos-positive cells in the piriform cortex of naïve, acute SDS, and chronic SDS mice. N = 6 in each group. *P < 0.05 for Bonferroni’s multiple comparisons test. Error bars represent means ± SEM. C Experimental schedule for DREADD-mediated inhibition of excitatory neurons in the piriform cortex during chronic SDS and subsequent behavioral tests. Three weeks after AAV vector injection, mice were exposed to SDS 30 min after daily CNO administration for 6 days (blue arrows, Day 1 to Day 6). After 24 h recovery, the social interaction test (SIT, Day 7), female urine sniffing test (FUST, Day 8), and novel object recognition test (NORT, Day 9) were conducted without CNO administration. After 1 week or more for recovery, mice received an additional SDS before brain sampling for c-Fos immunofluorescent staining. D AAV vector injection for DREADD-mediated inhibition of excitatory neurons in the piriform cortex. AAV-hSyn-DIO-hM4Di-mCherry was stereotaxically injected with AAV-CaMKII-Cre into anterior and posterior piriform cortices (aPir and pPir, respectively; upper panels). Representative images of mCherry-positive cells in these regions are shown (lower panels). Scale bar, 200 μm. EI Results of the behavioral tests. Mice expressing mCherry alone or hM4Di-mCherry were subjected to the behavioral tests as shown in (C). In the social interaction test (SIT), the proportion of the time spent in the interaction zone (E) and the avoidance zone (F) without or with a target ICR mouse (No target or Target, respectively) was used to determine the level of social avoidance. In the female urine sniffing test (FUST), the time spent sniffing water or female urine was used to determine the level of anhedonia (G). In the novel object recognition test (NORT), the proportion of the time spent sniffing the right object during the first session (H) and the proportion of the time spent sniffing the novel object during the second session (I) were used to determine the level of spatial bias and cognitive decline, respectively. N = 9 in each group. J The effect of DREADD-mediated inhibition on SDS-induced c-Fos expression in the piriform cortex. Mice expressing mCherry alone or hM4Di-mCherry were subjected to c-Fos immunofluorescent staining as shown in (C). The density of c-Fos-positive cells in the piriform cortex is shown. N = 9 in each group. One-way ANOVA and two-way repeated measures ANOVA results are shown in Supplementary Table S3. *P < 0.05, **P < 0.01 for Bonferroni’s multiple comparisons test (EG). **P < 0.01 for unpaired t-test (J). Error bars represent means ± SEM.
Fig. 4
Fig. 4. Excitatory neurons in the piriform cortex project directly to the lateral septum and activate it in response to chronic social defeat stress.
A Representative images of mCherry-positive axons of excitatory neurons in the piriform cortex. The same mice expressing mCherry alone used for chronic SDS and the behavioral tests shown in Fig. 3 were sacrificed for immunofluorescent staining for mCherry. Fluorescent Nissl and mCherry signals are shown in green and red, respectively. Dotted lines indicate brain region boundaries. Scale bars, 200 μm. Magnified images of the lateral septum are also shown (right panels). Scale bars, 100 μm. B Effects of DREADD-mediated inhibition of excitatory neurons in the piriform cortex on SDS-induced c-Fos expression in the brain regions shown in (A). The same mice used in Fig. 3J, expressing mCherry alone or hM4Di-mCherry in excitatory neurons in the piriform cortex and administered with CNO during chronic SDS (mCherry+CNO or hM4Di+CNO, respectively), were used. N = 5 in each group. #P < 0.1, **P < 0.01 for unpaired t-test. Error bars represent means ± SEM. C, D Retrograde labeling of piriform neurons projecting to the lateral septum with CTB. Fluorescently labelled CTB was stereotaxically injected into the lateral septum, highlighted in red (C). Representative images of CTB-positive cells in anterior and posterior piriform cortices (D, aPir and pPir, respectively). Magnified images are also shown (D, lower panels). Scale bar, 200 μm (upper panels) and 100 μm (lower panels). Abbreviations for brain regions are shown in Supplementary Table 1.
Fig. 5
Fig. 5. The activation of the piriform cortex to lateral septum pathway during chronic social defeat stress is crucial for the induction of behavioral disturbance.
A Experimental schedule for DREADD-mediated inhibition of the piriform cortex to lateral septum pathway during chronic SDS and subsequent behavioral tests. The experiments were scheduled as described in the legend of Fig. 3C. B AAV vector injection for DREADD-mediated inhibition of excitatory neurons in the piriform cortex projecting to the lateral septum. AAV-hSyn-DIO-hM4Di-mCherry and retroAAV-CaMKII-Cre were stereotaxically injected into anterior and posterior piriform cortices (aPir and pPir, respectively) and the lateral septum (LS), respectively (upper panel). Representative images of mCherry-positive cells in the aPir and pPir are shown (lower panels). Scale bar, 200 μm. CG Results of the behavioral tests. Mice expressing mCherry alone or hM4Di-mCherry in the targeted neurons and administered with CNO during chronic SDS (mCherry+CNO or hM4Di+CNO, respectively) were subjected to the behavioral tests as shown in (A). Behavioral indices shown in these graphs are described in the legend of Fig. 3E–I. N = 10 for mCherry alone, N = 10 for hM4Di-mCherry. Two-way repeated measures ANOVA results are shown in Supplementary Table S3. *P < 0.05, ****P < 0.0001 for Bonferroni’s multiple comparisons test. Error bars represent means ± SEM.

Similar articles

Cited by

References

    1. Lupien SJ, McEwen BS, Gunnar MR, Heim C. Effects of stress throughout the lifespan on the brain, behaviour and cognition. Nat Rev Neurosci. 2009;10:434–45. - PubMed
    1. Sanacora G, Yan Z, Popoli M. The stressed synapse 2.0: pathophysiological mechanisms in stress-related neuropsychiatric disorders. Nat Rev Neurosci. 2022;23:86–103. - PubMed
    1. Nestler EJ, Russo SJ. Neurobiological basis of stress resilience. Neuron. 2024;112:1911–29. - PMC - PubMed
    1. Duman RS, Sanacora G, Krystal JH. Altered Connectivity in Depression: GABA and Glutamate Neurotransmitter Deficits and Reversal by Novel Treatments. Neuron. 2019;102:75–90. - PMC - PubMed
    1. Bath KG, Russo SJ, Pleil KE, Wohleb ES, Duman RS, Radley JJ. Circuit and synaptic mechanisms of repeated stress: Perspectives from differing contexts, duration, and development. Neurobiol Stress. 2017;7:137–51. - PMC - PubMed

LinkOut - more resources