. 2024 Dec 5;15(1):10631.
doi: 10.1038/s41467-024-54673-5.

X-linked deletion of Crossfirre, Firre, and Dxz4 in vivo uncovers diverse phenotypes and combinatorial effects on autosomes

Affiliations

X-linked deletion of Crossfirre, Firre, and Dxz4 in vivo uncovers diverse phenotypes and combinatorial effects on autosomes

Tim P Hasenbein et al. Nat Commun. .

Abstract

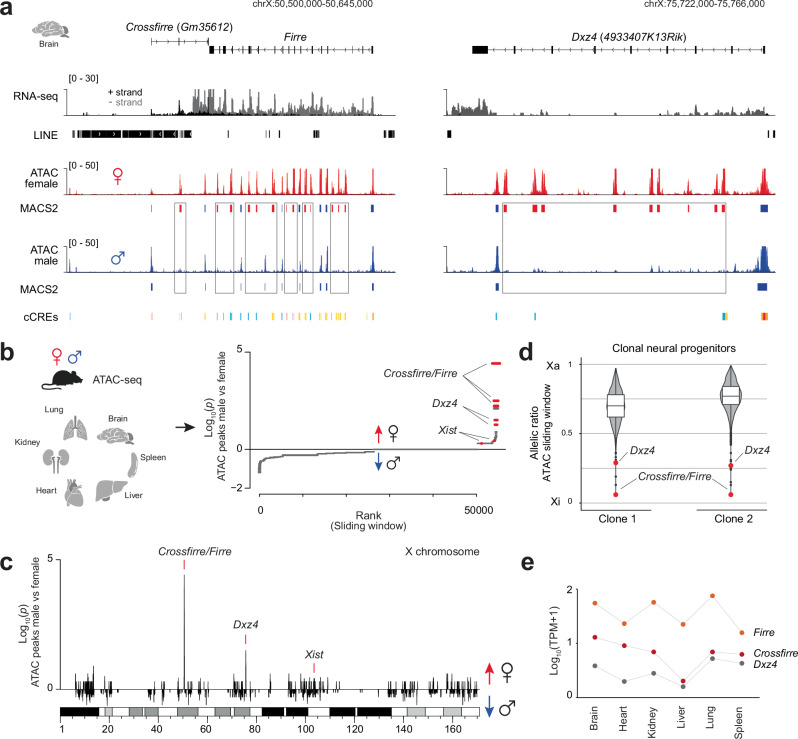
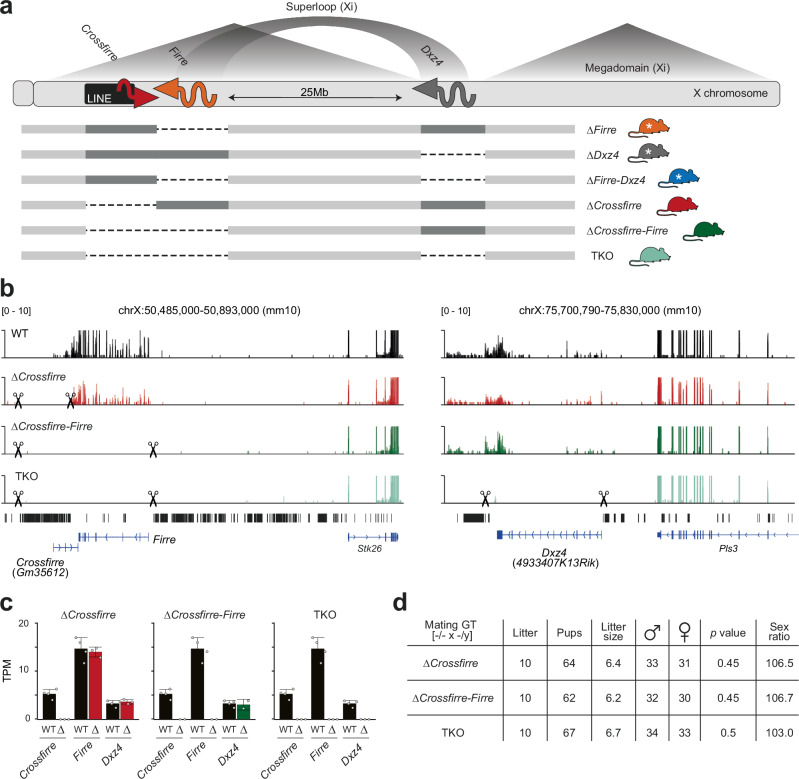
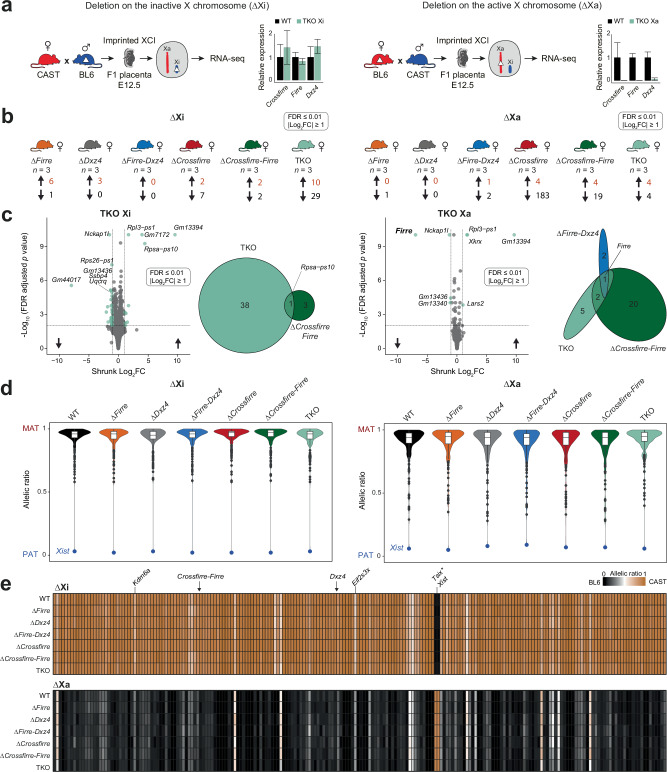
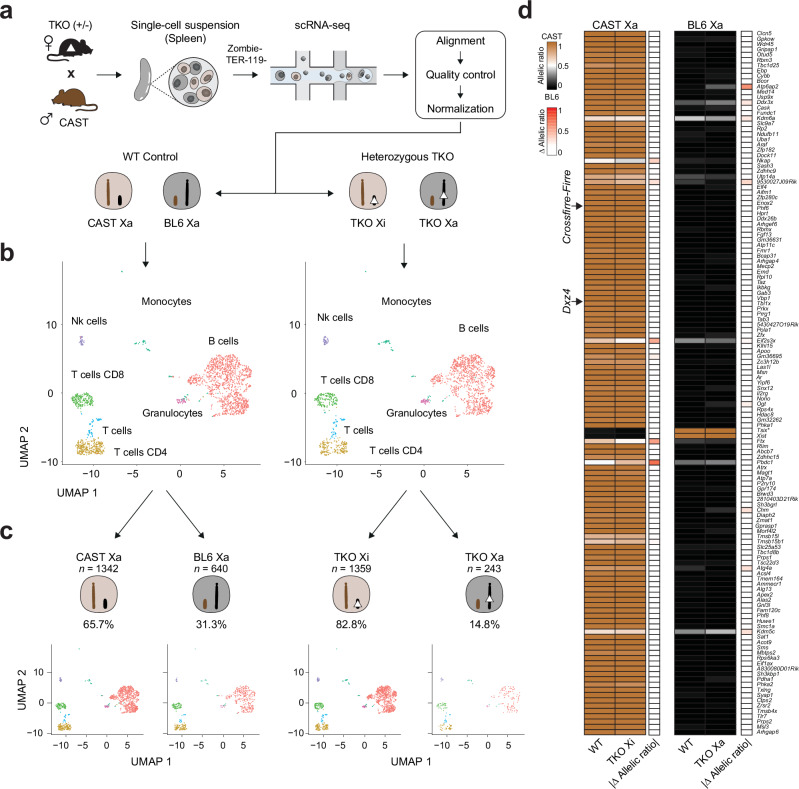
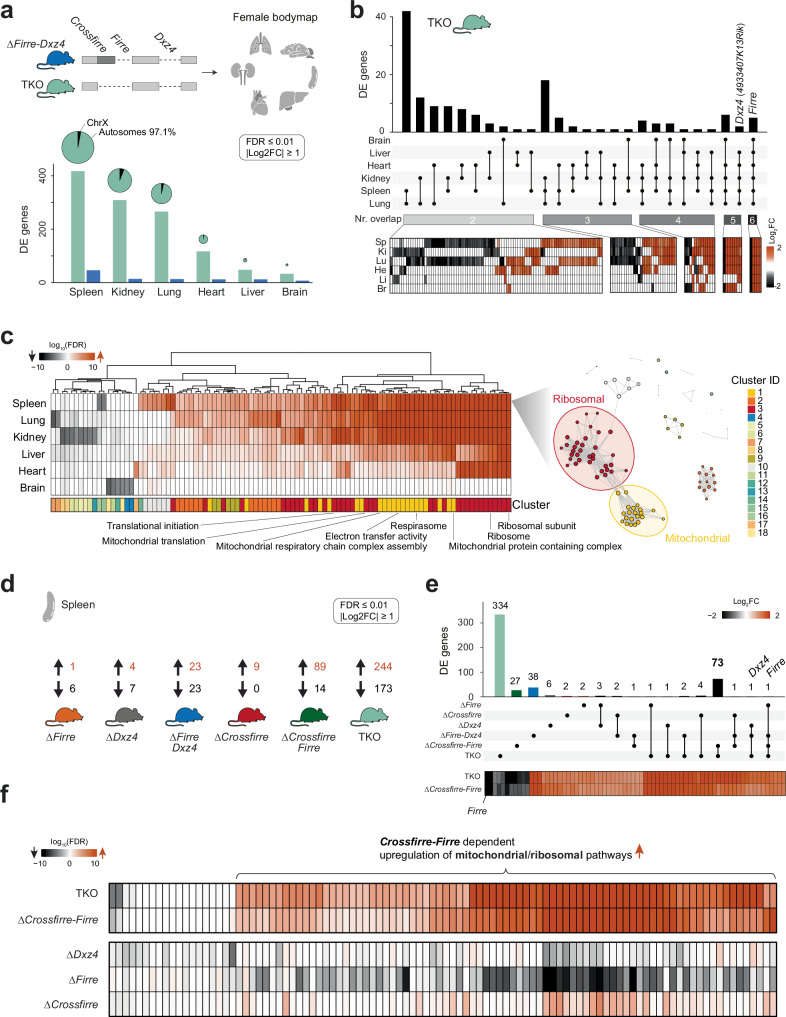
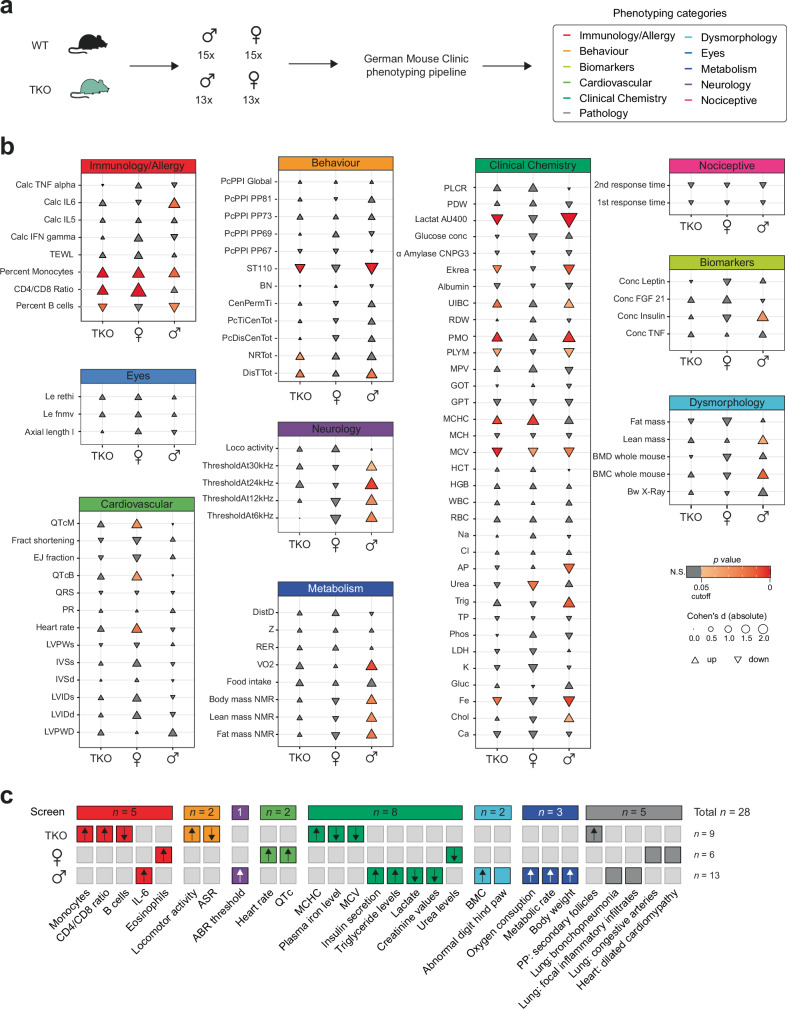
The lncRNA Crossfirre was identified as an imprinted X-linked gene, and is transcribed antisense to the trans-acting lncRNA Firre. The Firre locus forms an inactive-X-specific interaction with Dxz4, both loci providing the platform for the largest conserved chromatin structures. Here, we characterize the epigenetic profile of these loci, revealing them as the most female-specific accessible regions genome-wide. To address their in vivo role, we perform one of the largest X-linked knockout studies by deleting Crossfirre, Firre, and Dxz4 individually and in combination. Despite their distinct epigenetic features observed on the X chromosome, our allele-specific analysis uncovers these loci as dispensable for imprinted and random X chromosome inactivation. However, we provide evidence that Crossfirre affects autosomal gene regulation but only in combination with Firre. To shed light on the functional role of these sex-specific loci, we perform an extensive standardized phenotyping pipeline and uncover diverse knockout and sex-specific phenotypes. Collectively, our study provides the foundation for exploring the intricate interplay of conserved X-linked loci in vivo.


Conflict of interest statement

Competing interests: The authors declare no competing interests.

Figures

Fig. 1
Fig. 1. Crossfirre, Firre, and Dxz4 loci are the topmost female-specific loci by chromatin accessibility with unique allele-specific characteristics.
a Genome browser tracks of the mouse brain showing strand-specific RNA-seq and ATAC-seq for females (red) and males (blue) covering the Crossfirre (Gm35612), Firre, and Dxz4 (4933407K13Rik) locus. The gene body of Crossfirre is embedded in a 50 Kb LINE cluster. Boxes highlight female-specific ATAC-seq peaks identified through MACS2. ENCODE Candidate Cis-Regulator Elements (cCRES) are shown for each locus (Promoter: red, Proximal enhancer: orange, Distal enhancer: yellow, DNase/H3K4me3: pink, CTCF: blue). b Overview of six female and male organs (two biological replicates per sex, n = 24) utilized to map sex-specific chromatin accessible loci from publicly available ATAC-seq data (left). A one-sided binomial test was used to identify sex-specific loci genome-wide by comparing male and female ATAC peak counts binned over 100 Kb sliding windows (right, see section “Methods”). A positive value was assigned if more peaks were present in females than in males, while negative values were assigned if the reverse was true. The top female-specific loci Crossfirre, Firre, and Dxz4 are indicated, together with the expected female-specific Xist locus. c Sex-specific analysis of (b) for the entire X chromosome. d Violin plots displaying the allelic ratio of ATAC enrichment over a 50 Kb sliding window for the entire X chromosome of neuronal progenitor cell clones (n = 2). The red dot highlights the allelic ratio of the sliding window overlapping the Crossfirre/Firre and Dxz4 locus. Boxes represent the interquartile range around the median, while the whiskers extend to 1.5 times the interquartile range. e RNA-sequencing abundance of Crossfirre (red), Firre (orange), and Dxz4 (gray) across various mouse organs. Shown are the log10-transformed mean TPM values of each gene within the respective tissue with a pseudocount of 1 added.
Fig. 2
Fig. 2. Mice carrying a Crossfirre single deletion or combined with Firre and Dxz4 are viable and undergo normal development.
a Schematic overview of the X chromosome. The megadomains and the superloop between the Firre and Dxz4 loci are specific to the inactive X chromosome (Xi), whereas full-length transcription of Firre and Dxz4 only occurs on the active X chromosome (Xa). The imprinted lncRNA Crossfirre shows expression from the maternal X chromosome, independent of random XCI. Dotted lines indicate the deleted loci for ∆Firre (orange), ∆Dxz4 (gray), ∆Firre-Dxz4 (blue), ∆Crossfirre (red), ∆Crossfirre-Firre (green), ∆Crossfirre-Firre-Dxz4 (TKO, turquoise). Colors are used in figures throughout the manuscript to highlight the genotype of origin. White stars refer to previously generated mouse strains. b Genome browser RNA-seq tracks showing the Crossfirre/Firre (left) and Dxz4 (right) locus for the adult spleen of wildtype (black), and ∆Crossfirre, ∆Crossfirre-Firre, TKO mutants. Scissors indicate the start and end of the CRISPR-Cas9 deletion (see section “Methods”). c Mean expression values of Crossfirre, Firre, and Dxz4 in the adult spleens of Crossfirre mutant strains (WT n = 4, ∆Crossfirre n = 3, ∆Crossfirre-Firre n = 2, TKO n = 3). Error bars indicate the standard deviation. d Sex distribution of homozygous ∆Crossfirre, ∆Crossfirre-Firre, and TKO breeding. The p values are obtained from a one-sided binomial test.
Fig. 3
Fig. 3. Deleting the imprinted Crossfirre locus alone or together with Firre and Dxz4 does not affect imprinted XCI.
a Schematic of our experimental system to investigate the impact of the deletions on the inactive X (Xi, left) or active X (Xa, right) for imprinted X inactivation. RNA-seq data of E12.5 female placentas are analyzed from wildtype (WT) F1 reciprocal crosses (CASTxBL6 n = 9, BL6xCAST n = 8), and for the six F1 mutants carrying the deletion on the paternal Xi (n = 3 per genotype) or on the maternal Xa (n = 3 per genotype). The relative expression (mean and standard deviation) between WT and ∆Crossfirre-Firre-Dxz4 (TKO, turquoise) is shown for deletions on Xi (left) and Xa (right). b Number of differentially expressed genes across mutant strains (DEseq2: FDR ≤ 0.01, |log2FC| ≥ 1). c FDR-adjusted P values of differential gene expression analysis between WT and TKO on Xi (left) and Xa (right). Venn diagram showing the overlap of dysregulated genes between ∆Firre-Dxz4 (blue), ∆Crossfirre-Firre (green), and the TKO (turquoise). d Median allelic ratios for X-linked genes in WT (black) and the six knockout strains carrying the deletions on Xi (left) or Xa (right). The blue dot emphasizes the paternal allelic ratio of the lncRNA Xist. The allelic ratios range from 0 to 1 such that 1 corresponds to maternal expression (MAT), 0.5 to biallelic expression, and 0 to paternal expression (PAT). Boxes indicate the interquartile range around the median and whiskers 1.5x the interquartile range. e Heatmap showing median allelic ratios for X-linked genes that are informative across all WT and knockout strains carrying the deletions on Xi (upper panel) or Xa (lower panel). Brown indicates an allelic ratio of 1 (CAST allele), while black indicates an allelic ratio of 0 (BL6 allele). Common escape genes Kdm6a and Eif2s3x are highlighted showing biallelic expression, thus validating our approach. Arrows indicate the approximate location of Crossfirre, Firre, and Dxz4. *The expression of Tsix from Xi is due to the overlapping nature with Xist and thus an artifact of the non-stranded analysis.
Fig. 4
Fig. 4. Deletion of topmost female-specific loci Crossfirre, Firre, and Dxz4 does not affect random XCI.
a Schematic overview of the experimental setup to investigate the effects of the ∆Crossfirre-Firre-Dxz4 (TKO) on the active X (Xa) or inactive X (Xi) upon random XCI. Heterozygous TKO females (BL6) were mated with wildtype (WT) CAST mice to generate F1 hybrids with WT and heterozygous TKO genotypes. Spleens were isolated (WT n = 1, TKO heterozygous n = 1) and processed for single-cell RNA-seq. Sequencing data were subjected to bioinformatic preprocessing, including alignment, quality control, and normalization. The dataset was split according to the genotype condition (WT/TKO). b UMAP of unsupervised clustering by genotype condition (WT/TKO). c Single-cell RNA-seq data were further split by Xa chromosome state (CAST Xa, BL6 Xa) using Allelome.PRO and a chromosome-wide window (see section “Methods”). Thus, we obtained single-cell RNA-seq data from WT and TKO spleen cells which could be categorized in one of four groups: WT CAST Xa, WT BL6 Xa, TKO Xi (CAST Xa), and TKO Xa (BL6 Xa). d Heatmap showing the median allelic ratios for informative X-linked genes in WT and TKO mice carrying the deletions on Xi (left) or Xa (right). Read counts of all cells were summarized as pseudobulk to increase gene coverage. The brown color indicates an allelic ratio of 1 corresponding to the CAST allele, while black indicates an allelic ratio of 0 (BL6 allele). Arrows indicate the approximate location of Crossfirre, Firre, and Dxz4. *The expression of Tsix from Xi is due to the overlapping nature with Xist and thus an artifact of the non-stranded analysis.
Fig. 5
Fig. 5. Homozygous double deletion of Crossfirre-Firre, results in upregulation of mitochondrial and ribosomal pathways.
a Transcriptomic bodymap for six different organs from homozygous adult female ∆Firre-Dxz4 and ∆Crossfirre-Firre-Dxz4 (TKO) mice (wildtype n = 4; ∆Firre-Dxz4 n = 4; TKO n = 3). Chart bars show the number of significantly differentially expressed genes in the spleen, kidney, lung, heart, liver, and brain for TKO and ∆Firre-Dxz4 (DEseq2: FDR ≤ 0.01, |log2FC| ≥ 1). Pie plots represent the proportion of differentially expressed genes between the X chromosome and autosomes as percentages. The size of the pie plots is proportional to the total amount of differentially expressed genes. b Number of differentially expressed genes shared across two, three, four, five, and six different tissues in TKO mice. The heatmap below shows the log2fold changes of the overlapping dysregulated genes per tissue being up- (orange) or downregulated (black). c Heatmap showing the log10(FDR) of the top 100 significantly enriched gene sets from TKO gene set enrichment analysis (left; FDR ≤ 0.1). Network plot for spleen showing 18 gene set clusters with two dominant groups associated with mitochondrial (cluster ID: 1 n = 21) and ribosomal (cluster ID: 3 n = 35) gene sets (right). d Differential gene expression results from RNA-seq data obtained from female spleens of the different knockout strains. The number of significantly up- and downregulated genes is shown per genotype. e Number of significantly differentially expressed genes unique for each genotype and shared by the different knockout models. Below, heatmap showing log2fold changes of differentially expressed genes shared between ∆Crossfirre-Firre and TKO mice. Color shading indicates up- (orange) and downregulation (black). f Gene set enrichment analysis of dysregulated genes from TKO, ∆Crossfirre-Firre, ∆Dxz4, ∆Firre, and ∆Crossfirre deletions. The heatmap shows the log10(FDR) of all informative gene sets of the top 100 significantly enriched gene sets detected in (c).
Fig. 6
Fig. 6. Large-scale phenotyping analysis of TKO mutants uncovers knockout and sex-specific phenotypes.
a The German Mouse Clinic (GMC) phenotyping pipeline was conducted using 30 wildtype (WT, 15 males, 15 females) and 26 ∆Crossfirre-Firre-Dxz4 (TKO) mice (13 males, 13 females). The pipeline covered the screening tests from the following categories: immunology/allergy, behavior, biomarkers, cardiovascular, clinical chemistry, pathology, dysmorphology, eyes, metabolism, neurology, and nociception. b Visualization of key measured parameters to provide a general overview of the GMC screening pipeline results. The size of each triangle corresponds to the absolute effect size, represented by Cohen’s d. Triangles pointing up or down indicate upregulation or downregulation, respectively. Parameters with a p value < 0.05 are considered significant. N.S.: not significant (t-test). Additional parameter information, including p values, effect sizes (Cohen’s d, Hedges’ g), and parameter abbreviations are provided in Supplementary Data 1, sheets o–q. c Concise overview of the significant parameters as phenotypes for the groups TKO (n = 9), female-specific (n = 6), and male-specific (n = 13) by phenotyping category.

References

    1. Kay, G. F., Barton, S. C., Surani, M. A. & Rastan, S. Imprinting and X chromosome counting mechanisms determine Xist expression in early mouse development. Cell77, 639–650 (1994). - PubMed
    1. Okamoto, I., Otte, A. P., Allis, C. D., Reinberg, D. & Heard, E. Epigenetic dynamics of imprinted X inactivation during early mouse development. Science303, 644–649 (2004). - PubMed
    1. Takagi, N. & Sasaki, M. Preferential inactivation of the paternally derived X chromosome in the extraembryonic membranes of the mouse. Nature256, 640–642 (1975). - PubMed
    1. Mak, W. et al. Reactivation of the paternal X chromosome in early mouse embryos. Science303, 666–669 (2004). - PubMed
    1. Barr, M. L. & Bertram, E. G. A morphological distinction between neurones of the male and female, and the behaviour of the nucleolar satellite during accelerated nucleoprotein synthesis. Nature163, 676 (1949). - PubMed

Publication types

Substances

Associated data