. 2024 Dec 6;15(1):10637.
doi: 10.1038/s41467-024-54671-7.

Spatially resolved gene expression profiling of tumor microenvironment reveals key steps of lung adenocarcinoma development

Affiliations

Spatially resolved gene expression profiling of tumor microenvironment reveals key steps of lung adenocarcinoma development

Yuma Takano et al. Nat Commun. .

Abstract

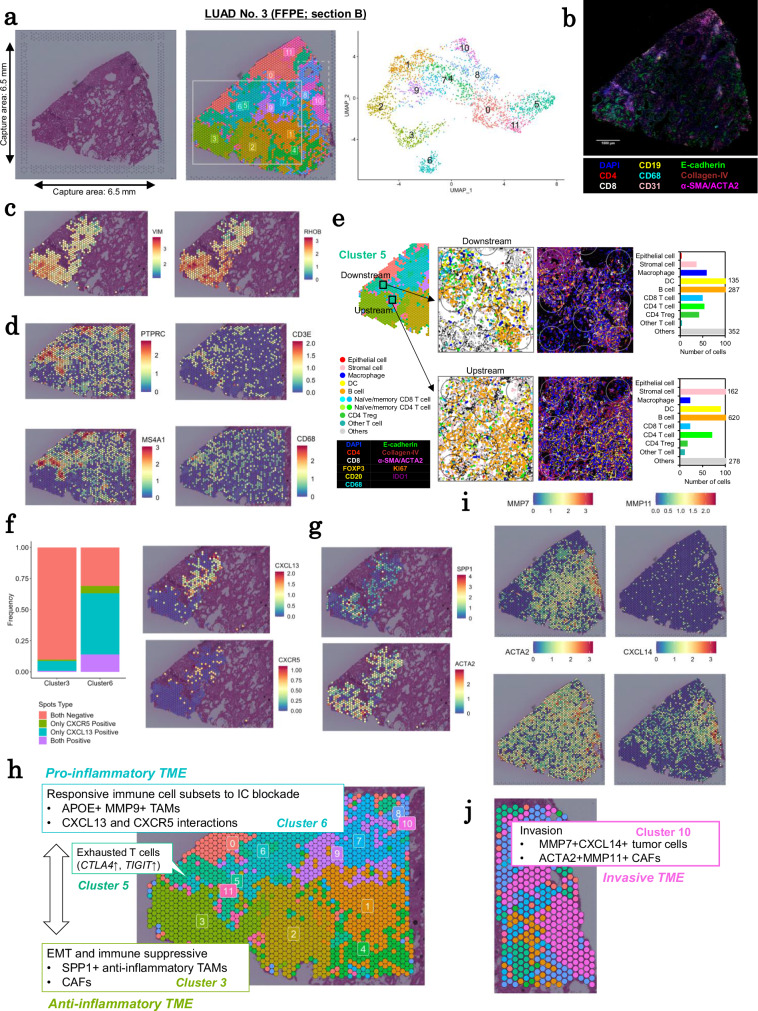
The interaction of tumor cells and their microenvironment is thought to be a key factor in tumor development. We present spatial RNA profiles obtained from 30 lung adenocarcinoma patients at the non-invasive and later invasive stages. We use spatial transcriptome sequencing data in conjunction with in situ RNA profiling to conduct higher resolution analyses. The detailed examination of each case, as well as the subsequent computational analyses based on the observed diverse profiles, reveals that significant changes in the phenotypic appearances of tumor cells are frequently associated with changes in immune cell features. The phenomenon coincides with the induction of a series of cellular expression programs that enable tumor cells to transform and break through the immune cell barrier, allowing them to progress further. The study shows how lung tumors develop through interaction in their microenvironments.


Conflict of interest statement

Competing interests: The authors declare no competing interests.

Figures

Fig. 1
Fig. 1. Overview of the study.
The overall analytical workflow including sample information and the spatial omics platforms used in this study.
Fig. 2
Fig. 2. Spatial transcriptome analysis of LUAD No. 2.
a H&E (left) and results of clustering analysis (middle and right) of LUAD No. 2 FFPE section C. The H&E image shows two regions of interest (ROIs). The capture area that is surrounded by the fiducial frame in the H&E image is 6.5 mm × 6.5 mm. b Violin plots of marker genes in each cluster. The plots for some other markers are also depicted in Supplementary Fig. S4c. c Spatial distribution of the expression levels of NKX2-1 (left) and HNF4A (right). The ROI-1 is represented as a dashed square. d Gene expression levels in the boundary region (ROI-1). e Gene set enrichment analysis on genes that were highly expressed in cluster 6 using Metascape (version 3.5). The p-values were calculated based on the hypergeometric test by Metascape. f Expression of IDO1 and representative cell markers in PhenoCycler immunostaining. Left: ROI-1. Right: an enlarged view of the white square in the left panel. g The spatial distribution of the expression levels of MUC5AC and SPINK1. The ROI-2 is represented as a dashed square. h PhenoCycler immunostaining in the mucin-negative, invasive area. Top: ROI-2. Bottom: an enlarged view of the white square in the top panel. i Expression of CAF markers and representative DEGs in the mucin-negative area (ROI-2). Source data are provided as a Source Data file for (e).
Fig. 3
Fig. 3. Local transitions to invasive phenotypes in LUAD No. 3.
a H&E (left), Visium clustering (middle), and UMAP visualization of the clustering results (right) of LUAD No. 3 FFPE section B. The capture area that is surrounded by the fiducial frame in the H&E is 6.5 mm × 6.5 mm. The spatial plot of the clustering result shows two ROIs. b A representative image of PhenoCycler immunostaining. c Differential expression of EMT-related genes in clusters 3 and 6. d Expression patterns of representative immune cell markers in the immune cell cluster 5. e Integrating Visium and PhenoCycler. Two ROIs in cluster 5 and color legends are shown (left). Cell types determined using PhenoCycler data and signals are shown for ROIs (middle). The number of cells detected in PhenoCycler data is shown for each ROI (right). f Expression distribution of CXCL13–CXCR5 pairs in clusters 3 and 6. The bar plot shows the proportion of spots classified based on CXCL13 and CXCR5 expression patterns. g Expression of SPP1 (macrophages) and ACTA2 (myofibroblast/CAFs) in clusters 3 and 6. h A schematic representation of the molecular characteristics of tumor clusters 3 and 6, as well as immune cell cluster 5, in LUAD No. 3. i Patterns of highly expressed genes in cluster 10. j A schematic representation of the molecular characteristics of cluster 10 in LUAD No. 3. Source data are provided as a Source Data file for (e and f).
Fig. 4
Fig. 4. Cross-case or section TME scoring of local expression features.
a TME scoring of four signatures in section C of LUAD No. 2 FFPE. b TME scoring is used to determine which features appear in each spot of IA sections. c The percentage of each feature of TME scoring in all IA cases. The invasive feature distribution (left) and H&E image (right) for cases LUAD No. 14 in (d) and section B of LUAD No. 3 FFPE in (e). A dashed box represents the region where the invasive feature is enriched. Source data are provided as a Source Data file for (c).
Fig. 5
Fig. 5. Tumor progression with distinct TME landscapes.
a Integrating the transcriptome trajectory with the defined TME features in LUAD No. 2 FFPE section C. The score distribution of each feature and its landscape along the inferred trajectory. Features of tumor cells and their microenvironment are shown in (b and c), respectively. d The positive and negative relationships between TME changes in LUAD No. 2 section C. Each radius represents the length of the tumor cells’ evolutional trajectory line, where correlations were found between respective features, as shown on the X and Y axes. The heat color indicates the degree of the slope on the trajectory line for the specific feature. The left and right hemispheres represent the slopes of the features depicted on the X and Y axes, respectively. For example, the circle marked *1 indicates a positive correlation between “Invasive: c1” and “Fibroblast/CAF: c2.” Here, the association spanned 0.26 parts of the tumor cells’ evolutional trajectory, with slope ratios of 0.026 and 0.028 for the respective features (both features increased as cancer evolved). The circle marker with *2 represents the anti-correlation between “Proliferative; c2” and “B cell; c2” features. e Positive and negative relationships between TME pairs on the eight tumor cell evolutional trajectories of five sections. “cor_st” is the sum of the absolute values of the slopes of the two features. Positive and negative values of “cor_st” indicate that the indicated factors are positively or negatively correlated, respectively. Each color box represents the contribution value of the specified specimen. For more information on the data analysis procedure, see the “Methods” section. The observed key positive and negative correlations are highlighted in red and blue letters, respectively. Source data are provided as a Source Data file for (d and e).
Fig. 6
Fig. 6. Spatial and single-cell characterization of TME in LUAD No. 2.
a Spatial (upper) and UMAP (lower) plots of Xenium in LUAD No. 2 FFPE. b The spatial expression patterns of NKX2-1 and HNF4A in Xenium data. c Boundary region of NKX2-1 and HNF4A-positive tumors at the single-cell level. Each plot represents mRNA molecules. d Deconvolution analysis of Visium data using Xenium. e Microenvironment statuses of the boundary region between NKX2-1- and HNF4A-positive regions at the single-cell level. f Association between tumor cells and adjacent CAFs at the single-cell level in the invasive region. All image plots in (ac, e, and f) were flipped to match the orientation of Visium.
Fig. 7
Fig. 7. TME characterization of very early cases.
a The proportion of each TME scoring feature across all sections. The data from IA cases were the same as those in Fig. 4c. b The highest local enrichment scores of proliferative and invasive signatures in each section were compared between early (AIS/MIA) and IA cases (n = 28 and 16 sections from AIS/MIA and IA, respectively). The p-values in the inset were calculated using the Wilcoxon rank sum test (two-sided, no multiple comparison adjustments). c A “possibly malignant-invasive” region in TSU-33 (left) and genes associated with immune cell existence (right). All four genes showed significantly higher expression in “possibly malignant-invasive” regions. d A “possibly malignant-invasive” region in TSU-30 (left) and genes associated with macrophages and fibrosis (right). CD68 is a macrophage marker. The other three genes showed significantly higher expression in “possibly malignant-invasive” regions. e, f The microenvironment statuses of “possibly malignant-invasive” regions of TSU-27 and TSU-30. The spatial expression pattern of CD68 is shown (left). A plot of RNA molecules of representative genes around the “possibly malignant-invasive” region (yellow in the left panel) is shown (right). Image plots were rotated and flipped to match the orientation of Visium. g The microenvironment statuses of the “possibly malignant-invasive” region of TSU-33. The spatial expression pattern of CD19 is shown (left). A plot of RNA molecules of representative genes in the boundary of differentiated tumors and the “possibly malignant-invasive” region (yellow in the left panel) is shown (right). Image plots were rotated and flipped to match the orientation of Visium. h Comparison of FABP4 and SPP1 expression in “possibly malignant” regions between AIS/MIA and IA cases in Visium. Each “possibly malignant” region is shown with its average expression levels. i A conceptual representation of TME conditions in early (AIS/MIA) and invasive (IA) cases. Source data are provided as a Source Data file for (a, b, and h).

References

    1. Junttila, M. R. & De Sauvage, F. J. Influence of tumour micro-environment heterogeneity on therapeutic response. Nature501, 346–354 (2013). - PubMed
    1. Chen, Y., McAndrews, K. M. & Kalluri, R. Clinical and therapeutic relevance of cancer-associated fibroblasts. Nat. Rev. Clin. Oncol.18, 792–804 (2021). - PMC - PubMed
    1. Paijens, S. T., Vledder, A., de Bruyn, M. & Nijman, H. W. Tumor-infiltrating lymphocytes in the immunotherapy era. Cell. Mol. Immunol.18, 842–859 (2021). - PMC - PubMed
    1. Hinshaw, D. C. & Shevde, L. A. The tumor microenvironment innately modulates cancer progression. Cancer Res.79, 4557–4566 (2019). - PMC - PubMed
    1. Sautès-Fridman, C., Petitprez, F., Calderaro, J. & Fridman, W. H. Tertiary lymphoid structures in the era of cancer immunotherapy. Nat. Rev. Cancer19, 307–325 (2019). - PubMed

Publication types

LinkOut - more resources