. 2024 Dec 5;15(1):10574.
doi: 10.1038/s41467-024-53768-3.

Fine-tuning levels of filamins a and b as a specific mechanism sustaining Th2 lymphocyte functions

Affiliations

Fine-tuning levels of filamins a and b as a specific mechanism sustaining Th2 lymphocyte functions

Kilian Maire et al. Nat Commun. .

Abstract

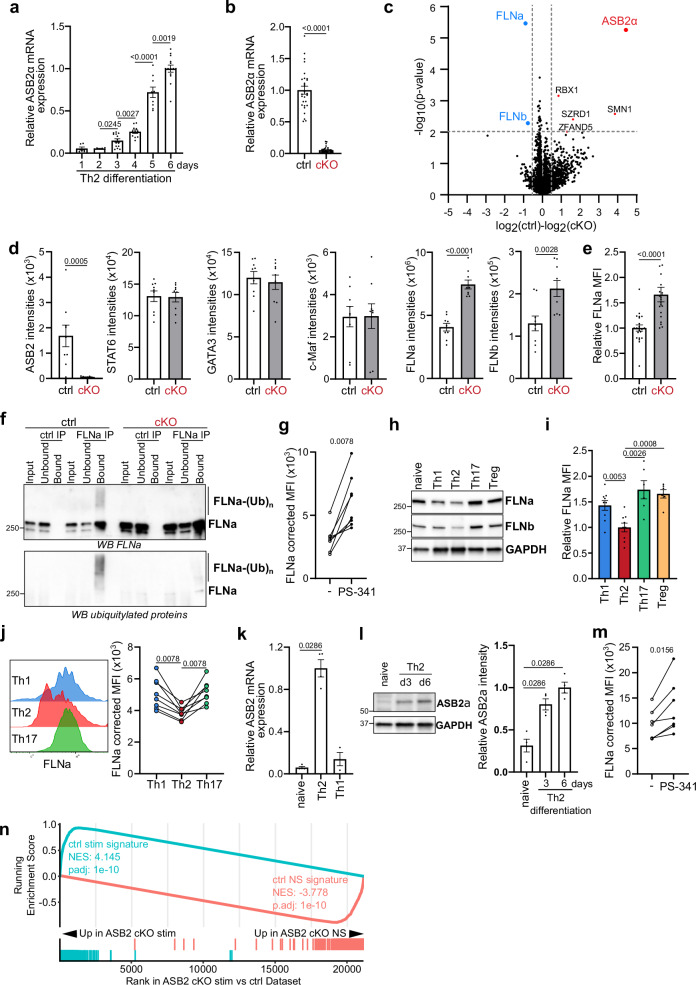
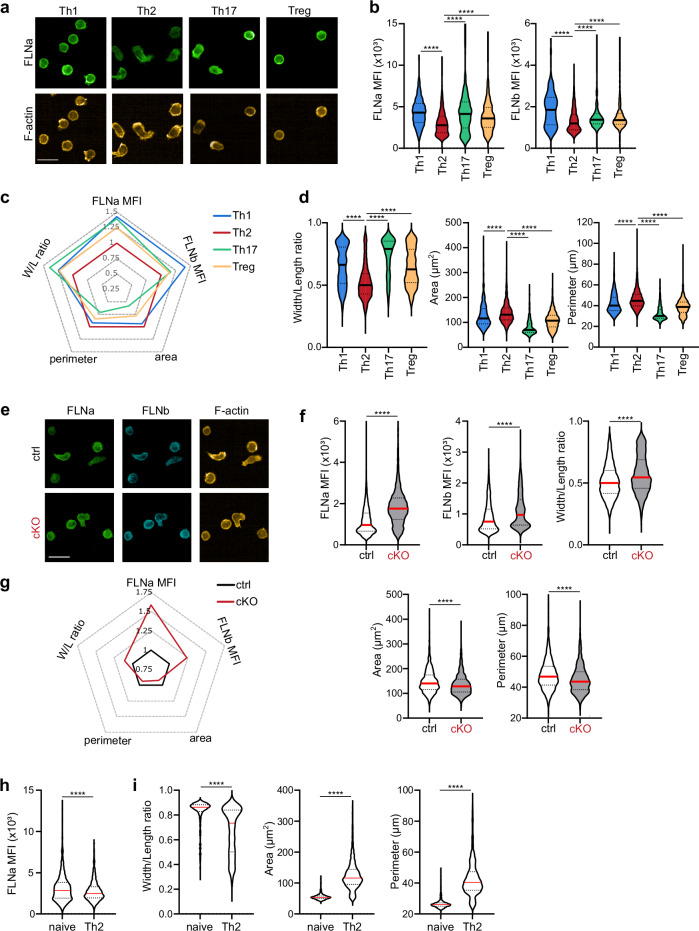
Augmenting the portfolio of therapeutics for type 2-driven diseases is crucial to address unmet clinical needs and to design personalized treatment schemes. An attractive therapy for such diseases would consist in targeting the recruitment of T helper 2 (Th2) lymphocytes to inflammatory sites. Herein, we show the degradation of filamins (FLN) a and b by the ASB2α E3 ubiquitin ligase as a mechanism sustaining Th2 lymphocyte functions. Low levels of FLNa and FLNb confer an elongated shape to Th2 lymphocytes associated with efficient αVβ3 integrin-dependent cell migration. Genes encoding the αVβ3 integrin and ASB2α belong to the core of Th2-specific genes. Using genetically modified mice, we find that increasing the levels of FLNa and FLNb in Th2 lymphocytes reduces airway inflammation through diminished Th2 lymphocyte recruitment in inflamed lungs. Collectively, our results highlight ASB2α and its substrates FLNa and FLNb to alter Th2 lymphocyte-mediated responses.


Conflict of interest statement

Competing interests: A.S. is an employee of Sanofi. The remaining authors declare no competing interests.

Figures

Fig. 1
Fig. 1. FLNa and FLNb are substrates of ASB2α in mouse Th2 lymphocytes.
a Relative expression of ASB2α transcripts during Th2 differentiation of naive CD4+ T lymphocytes of ctrl mice assessed by RT-qPCR. b Expression of ASB2α transcripts in ctrl and ASB2 cKO Th2 lymphocytes assessed by RT-qPCR. c, d Mass spectrometry quantitative analyses of protein abundance differences between cell extracts of ctrl and ASB2 cKO Th2 lymphocytes. The volcano plot (c) illustrates for each protein the statistical significance of the variation as a function of the amplitude of the abundance (log2) difference between the two conditions. Dashed lines indicate cut-off values corresponding respectively to a Student t-test p value of 0.01 and a log2-transformed intensity difference of 0.5. Bar plots (d) show the intensities of ASB2, STAT6, GATA3, c-MAF, FLNa, and FLNb in each condition based on the MS measurements. Full data are presented in Supplementary Data 1. e Expression of FLNa was analyzed by intracellular flow cytometry in ctrl and ASB2 cKO Th2 lymphocytes. f Cell extracts of ctrl and ASB2 cKO Th2 lymphocytes were immunoprecipitated with control (Ctrl IP) or anti-FLNa (FLNa IP) antibodies. Pre-cleared cell lysates (input), unbound, and bound fractions were immunoblotted with antibodies to FLNa. After stripping, the blot was reprobed with antibodies to ubiquitylated proteins. One experiment out of two is shown. g Expression of FLNa was analyzed by intracellular flow cytometry in ctrl Th2 lymphocytes treated at day 5 with the PS-341 proteasome inhibitor at 4 nM during 20 h. h Expression of FLNa and FLNb was analyzed by western blot in naive CD4+ T cells, Th1, Th2, Th17, and Treg cells generated from naive CD4+ T lymphocytes of ctrl mice. i Expression of FLNa was analyzed by intracellular flow cytometry in Th1, Th2, Th17, and Treg cells generated from naive CD4+ T lymphocytes of ctrl mice. j Representative flow cytometry and quantification of FLNa expression in Th1 (CD4+CXCR3+CCR6), Th2 (CD4+CXCR3CCR6CRTH2+) and Th17 (CD4+CXCR3CCR6+) lymphocytes of human PBMCs. k Relative expression of ASB2 transcripts in naive human CD4+ T lymphocytes and after 5 days of culture in a Th2 or Th1 polarizing medium assessed by RT-qPCR. l Expression of ASB2α was analyzed by western blot in naive human CD4+ T lymphocytes and after 3 and 6 days of culture in a Th2 polarizing medium. m Expression of FLNa was analyzed by intracellular flow cytometry in human Th2 lymphocytes treated at day 5 with the PS-341 proteasome inhibitor at 10 nM during 20 h. n Gene set enrichment analyses of genes significantly up- and down-regulated in ctrl Th2 lymphocytes upon stimulation performed using transcriptomes of stimulated vs non-stimulated ASB2 cKO Th2 lymphocytes. Data are mean ± SEM of biological replicates. Sample size, d1 = 6, d2 = 6, d3 = 14, d4 = 11, d5 = 9 and d6 = 14 for (a); ctrl = 28 and cKO = 32 for (b); ctrl = 9 and cKO = 9 for (c); ctrl = 9 and cKO = 9 for (d); ctrl = 22 and cKO = 21 for (e); ctrl = 8 for (g); Th1 = 9, Th2 = 9, Th17 = 6 and Treg = 6 for (i); n = 8 for (j); naive = 4, Th2 = 4 and Th1 = 3 for (k); n = 4 for (l); and n = 7 for (m). p values were calculated using the two-sided Mann–Whitney t-test except in (g, j, m) where the Wilcoxon matched-pairs signed rank test was used. Source data are provided as a Source Data file.
Fig. 2
Fig. 2. ASB2α-mediated degradation of FLNa and FLNb confers specific morphological features to Th2 lymphocytes.
ad Th1, Th2, Th17, and Treg ctrl lymphocytes were seeded onto VCAM-1 coated 384-well plates and analyzed by immunofluorescence with antibodies to FLNa and FLNb or phalloidin. Representative fluorescent images of one experiment out of 3 (a), FLNa MFI and FLNb MFI (b), radar plot with FLNa MFI, FLNb MFI, cell area, cell perimeter, and width to length ratio (relative to the values measured in Th2 lymphocytes) (c) and violin plots of cell area, cell perimeter and width to length ratio (d) are shown. eg Ctrl and ASB2 cKO Th2 lymphocytes were allowed to adhere in 384-well plates coated with vitronectin, fixed, and stained for FLNa, FLNb, and F-actin. Representative fluorescent images of one experiment out of 4 (e), radar plot with FLNa MFI, FLNb MFI, cell area, cell perimeter, and width-to-length ratio (relative to the values measured in ctrl Th2 lymphocytes) (f), and violin plots with FLNa MFI, FLNb MFI, cell area, cell perimeter and width to length ratio (g) are shown. h, i Human naive CD4 + T lymphocytes and in vitro generated Th2 lymphocytes were seeded onto VCAM-1 coated 384-well plates and analyzed by immunofluorescence with antibodies to FLNa or phalloidin. Violin plots of FLNa MFI (h), cell area, cell perimeter, and width-to-length ratio (i) are shown. Scale bar, 20 µm. Data are mean ± SEM. Sample size: Th1 = 2097, Th2 = 3397, Th17 = 1284 and Treg = 1918 for (b) (left); Th1 = 222, Th2 = 660, Th17 = 750 and Treg = 951 for (b) (right); Th1 = 1002, Th2 = 2405, Th17 = 486 and Treg = 560 for (d) (left); ctrl = 7189 and cKO = 6878 for (f) (FLNa MFI); ctrl = 5159 and cKO = 3139 for (f) (FLNb MFI); ctrl = 2589 and cKO = 1605 for (f) (width/length ratio, area, perimeter); naive = 1141 and Th2 = 1137 for i. p values were calculated using the two-sided Mann–Whitney t-test except in (g, j) where the Wilcoxon matched-pairs signed rank test was used. Source data are provided as a Source Data file.
Fig. 3
Fig. 3. ASB2, ITGAV, and ITGB3 are Th2-specific genes.
a Mass spectrometry semi-quantitative analyses of integrin abundance in cell extracts of ctrl and ASB2 cKO Th2 lymphocytes (n = 9 replicates). Full data are presented in Supplementary Data 1. b Heatmap showing the expression of genes encoding the α and β integrin subunits (ITGA and ITGB, respectively) in naive, Th2, Th1, and Th17 cells (analyzed from ref. ). RPKM intensities were log10 transformed and are displayed as colors ranging from blue to red as shown in the key. c RNA polymerase II (Pol II), H3K27ac, H3K4me1 and H3K27me3 signals across the ASB2, ITGAV and ITGB3 loci. The identified cis-regulatory regions are highlighted (GSE144586); d Representative flow cytometry and quantification of cell surface expression of αV and β3 integrin subunits in naive CD4+ T cells and in Th1 (CD4+CXCR3+CCR6CRTH2FoxP3), Th2 (CD4+CXCR3CCR6CRTH2+FoxP3), Th17 (CD4+CXCR3CCR6+CRTH2FoxP3) and Treg (CD4+CXCR3CCR6CRTH2FoxP3+) lymphocytes of human PBMCs. e Quantification of cell surface expression of αV and β3 integrin subunits in naive and in vitro generated human Th2 lymphocytes. Data are mean ± SEM of biological replicates. Sample size: ctrl = 9 and cKO = 9 for (a); n = 6 for (d); and n = 4 for (e). p values were calculated using the two-sided Mann–Whitney t-test except in (d) where the Wilcoxon matched-pairs signed rank test was used. Source data are provided as a Source Data file.
Fig. 4
Fig. 4. ASB2α-mediated degradation of FLNa and FLNb confers specific migration properties to Th2 lymphocytes.
Ctrl and ASB2 cKO Th2 lymphocytes seeded onto vitronectin-coated slides were imaged by time-lapse microscopy. Representative images (left) and individual tracks (right) of one experiment out of 5 (a), percentages of migrating cells (b), track length (c), mean scanned area (d), persistence coefficient (e), average velocities of all the cells (left panel) or cells with a track length > 50 µm (right panel) (f), elongation coefficient and average sphericity (g) are shown. Scatter plots showing correlation data for elongation coefficient and track length (h) or average velocity (i) of ctrl or ASB2 cKO Th2 lymphocytes. Linear regression-fit curves are shown as red lines. Scale bar, 20 µm. In (ag), Data are mean ± SEM of 5 biological replicates. Sample size: ctrl = 1070 and cKO = 916 for (c); ctrl = 1070 and cKO = 916 for (d); ctrl = 1070 and cKO = 916 for (e); ctrl = 1070 and cKO = 916 for (f) (left); ctrl = 685 and cKO = 470 for (f) (right); ctrl = 92,674 and cKO = 85,399 for (g); ctrl = 1070 and cKO = 916 for (h); and ctrl = 1070 and cKO = 916 for (i). p values were calculated using the two-sided Mann–Whitney t-test. In (h, i), correlations between nonparametric variables were evaluated using Spearman rank correlation test (r). Source data are provided as a Source Data file.
Fig. 5
Fig. 5. Migration properties of ctrl and ASB2 cKO Th2 lymphocytes following MnCl2-induced integrin activation or αVβ3 inhibition.
Ctrl and ASB2 cKO Th2 lymphocytes were either untreated or treated with MnCl2 (ad) and treated with anti-αV and anti-β3 integrin blocking antibodies (Ab) or their corresponding isotypic controls (iso) (eh), and allowed to migrate onto vitronectin-coated slides. Cells were imaged by time-lapse microscopy. Individual tracks (a, e), percentages of migrating cells (b, f), track length (c, g), average velocities of all the cells (d, h) are shown. Data are mean ± SEM of 4 and 5 biological replicates for ctrl and cKO Th2 lymphocytes respectively. Sample size: ctrl = 1809, ctrl+MnCl2 = 2344, cKO = 1611, and cKO + MnCl2 = 1717 for (c, d); and ctrl + iso = 2768, ctrl +Ab  = 2803, cKO + iso = 2261, and cKO + Ab = 1989 for (g, h). p values were calculated using the two-sided Mann–Whitney t-test. Source data are provided as a Source Data file.
Fig. 6
Fig. 6. Deletion of ASB2 in hematopoietic cells attenuates OVA-airway inflammation in mice.
Ctrl and ASB2 cKO mice were submitted to OVA-airway inflammation (OVA) as indicated in the online methods. Ctrl mice treated with PBS were used as controls. a Inflammation of the lungs assessed using hematoxylin and eosin (HE) staining of lung sections to analyze the infiltration of inflammatory cells (0–12-point scale), Masson’s trichrome (MT) staining of lung sections to visualize and quantify collagen deposits (µm2/µm) (collagen area/bronchus perimeter), and periodic acid Schiff (PAS) staining to visualize and quantify mucus production. b Data represents the numbers of CD45+ cells in the lungs. c Numbers of CD45+Siglec-F+CD11c (eosinophils, left panel) and CD45+Siglec-F+CD11c+ (alveolar macrophages; right panel). Representative flow cytometry plots for CD11c and Siglec-F within a CD45+ gated (middle panel) in the lungs of OVA-treated mice. d Relative expression of eotaxin 2 mRNA in the lung lysates assessed by RT-qPCR. e Numbers of CD45+CD4+ in the lungs. f Percentage of ST2+ cells in CD4+ cells, representative flow cytometry plots for ST2 and CD4 within a CD4+ gate, and numbers of CD45+CD4+ST2+ in the lungs. g Data represents the percentage of CD4+ in CD45+ cells and the percentage of ST2+ in CD4+ cells in the BAL fluids. h Relative expression of IL-4, IL-5 and IL-13 mRNA in the lung lysates. i Data represents the percentage of IL-4+, IL-5+ or IL-13+ in CD4+ cells and in ST2+CD4+ cells in the lungs. j Production of IL-4, IL-5, and IL-13 measured by ELISA after antigen restimulation (OVA) or not (−) of cells of the lung draining lymph nodes of mice submitted to OVA-induced airway inflammation. k Expression of FLNa was analyzed by intracellular flow cytometry in CD45+CD4+ST2+ cells from the lungs of ctrl or ASB2 cKO mice submitted to OVA-induced airway inflammation. l Intensities of FLNa calculated using MaxQuant quantitative metrics in cell extracts of CD45+CD4+ST2+ living cells sorted from the lungs of control or ASB2 cKO mice submitted to OVA-induced airway inflammation. Data are mean ± SEM of biological replicates. Sample size: ctrl+PBS = 6, ctrl + OVA = 14, and cKO + OVA = 17 for (a) (histological score); ctrl+PBS = 3, ctrl + OVA = 14, and cKO + OVA = 17 for (a) (PAS+ bronchi); ctrl + PBS = 3, ctrl + OVA = 10, and cKO + OVA = 15 for (a) (collagen deposition-left); ctrl + PBS = 30, ctrl + OVA = 249, and cKO + OVA = 275 for (a) (collagen deposition-right); ctrl + PBS = 6, ctrl + OVA = 34, and cKO + OVA = 33 for (b); ctrl + PBS = 5, ctrl + OVA = 26, and cKO + OVA = 28 for (c); ctrl + OVA = 19 and cKO + OVA = 22 for (d); ctrl + PBS = 6, ctrl + OVA = 32, and cKO + OVA = 31 for (e); ctrl + PBS = 5, ctrl + OVA = 25, and cKO + OVA = 24 for (f); ctrl + OVA = 21 and cKO + OVA = 27 for (g) (left); ctrl + OVA = 10 and cKO + OVA = 12 for (g) (right); ctrl + OVA = 20 and cKO + OVA = 24 for (h); ctrl + OVA = 14 and cKO + OVA = 14 for (i) (left); ctrl + OVA = 14 and cKO + OVA = 14 for (i) (middle); ctrl + OVA = 9 and cKO + OVA = 8 for (i) (right); ctrl + OVA = 7 and cKO + OVA = 8 for (j); ctrl + OVA = 20 and cKO + OVA = 19 for (k); and ctrl + OVA = 3 and cKO + OVA = 3 for (l). p values were calculated using the two-sided Mann–Whitney t-test. Scale bar, 200 µm. Source data are provided as a Source Data file.
Fig. 7
Fig. 7. Deletion of ASB2 in hematopoietic cells attenuates HDM-asthma in mice and intrinsic loss of ASB2 in Th2 cells is sufficient to impede airway inflammation.
ag Ctrl and ASB2 cKO mice were submitted to HDM-allergic airway inflammation (HDM) as indicated. a HE, MT, and PAS staining of lung sections to analyze the infiltration of inflammatory cells and inflammatory scores. b Data represents the numbers of CD45+ cells in the lungs. c Data represents the numbers and the percentages of Siglec-F+CD11c in CD45+ cells in the lungs. d Data represents the percentages of Siglec-F+CD11c in CD45+ cells in the BAL fluids. e Data represents the numbers of CD4+CD45+ cells, the percentages of ST2+ in CD4+ cells, and the numbers of ST2+CD4+CD45+ cells in the lungs. f Data represents the percentages of CD4+ in CD45+ cells and the percentages of ST2+ in CD4+ cells in the BAL fluids. g Expression of FLNa was analyzed by intracellular flow cytometry in CD45+CD4+ST2+ cells from the lungs of ctrl or ASB2 cKO mice submitted to HDM-induced asthma. hq OVA-specific Th2 lymphocytes generated from control or ASB2 cKO OT2 mice were transferred to C57Bl/6 recipients that were subsequently submitted to daily OVA inhalations to induce airway inflammation. Analysis was performed 24 h after the 5th (H, O) or after the 1st OVA inhalation (p, q). h HE staining of lung sections. i MT staining of lung sections. j PAS staining of lung sections. k Data represents the numbers of CD45+ in the lungs. l Data represents the numbers and the percentages of Siglec-F+CD11c in CD45+ cells in the lungs. m Data represents the percentages of Siglec-F+CD11c in CD45+ cells in the BAL fluids. n Data represents the numbers of Vβ5+Vα2+CD4+CD45+ cells in the lungs. o Data represents the percentages of Vβ5+Vα2+ in CD4+ cells in the lungs and the BAL fluids. p Data represents the numbers of Vβ5+Vα2+CD4+CD45+ cells in the lungs. q Data represents the percentages of Vβ5+Vα2+ in CD4+ cells in the lungs and the BAL fluids. Data are mean ± SEM of biological replicates. Sample size: ctrl = 12 and cKO = 12 for (ac); ctrl = 12 and cKO = 10 for (d); ctrl = 12 and cKO = 12 for (e); ctrl = 12 and cKO = 10 for (f); ctrl = 12 and cKO = 12 for (g); ctrl = 10 and cKO = 6 for (k); ctrl = 9 and cKO = 6 for (l); ctrl = 10 and cKO = 6 for (m, n); ctrl = 10 and cKO = 6 for (o) (left); ctrl = 8 and cKO = 4 for (o) (right); ctrl = 16 and cKO = 12 for (p); ctrl = 16 and cKO = 12 for (q) (left); and ctrl = 5 and cKO = 4 for (q) (right). p values were calculated using the two-sided Mann–Whitney t-test. Scale bar, 200 µm. Source data are provided as a Source Data file.

References

    1. Muehling, L. M., Lawrence, M. G. & Woodfolk, J. A. Pathogenic CD4(+) T cells in patients with asthma. J. Allergy Clin. Immunol.140, 1523–1540 (2017). - PMC - PubMed
    1. Vieira Braga, F. A. et al. A cellular census of human lungs identifies novel cell states in health and in asthma. Nat. Med.25, 1153–1163 (2019). - PubMed
    1. Gandhi, N. A. et al. Targeting key proximal drivers of type 2 inflammation in disease. Nat. Rev. Drug Discov.15, 35–50 (2016). - PubMed
    1. Kolkhir, P. et al. Type 2 chronic inflammatory diseases: targets, therapies and unmet needs. Nat. Rev. Drug Discov.22, 743–767 (2023). - PubMed
    1. Krummel, M. F., Bartumeus, F. & Gérard, A. T cell migration, search strategies and mechanisms. Nat. Rev. Immunol.16, 193–201 (2016). - PMC - PubMed

Publication types

Associated data