. 2024 Dec 6;15(1):10635.
doi: 10.1038/s41467-024-54877-9.

Intratumoral delivery of lipid nanoparticle-formulated mRNA encoding IL-21, IL-7, and 4-1BBL induces systemic anti-tumor immunity

Affiliations

Intratumoral delivery of lipid nanoparticle-formulated mRNA encoding IL-21, IL-7, and 4-1BBL induces systemic anti-tumor immunity

Ahmed E I Hamouda et al. Nat Commun. .

Abstract

Local delivery of mRNA-based immunotherapy offers a promising avenue as it enables the production of specific immunomodulatory proteins that can stimulate the immune system to recognize and eliminate cancer cells while limiting systemic exposure and toxicities. Here, we develop and employ lipid-based nanoparticles (LNPs) to intratumorally deliver an mRNA mixture encoding the cytokines interleukin (IL)-21 and IL-7 and the immunostimulatory molecule 4-1BB ligand (Triplet LNP). IL-21 synergy with IL-7 and 4-1BBL leads to a profound increase in the frequency of tumor-infiltrating CD8+ T cells and their capacity to produce granzyme B and IFN-γ, leading to tumor eradication and the development of long-term immunological memory. Mechanistically, the efficacy of the Triplet LNP depends on tumor-draining lymph nodes to tumor CD8+ T-cell trafficking. Moreover, we highlight the therapeutic potential of the Triplet LNP in multiple tumor models in female mice and its superior therapeutic efficacy to immune checkpoint blockade. Ultimately, the expression of these immunomodulators is associated with better overall survival in patients with cancer.


Conflict of interest statement

Competing interests: J.F., E.B., S.D.K., and F.L. are employees of etherna. J.F., E.B., S.D.K., and F.L. have applied for a patent related to the study (Compositions and methods for delivery of agents to immune cells; WO2023118411A1). S.D.K. and B.G.D.G. have applied for a patent related to the ionizable lipids used in this work (Ionizable lipids; WO2022136641A1). All other authors declare no potential conflicts of interest.

Figures
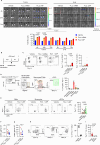
Fig. 1
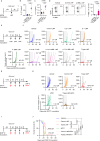
Fig. 1. Intratumoral injection of LNP-formulated mRNA leads to efficient protein expression by myeloid and cancer cells.
A Images and bar graph show in vivo bioluminescence of luciferin over 72 h in MC38 tumor following a single intratumoral administration of vehicle (n = 4 animals), naked luciferase mRNA (n = 5 animals) or LNP-formulated luciferase mRNA (n = 5 animals). B Schematic outline of experimental procedures. C Representative flow cytometry plots and bar graphs show the frequency of Thy1.1+ CD45+ and Thy1.1+ CD45- cells in subcutaneous MC38 tumors 24 h post intratumoral injection of vehicle (n = 8 animals), naked Thy1.1 mRNA (n = 5 animals), or Thy1.1 LNP (n = 10 animals). D Gating strategy and bar graph show the frequency of myeloid cell subsets within Thy1.1+ CD45+ cells in the tumor (n = 10 animals). E Representative flow cytometry plots and graph show the frequency of Thy1.1+ cells within TAMs, monocytes, and cDC2s in the tumor (n = 10 animals). Graphs show gMFI of (F) CCR7 and (G) CD80 in Thy1.1+ and Thy1.1- cDC2s in the tumor (n = 5 animals). H Representative flow cytometry plots and scatter plot show the frequency of migDC and resDC within Thy1.1+ cDC2s in the tdLN (n = 5 animals). I Bar graph shows the frequency of live Thy1.1+ cells in the tumor, tdLN, and spleen (n = 10 animals). Bars and horizontal lines show mean. Error bars indicate SEM. A Two-way ANOVA followed by Šídák’s multiple comparisons test, C, I one-way ANOVA followed by post hoc Tukey’s multiple comparisons test, E repeated measures one-way ANOVA followed by Holm-Šídák’s multiple comparisons test, F, G one-tailed Wilcoxon matched pairs signed rank test and (H) one-tailed unpaired t test were performed. Data shown in (BD), and (H) are pooled from two independent experiments. Source data are provided as a Source Data file. gMFI, geometric mean fluorescence intensity; SEM, standard error of mean; TAMs, tumor-associated macrophages; tdLN, tumor-draining lymph nodes.
Fig. 2
Fig. 2. Triplet LNP eradicates tumors across multiple preclinical models.
A Schematic outline of experimental procedures. Scatter plots show the concentration of (B) IL-21 and (C) IL-7 in MC38 tumor supernatants 4 h post intratumoral injection of vehicle (n = 8 animals), control LNP (n = 8 animals), or cytokine LNP (n = 4 animals). D Representative flow cytometry plots and bar graph show the frequency of live 4-1BBL+ cells in subcutaneous MC38 tumor 24 h post intratumoral injection of vehicle (n = 4 animals), control LNP (n = 4 animals), or 4-1BBL LNP (n = 5 animals). E Schematic outline of experimental procedures. F MC38 tumor individual growth curves of mice treated with vehicle, control LNP, IL-21 LNP, IL-7 LNP, 4-1BBL LNP, IL-21/IL-7 LNP, IL-21/4-1BBL LNP, IL-7/4-1BBL LNP and Triplet LNP (n = 7 animals/group). Vertical dotted lines indicate intratumoral injections. G Schematic outline of experimental procedures. H E0771 tumor individual growth curves of mice treated with vehicle (n = 12 animals), control LNP (n = 11 animals), Triplet LNP (n = 12 animals), anti-PD1 (n = 12 animals) and Triplet LNP/anti-PD1 (n = 12 animals). Vertical dotted lines indicate intratumoral injections. I Schematic outline of experimental procedures. J Survival curve of subcutaneous B16F10 tumor-bearing mice treated with vehicle, isotype control, control LNP/isotype control, Triplet LNP/isotype control, anti-PD1, control LNP/anti-PD1, and Triplet LNP/anti-PD1 (n = 10 animals/group). BD One-way ANOVA followed by post hoc Tukey’s multiple comparisons test and (J) log-rank (Mantel-Cox) test were performed. Data shown in (H) is pooled from two independent experiments. Bars and horizontal lines show mean. Error bars indicate SEM. Source data are provided as a Source Data file. CR, complete regressor; SEM, standard error of mean.
Fig. 3
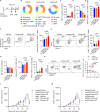
Fig. 3. Triplet LNP promotes intratumoral CD8+ T-cell infiltration and activation.
A Schematic outline of experimental procedures. B Pie charts show the mean frequency of immune subsets within CD45+ cells in the tumor of vehicle-, control LNP- or Triplet LNP-treated mice quantified using flow cytometry (n = 7 animals/group). Bar graphs show the frequency of (C) CD8+ T cells, (D) TAMs, (E) CD44hi CD62Llo CD8+ T cells, (F) Granzyme B+ CD8+ T cells, (G) IFN-γ+ TNF-α+ CD8+ T cells, (H) NK cells (I) Granzyme B+ NK cells within MC38 tumors treated with vehicle, control LNP or Triplet LNP (n = 7 animals/group) and (J) IFN-γ+ TNF-α+ NK cells within MC38 tumors treated with vehicle (n = 7 animals), control LNP (n = 7 animals) or Triplet LNP (n = 6 animals). K Representative flow cytometry plots and graph show the frequency of CD39+ CX3CR1+ CD8+ T cells over time in the blood of vehicle (n = 5 animals), control LNP (n = 5 animals), and Triplet LNP-treated mice (n = 6 animals). MC38 tumor growth curves upon (L) isotype or αNK1.1 administration (isotype/vehicle n = 5 animals; isotype/control LNP n = 5 animals; isotype/triplet LNP n = 6 animals; αNK1.1/vehicle n = 5 animals; αNK1.1/control LNP n = 5 animals; αNK1.1/triplet LNP n = 6 animals) and (M) isotype or αCD8 administration (isotype/vehicle n = 9 animals; isotype/control LNP n = 9 animals; isotype/triplet LNP n = 12 animals; αCD8/vehicle n = 10 animals; αCD8/control LNP n = 10 animals; αCD8/triplet LNP n = 12 animals). CJ One-way ANOVA followed by post hoc Tukey’s multiple comparisons test and (KM) repeated measures two-way ANOVA followed by post hoc Tukey’s multiple comparisons test were performed. Data shown in (BJ) are representative of three independent experiments. Data shown in (K) is representative of two independent experiments. Data shown in (M) is pooled from two independent experiments. Bars and horizontal lines show mean. Error bars indicate SEM. Source data are provided as a Source Data file. SEM, standard error of mean; TAMs, tumor-associated macrophages.
Fig. 4
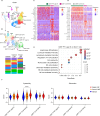
Fig. 4. Triplet LNP alters the relative abundance of CD8+ T-cell subsets within the TME.
A UMAP plot of CITE-seq dataset containing 30208 CD45+ sorted cells from MC38 tumors of vehicle, control LNP, and Triplet LNP-treated mice (n = 5 animals/group). B High-resolution subclustering of the T-cell compartment of the dataset is shown. Bars show the frequency of different T-cell subsets in the tumor dataset across different treatments. C Heatmap of the top 10 differentially expressed genes in the CD8T Prf1 Lag3 hi, CD8T Ccl3 Nr4a3 and CD8T Ccr2 Gzma clusters. D Heatmap of the top 10 differentially expressed proteins in the CD8T Prf1 Lag3 hi, CD8T Ccl3 Nr4a3 and CD8T Ccr2 Gzma clusters. E GO term enrichment analysis of the differentially upregulated genes in the CD8T Prf1 Lag3 hi cluster in comparison to all other T-cell clusters in the tumor dataset. F Violin plots show combined mean expression values for the indicated genes (score) for the cytotoxic T cell markers (Gzma, Gzmb, Prf1, Tnf, Ifng, Cxcr6) or exhaustion markers (Pdcd1, Ctla4, Tigit, Lag3, Havcr1, Tox, Nrp1) in cells of the CD8T Prf1 Lag3 hi, CD8T Ccl3 Nr4a3 and CD8T Ccr2 Gzma clusters in vehicle-, control LNP- and Triplet LNP-treated mice. One-way ANOVA followed by post hoc Tukey’s multiple comparisons test was performed. Source data for (F) are provided as a Source Data file. GO, gene ontology; UMAP, uniform manifold approximation and projection.
Fig. 5
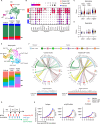
Fig. 5. Triplet LNP improves myeloid-CD8+ T-cell interactions.
A UMAP plot shows high-resolution clustering of the DC compartment in the CITE-seq dataset of the tumor. Bars show the frequency of different DC subsets in the tumor dataset across different treatments. B Dot plot highlights differentially expressed genes associated with maturation, regulation, and migration in distinct DC clusters of the tumor CITE-seq dataset across different treatments. Dot size represents the percentage of cells expressing the gene and color gradient represents average scaled expression within a cell cluster. Violin plots show combined mean expression values for the indicated genes (score) for (C) maturation markers (Cd40, Cd80, Cd86, Relb, Cd83) and (D) regulation (Axl, Ccl19, Ccl22, Aldh1a1) in cells of the DC clusters in vehicle-, control LNP- and Triplet LNP-treated mice. One-way ANOVA followed by post hoc Tukey’s multiple comparisons test was performed. E UMAP plot shows high-resolution clustering of the neutrophil compartment in the tumor CITE-seq dataset. Bars show the relative abundance of the different neutrophil subsets in the tumor CITE-seq dataset across different treatments. F Circle plot shows links between top predicted ligands for migDC, cDC2, cDC2 prolif, Mac Folr2, Mac MHC-II-hi, Mac, Mono, Neutro IFN, and the Neutro clusters and their associated receptors found on CD8+ T cells within the control niche and Triplet LNP niche of the tumor CITE-seq dataset. The transparency of the linking arrow reflects the prioritization score of the ligand-receptor pair. The heatmaps below show the scaled average expression level of the top target genes that are potentially regulated by the predicted ligand-receptor pairs. G Schematic outline of experimental procedures. H MC38 tumor growth curves upon isotype/control diet or αLy6G or PLX5622 diet administration (n = 6 animals/group). Repeated measures two-way ANOVA followed by post hoc Tukey’s multiple comparisons test were performed. Error bars indicate SEM. Source data for (C, D, H) are provided as a Source Data file. CITE, cellular indexing of transcriptomes and epitopes by sequencing; SEM, standard error of mean; UMAP, uniform manifold approximation and projection.
Fig. 6
Fig. 6. Triplet LNP enhances CD8+ T-cell activation and proliferation in the tdLN and induces immunological memory.
A Pie charts show the mean frequency of immune subsets within CD45+ cells in the tdLN quantified by flow cytometry (n = 7 animals/group). Bar graphs show the frequency of (B) Ki-67+ CD8+ T cells, (C) Granzyme B+ CD8+ T cells and (D) CD44hi CD62Lhi CD8+ T cells in the tdLN (n = 7 animals/group). E UMAP plot of CITE-seq dataset containing CD45+ sorted cells from tdLN of vehicle, control LNP, and Triplet LNP-treated mice (n = 5 animals/group). High-resolution clustering of the T-cell compartment of the dataset is shown on the right. Below, pie charts show the relative abundance of different T-cell subsets in the tdLN dataset across different treatments. F Dot plot highlights differentially expressed genes associated with effector function and migration in distinct CD8+ T-cell clusters of the tdLN CITE-seq dataset across different treatments. Dot size represents the percentage of cells expressing the gene and color gradient represents average scaled expression within a cell cluster. G Schematic outline of experimental procedures and survival curves of MC38 tumor-bearing mice treated with vehicle, control LNP or Triplet LNP in the presence or absence of FTY720 (0.9% NaCl/vehicle n = 12 animals; 0.9% NaCl/control LNP n = 10 animals; 0.9% NaCl/triplet LNP n = 11 animals; FTY720/vehicle n = 11 animals; FTY720/control LNP n = 12 animals; FTY720/triplet LNP n = 11 animals). H Bar graph shows the IFN-γ-secreting CD8+ T cells from spleens of naïve mice (n = 8 animals), vehicle-treated mice (n = 7 animals), control LNP-treated mice (n = 6 animals), and Triplet LNP-treated mice (n = 8 animals). I Schematic outline of experimental procedures and MC38 (control n = 17 animals; rechallenge=8 animals) and E0771 (control n = 4 animals; rechallenge n = 6 animals) tumor growth curves of control mice and rechallenged complete regressors. BD, H One-way ANOVA followed by post hoc Tukey’s multiple comparisons test and (G) Gehan-Breslow-Wilcoxon test were performed. Data shown in (AD) are representative of three independent experiments. Data shown in (G) is pooled from two independent experiments. Bars show mean. Error bars indicate SEM. Source data for (AD, GI) are provided as a Source Data file. CITE, cellular indexing of transcriptomes and epitopes by sequencing; FTY720, fingolimod; tdLN, tumor-draining lymph node; SEM, standard error of mean; UMAP, uniform manifold approximation and projection.
Fig. 7
Fig. 7. Intratumoral injection of Triplet LNP induces regression of distal tumors.
A Schematic outline of experimental procedures. Created in BioRender. Laoui, D. (2024) https://BioRender.com/j25s690. B MC38 tumor individual growth curves of treated and nontreated tumors. Treated (right flank) tumors received three injections of vehicle, control LNP or Triplet LNP (n = 12 animals/group). Vertical dotted lines indicate intratumoral injections of the treated tumors. C MC38 tumor growth curves of treated and nontreated tumors (n = 12 animals/group). Vertical dotted lines indicate intratumoral injections of the treated tumors. D Survival curves of MC38 tumor-bearing mice treated with vehicle, control LNP or Triplet LNP (n = 12 animal/group). E Schematic outline of experimental procedures. Created in BioRender. Laoui, D. (2024) https://BioRender.com/l86l838F E0771 tumor individual growth curves of treated and nontreated tumors. Treated (right flank) tumors received three injections of vehicle, control LNP or Triplet LNP (n = 6 animals/group). Vertical dotted lines indicate intratumoral injections of the treated tumors. G E0771 tumor growth curves of treated and nontreated tumors (n = 6 animals/group). Vertical dotted lines indicate intratumoral injections of the treated tumors. H Survival curves of E0771 tumor-bearing mice treated with vehicle, control LNP or Triplet LNP (n = 6 animals/group). C, G Repeated measures two-way ANOVA followed by post hoc Tukey’s multiple comparisons test and (D, H) log-rank (Mantel-Cox) test were performed. Horizontal lines show mean. Data shown in (BD) are pooled from two independent experiments. Error bars indicate SEM. Source data are provided as a Source Data file. SEM, standard error of mean.
Fig. 8
Fig. 8. LNP-formulated mRNA leads to efficient protein expression in human cells.
A Representative flow cytometry plots and bar graph show the frequency of Thy1.1+ cells in cell suspensions of NSCLC biopsies 18 h post incubation with vehicle, 500 ng/ml naked Thy1.1 mRNA, or 500 ng/ml Thy1.1 LNP (n = 3 NSCLC biopsies/group). One-way ANOVA followed by post hoc Tukey’s multiple comparisons test was performed. B Scatter plot shows the frequency of CD45+ and CD45- cells within Thy1.1+ cells (n = 3 NSCLC biopsies). C Representative flow cytometry plots show the frequency of Thy1.1+ cells within myeloid and lymphoid lineages. D Scatter plot shows the frequency of myeloid and lymphoid cells within Thy1.1+ CD45+ cells (n = 3 NSCLC biopsies). E Bar graph shows the frequency of immune cell subsets within Thy1.1+ CD45+ cells (n = 3 NSCLC biopsies). F Kaplan-Meier estimates of overall survival comparing the top (high) and bottom (low) of cancer patients based on the median expression of the indicated genes. Hazard ratio (HR) with 95% confidence interval. p values calculated using log rank test. Tick marks indicate censoring. Bars and horizontal lines show mean. Error bars indicate SEM. Source data for (A, B, D, E) are provided as a Source Data file. NSCLC, non-small cell lung carcinoma; SEM, standard error of mean.

References

    1. Qin, S. et al. mRNA-based therapeutics: powerful and versatile tools to combat diseases. Signal Transduct. Target. Ther.7, 166 (2022). - PMC - PubMed
    1. Beck, J. D. et al. mRNA therapeutics in cancer immunotherapy. Mol. Cancer20, 69 (2021). - PMC - PubMed
    1. Van Lint, S. et al. Intratumoral Delivery of TriMix mRNA Results in T-cell Activation by Cross-Presenting Dendritic Cells. Cancer Immunol. Res.4, 146–156 (2016). - PubMed
    1. Hotz, C. et al. Local delivery of mRNA-encoding cytokines promotes antitumor immunity and tumor eradication across multiple preclinical tumor models. Sci. Transl. Med.13, eabc7804 (2021). - PubMed
    1. Hewitt, S. L. et al. Intratumoral IL12 mRNA Therapy Promotes TH1 Transformation of the Tumor Microenvironment. Clin. Cancer Res.26, 6284–6298 (2020). - PubMed

Publication types

MeSH terms

Associated data