. 2024 Dec 5;15(1):10625.
doi: 10.1038/s41467-024-54915-6.

Population genomics and transcriptomics of Plasmodium falciparum in Cambodia and Vietnam uncover key components of the artemisinin resistance genetic background

Affiliations

Population genomics and transcriptomics of Plasmodium falciparum in Cambodia and Vietnam uncover key components of the artemisinin resistance genetic background

Sourav Nayak et al. Nat Commun. .

Abstract

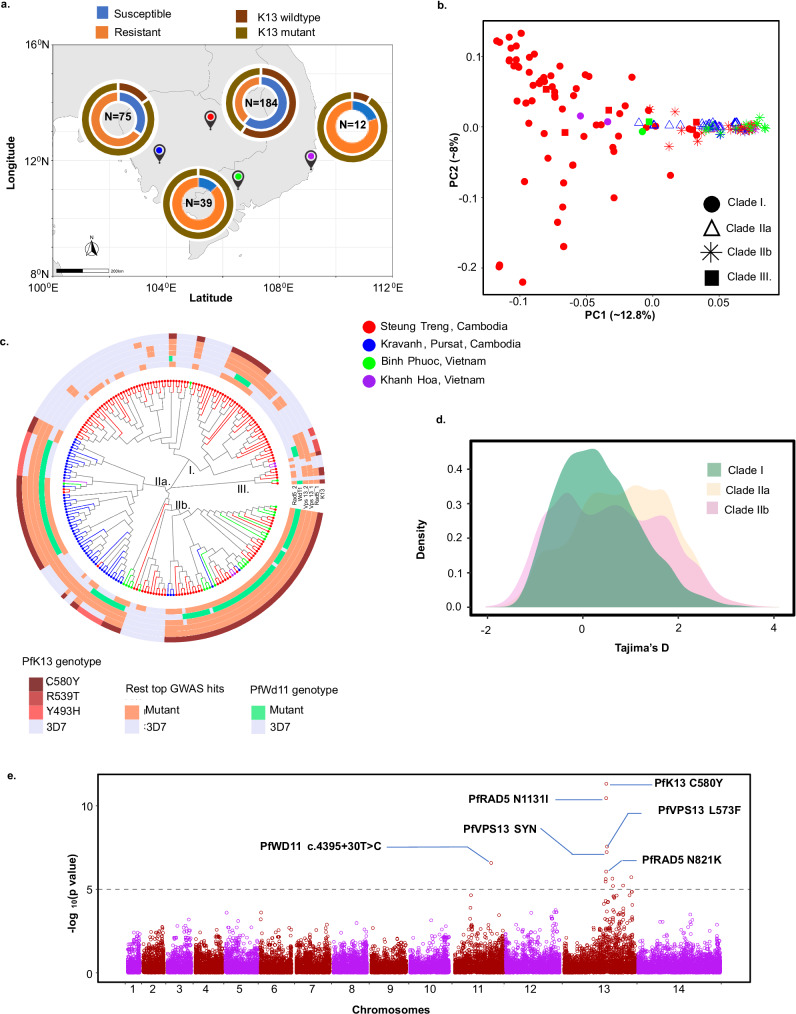
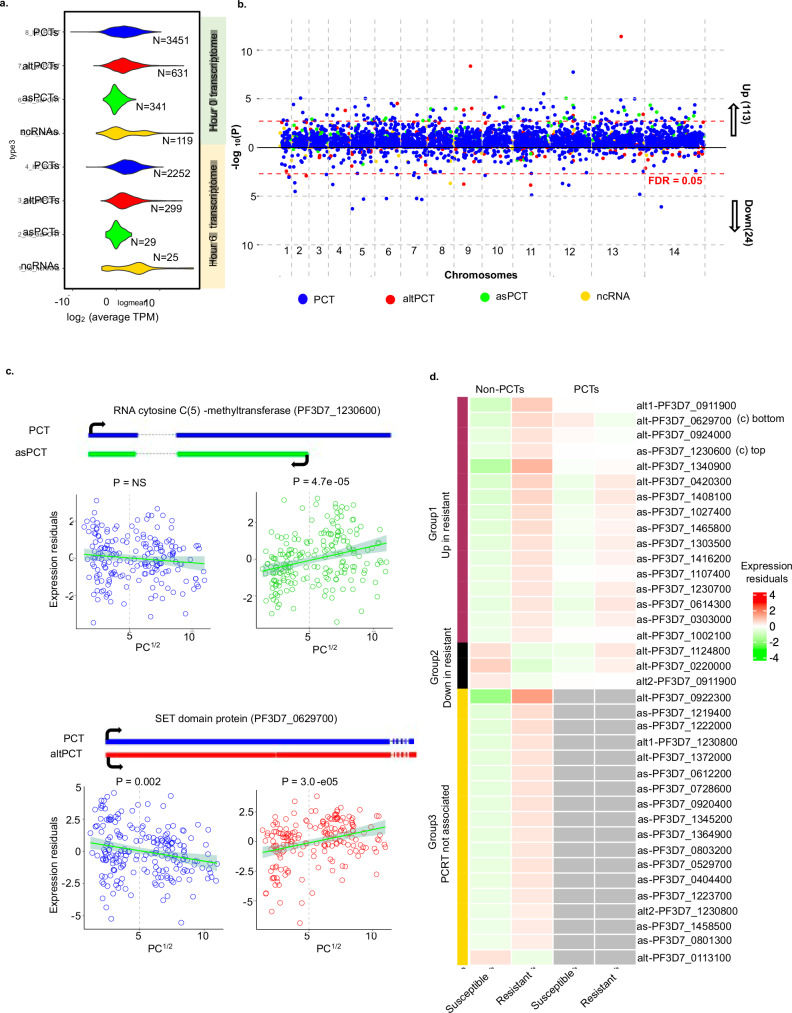
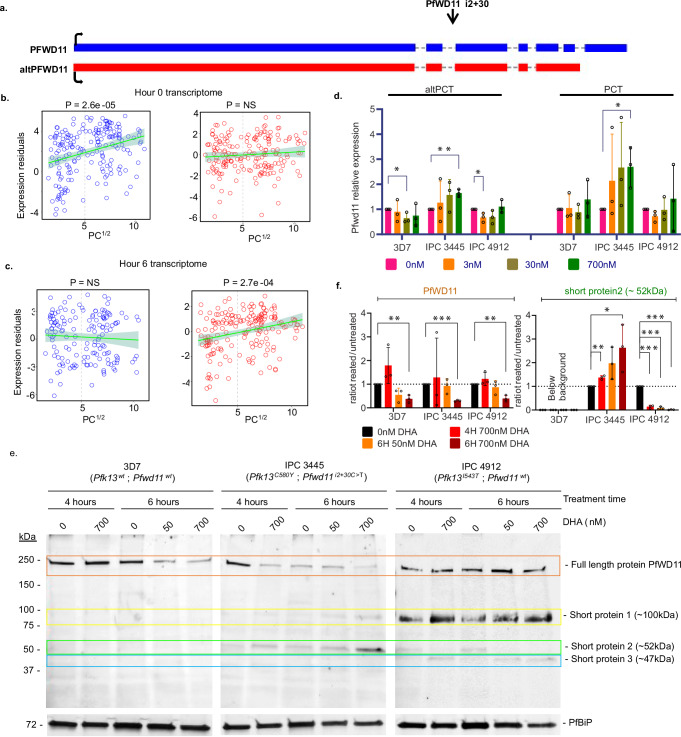
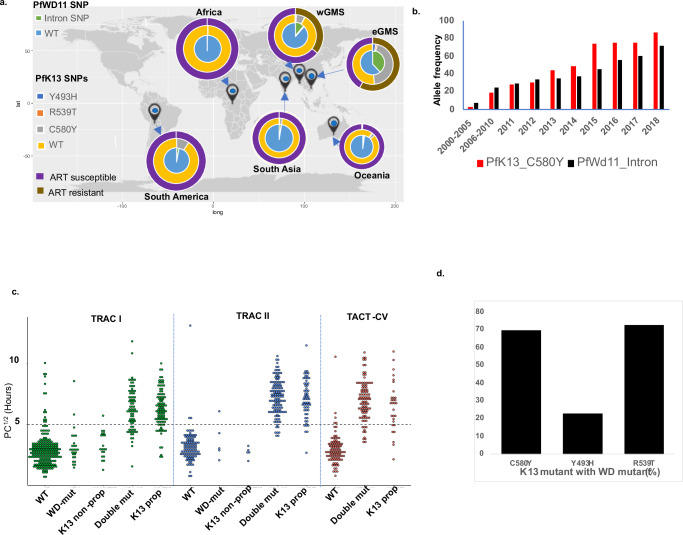
The emergence of Plasmodium falciparum parasites resistant to artemisinins compromises the efficacy of Artemisinin Combination Therapies (ACTs), the global first-line malaria treatment. Artemisinin resistance is a complex genetic trait in which nonsynonymous SNPs in PfK13 cooperate with other genetic variations. Here, we present population genomic/transcriptomic analyses of P. falciparum collected from patients with uncomplicated malaria in Cambodia and Vietnam between 2018 and 2020. Besides the PfK13 SNPs, several polymorphisms, including nonsynonymous SNPs (N1131I and N821K) in PfRad5 and an intronic SNP in PfWD11 (WD40 repeat-containing protein on chromosome 11), appear to be associated with artemisinin resistance, possibly as new markers. There is also a defined set of genes whose steady-state levels of mRNA and/or splice variants or antisense transcripts correlate with artemisinin resistance at the base level. In vivo transcriptional responses to artemisinins indicate the resistant parasite's capacity to decelerate its intraerythrocytic developmental cycle (IDC), which can contribute to the resistant phenotype. During this response, PfRAD5 and PfWD11 upregulate their respective alternatively/aberrantly spliced isoforms, suggesting their contribution to the protective response to artemisinins. PfRAD5 and PfWD11 appear under selective pressure in the Greater Mekong Sub-region over the last decade, suggesting their role in the genetic background of the artemisinin resistance.


Conflict of interest statement

Competing interests: The authors declare no competing interests.

Figures

Fig. 1
Fig. 1. Genetic features of the parasite cohort.
a Geographic distribution of the clinical isolates along with their resistance status. The colors of the points agree with the point colors of the PCA plot and the node color of the neighbor-joining tree. b The first two principal components are showing the population structure of the parasites. The shape of the points corresponds to the clade classification defined in the tree. c Neighbor-joining tree separating parasites into three major clades. The circle encompassing the tree shows the allelic distribution of the top 6 GWAS hits. d Differential distribution of the Tajima’s D for three clades defined by the neighbor-joining tree. e SNPs linked with PC1/2 by genome-wide association study. The P values were obtained by fitting data in linear mixed model implemented in FastLMM packages. Presented P values are uncorrected. Apart from the locus at chromosome 13 already known to be linked with parasite resistance, a novel locus at chromosome 11 passed the statistical cut-off and comprises a single intronic variation in the WD repeat-containing gene (Pf3D7_1138800). Source data are provided as a Source Data file.
Fig. 2
Fig. 2. Parasite transcriptomes and their association with resistance.
a The expression and detection levels of four different classes of transcripts were measured in both 0 hr baseline and 6 hr induced transcriptomes. b The Manhattan plot of the Transcriptome-Phenotype Association Study (TPAS) depicts upregulated and downregulated transcripts in resistant parasites along with their transcript classes as marked by the shape of the points. c An example of upregulated asPCT (anti-sense RNA, top panel, points in red) and down-regulated corresponding aPCTs (annotated protein coding transcripts, top panel, points in blue) in the resistant parasites. An example of an upregulated altPCT (alternatively spliced RNA, bottom panel, points in red) and down-regulated corresponding aPCTs (bottom panel, points in blue) in the resistant parasites. d The heatmap shows mean expression residuals of non-PCT transcripts found to be up-regulated or down-regulated in artemisinin resistant parasites and the expression profile of their corresponding aPCTs. Source data are provided as a Source Data file. Panels B, C present the uncorrected P values that were calculated by fitting data to the Generalized Additive Model.
Fig. 3
Fig. 3. In vivo transcriptional response to TACT/ACT treatment.
a Induction or repression of PCTs upon treatment with artemisinin combination therapy on parasite with PC1/2 < 5 hours (left) and PC1/2 < 5 hours resistant (right) parasite groups. Any transcripts with FDR <1e-05 considered as significant and commonly induced/repressed transcripts are marked as un-filled blue colored circles. The background and point color of the volcano plots are to differentiate the resistant parasites from susceptible parasites and PCTs from non-s respectively. White and beige background signifies the parasite groups as susceptible and resistant respectively, whereas blue circles here represent up-regulated/repressed PCTs with statistical significance. b Pathways linked with 555 PCTaPCTs suppression in the resistant parasites with P < 0.05 from the enrichment analysis. c An example of differentially regulated asPCT compared to corresponding PCT in the resistant parasites. Approximately scaled transcript structure of PCT/asPCT pair is shown above of violin plots. d Alternatively spliced PfRAD5 was found as repressed upon treatment in both susceptible and resistant parasite groups. Approximately scaled transcript structures shown above the violin plot reflect intron retention event in altPCT of PfRAD5. Source data are provided as a Source Data file. Panels A-D present the uncorrected P values that were calculated by fitting data to the Generalized Additive Model.
Fig. 4
Fig. 4. PfWD11 as a novel marker for artemisinin resistance.
a Transcript structure of PRT/altPRT pair of PfWD11 gene showing retention of intron 5 for the alternatively spliced isoform. The black arrow shows the position of intronic SNP associated with PC1/2 in GWAS. b Transcriptome-phenotype association for hour 0 transcriptome shows up-regulation of PCT in resistant parasites (left, blue) compared to susceptible parasites, whereas no significant changes in the expression level were observed for altPCT (right, red). c Opposite to hour 0 transcriptome, in hour 6 transcriptome there were no significant changes in PCT expression observed between the resistant and susceptible group, but altPCT was found upregulated in resistant parasites. d Real-time PCR values for two artemisinin-resistant (IPC3445 and IPC4912) and one artemisinin-sensitive stain (3D7) after a 2-hour treatment with varying concentrations of Dihydroartemisinin (DHA). Values are shown as a ratio of PfWD11 expression compared to untreated control (0 nM DHA). DHA concentrations are indicated by different colors. Significance values were calculated using unpaired, two-tailed heteroscedastic t-test against untreated control. Values were obtained from three biological and three technical replicates. e Western blot images for the three tested strains are shown, illustrating the different levels of PfWD11 processing after 4-hour and 6-hour DHA treatments. In the 3D7 sensitive strain, only the full-length PfWD11 (orange) is present, with no significant additional bands detected over the background. In contrast, the resistant strains exhibit several smaller proteins, with a particular ~52 kDa band (Short protein 2, green) showing opposite regulation patterns in IPC3445 and IPC4912 in response to DHA treatment. f Graph showing the ratio of full-length PfWD11 abundance after DHA treatment compared to untreated control (left panel); Graph showing the ratio of the abundance of Short protein 2 after DHA treatment compared to its untreated control (right panel). Abundance was measured by densitometry in three biological replicates and values were normalized to PfBiP. Significance values were calculated using unpaired, two-tailed heteroscedastic t-test against untreated control. Source data are provided as a Source Data file. Panels B, C present the uncorrected P values that were calculated by fitting data to the Generalized Additive Model.
Fig. 5
Fig. 5. Allelic features of PfWD11 i2 + 30 T > C.
a World-wide distribution of PfWD11 i2 + 30 C allele (mutant) on the background of the three PfK13 propeller domain mutations (found in this study) and resistance status from the Pf7 dataset. b Temporal changes of PfK13 C580Y and PfWD11 i2 + 30 C allele frequencies in the three countries of wGMS (Cambodia, Vietnam, and Thailand) showed an increasing trend. c PC1/2 plotted along with the different combinations of PfK13 - PfWD11 genotypes for three large-scale epidemiological studies: TRAC I, TRAC II, and TACT-CV. (WT = wild type, K13 non-prop= mutations in PfK13 but not in propeller domain, WD-mut= PfWD11 i2 + 30 T > C but no K13 mutations, Double_mut= PfWD11 i2 + 30 T > C along with K13 mutations in propeller domain, K13 prop = K13 mutations in propeller domain but PfWD11 i2 + 30 T > C absent). d Pf7 database shows that the PfWD11 i2 + 30 T > C allele highly coexisted with PfK13 C580Y and R539T alleles for >70% and Y493H allele carrying isolates. Source data are provided as a Source Data file.

References

    1. Dondorp, A. M. et al. Artemisinin resistance in Plasmodium falciparum malaria. N. Engl. J. Med361, 455–467 (2009). - PMC - PubMed
    1. Noedl, H. et al. Evidence of artemisinin-resistant malaria in western Cambodia. N. Engl. J. Med359, 2619–2620 (2008). - PubMed
    1. Jacob, C. G. et al. Genetic surveillance in the Greater Mekong subregion and South Asia to support malaria control and elimination. Elife1010.7554/eLife.62997 (2021). - PMC - PubMed
    1. Conrad, M. D. et al. Evolution of Partial Resistance to Artemisinins in Malaria Parasites in Uganda. N. Engl. J. Med389, 722–732 (2023). - PMC - PubMed
    1. Fidock, D. A. & Rosenthal, P. J. Artemisinin resistance in Africa: How urgent is the threat? Med2, 1287–1288 (2021). - PMC - PubMed

Publication types

Associated data